INTRODUCTION
Protein energy malnutrition is a common clinical mani-
festation of patients with end-stage liver disease waiting for liver transplantation (LT) [1], and it is a risk factor for morbidity and mortality after LT [2]. The nutritional status
Received January 7, 2020 Revised February 17, 2020 Accepted February 21, 2020 Corresponding author: Kwang Il Seo Department of Internal Medicine, Kosin University College of Medicine, 262 Gamcheon-ro, Seo-gu, Busan 49267, Korea
Tel: +82-51-990-5205 Fax: +82-51-990-5055 E-mail: [email protected]
Poor preoperative enteral nutrition would be a risk factor for readmission due to infection after liver transplantation
Kyung Won Seo
1,2, Kwang Il Seo
2,3, Hye Min Ha
2, Jee Young Lee
2, Young Il Choi
1,2, Hyung Hwan Moon
1,2, Ki Hyun Kim
1,2, Yeon Myung Shin
1,2, Yong Seok Park
2,4, Hyuk Rae Cho
2,41Department of Surgery, Kosin University College of Medicine, Busan, Korea
2Nutritional Support Team, Kosin University Gospel Hospital, Busan, Korea
3Department of Internal Medicine, Kosin University College of Medicine, Busan, Korea
4Department of Neurosurgery, Kosin University College of Medicine, Busan, Korea
Background: Most patients who undergo liver transplantation (LT) have advanced cir- rhosis and poor nutritional status. The aim of this study was to investigate the effect of enteral nutrition (EN) on the clinical outcomes after LT.
Methods: From 2015 to 2019, the medical records of recipient of LT at Kosin University Gospel Hospital were retrospectively reviewed.
Results: Thirty-seven patients underwent LT. Nineteen patients underwent living donor liver transplantation (LDLT) and 18 patients underwent deceased donor liver transplan- tation (DDLT). One LDLT patient was excluded because transplantation was done within 1 month. Five DDLT patients were excluded either because they died within 1 month (n=4) or received transplantation within 1 month. (n=1). Therefore, 31 patients were an- alyzed. Psoas-muscle index (P=0.715) and serum albumin (P=0.111) were not statisti- cally different between the LDLT and DDLT groups. Four patients (4/31) were readmitted because of infection. One LDLT patient was diagnosed with genitourinary infection. The three DDLT patients were diagnosed with pulmonary tuberculosis (n=1), diverticulitis (n=1), and sepsis (n=1). Readmission caused by infection was not statistically different between LDLD and DDLT patients (P=0.284). Preoperative EN <25% of the recommend- ed amount (P=0.016) was significantly associated with readmission related to infection.
In multivariate analyses, preoperative EN <25% was an independent risk factor for read- mission due to infection after LT regardless of psoas-muscle index, baseline Model for End-Stage Liver Disease score, or LT type.
Conclusions: Preoperative poor EN is significantly associated with readmission risk due to infection within 3 months of LT.
Keywords: Liver transplantation; Enteral nutrition; Infection; Psoas-muscle index
© The Korean Society for Transplantation This is an Open Access article distributed under the terms of the Creative Commons Attribution Non-Commercial License (http://creativecommons.org/licenses/
by-nc/4.0/) which permits unrestricted non-commercial use, distribution, and reproduction in any medium, provided the original work is properly cited.
pISSN 2671-8790
eISSN 2671-8804
of liver transplant recipients can deteriorate rapidly due to underlying malnutrition, surgical stress, immunosuppres- sive therapy, postintervention complications, postopera- tive protein metabolism, and pretransplant fasting periods [3]. Resumption of oral nutrition within 12 hours after LT has been shown to reduce postoperative viral infec- tion and maintain adequate nitrogen balance. Therefore, the transplant recipient should start to consume small amounts of oral nutrition after LT and gradually increase their amount according to their ability [4]. However, there is little research on the clinical importance of enteral feeding before LT. The aim of this study is to investigate the effect of enteral feeding before surgery on clinical out- comes after LT.
METHODS
This study was approved by the Institutional Review Board/Ethics Committee of Kosin University Gospel Hos- pital (IRB No. KUGH 2019-09-019). Informed consent was waived because of the retrospective study design.
Study Population
From January 2015 to May 2019, the medical records of patients who underwent LT at Kosin University Gospel Hospital were retrospectively analyzed. A total of 37 pa- tients underwent LT: 18 with deceased donor liver trans- plantation (DDLT) and 19 with living donor liver transplan- tation (LDLT). Liver recipients who survived for more than 3 months after transplantation were defined as subjects of this study. In the DDLT group, four patients died with- in 1 month after LT. Forty-seven-year-old male recipient died at 25 days after LT due to graft failure. The amount of enteral nutrition (EN) before LT was poor (EN <25%). Fifty- seven-year-old male recipient died at 23 days after trans- plantation due to acute rejection (EN 25%–50%). Sixty- year-old male recipient died at 4 days after LT due to graft failure caused by vascular complication (EN 50%–75%).
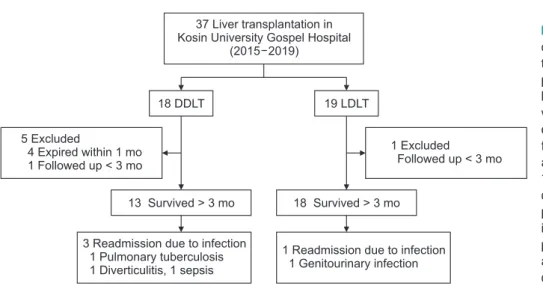
Forty-year-old male recipient died at 31 days after trans- plantation due to graft failure (EN <25%). One patient in DDLT group received transplantation within 1 month. In the LDLT group, only one patient received transplantation within 1 month. Consequently, 13 DDLT patients and 18 LDLT patients, for a total of 31 patients, were analyzed in this study (Fig. 1).
HIGHLIGHTS
• Resumption of oral nutrition within 12 hours after liver transplantation (LT) has been shown to reduce postop- erative viral infection and maintain adequate nitrogen balance.
• In addition, our study revealed that preoperative poor enteral nutrition (EN) was significantly associated with readmission risk due to infection within 3 months of LT.
• Therefore, patients who are preparing for liver trans- plantation should be encouraged to maintain adequate EN to reduce risk of infection and readmission after liv- er transplantation.
1 Readmission due to infection 1 Genitourinary infection 37 Liver transplantation in
Kosin University Gospel Hospital (2015 2019)
19 LDLT 18 DDLT
5 Excluded
4 Expired within 1 mo 1 Followed up < 3 mo
1 Excluded
Followed up < 3 mo
13 Survived > 3 mo 18 Survived > 3 mo
3 Readmission due to infection 1 Pulmonary tuberculosis 1 Diverticulitis, 1 sepsis
Fig. 1. Flowchart of study population. A total
of 37 patients underwent liver transplanta-
tion (LT): 18 with deceased donor liver trans-
plantation (DDLT) and 19 with living donor
liver transplantation (LDLT). Recipients sur-
vived for more than 3 months after LT were
enrolled in this study. In the DDLT group,
four patients died within 1 month after LT
and 1 patient received transplantation within
1 month. One patient in the LDLT group re-
ceived transplantation within 1 month. One
patient with LDLT was diagnosed with gen-
itourinary infection and hospitalized. Three
patients who received DDLT were diagnosed
and hospitalized for pulmonary tuberculosis,
diverticulitis, and sepsis, respectively.
Nutritional Status
We estimated skeletal muscle mass as an objective nutri- tional measure of patients with advanced liver cirrhosis.
Since it is practically impossible to estimate a patient’s total skeletal muscle, we used the psoas-muscle index (PMI), which is known to be highly correlated with total skeletal muscle mass. Patients’ PMI was measured via abdominal computed tomography (CT) within the month before LT. All abdominal CT images were analyzed using
PACS (picture archiving and communication system). The cross-sectional area of the bilateral psoas on the axial plane was measured at the lower level of the third lumbar vertebra. PMI was obtained by summing the areas of both sides of the lumbar vertebrae at the third lumbar spine on CT and patients’ squared heights were standardized (cm
2/ m
2). The ImageJ program developed at the National Insti- tutes of Health (Bethesda, MD, USA) was used to measure the psoas muscle area.
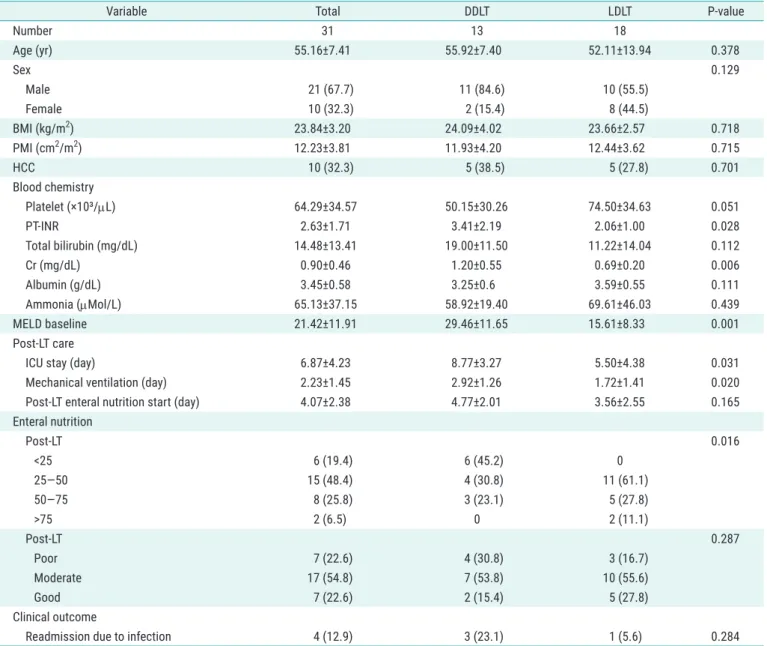
Table 1. Baseline characteristics and clinical outcomes of liver transplantation recipients
Variable Total DDLT LDLT P-value
Number 31 13 18
Age (yr) 55.16±7.41 55.92±7.40 52.11±13.94 0.378
Sex 0.129
Male 21 (67.7) 11 (84.6) 10 (55.5)
Female 10 (32.3) 2 (15.4) 8 (44.5)
BMI (kg/m
2) 23.84±3.20 24.09±4.02 23.66±2.57 0.718
PMI (cm
2/m
2) 12.23±3.81 11.93±4.20 12.44±3.62 0.715
HCC 10 (32.3) 5 (38.5) 5 (27.8) 0.701
Blood chemistry
Platelet (×10³/µL) 64.29±34.57 50.15±30.26 74.50±34.63 0.051
PT-INR 2.63±1.71 3.41±2.19 2.06±1.00 0.028
Total bilirubin (mg/dL) 14.48±13.41 19.00±11.50 11.22±14.04 0.112
Cr (mg/dL) 0.90±0.46 1.20±0.55 0.69±0.20 0.006
Albumin (g/dL) 3.45±0.58 3.25±0.6 3.59±0.55 0.111
Ammonia (µMol/L) 65.13±37.15 58.92±19.40 69.61±46.03 0.439
MELD baseline 21.42±11.91 29.46±11.65 15.61±8.33 0.001
Post-LT care
ICU stay (day) 6.87±4.23 8.77±3.27 5.50±4.38 0.031
Mechanical ventilation (day) 2.23±1.45 2.92±1.26 1.72±1.41 0.020
Post-LT enteral nutrition start (day) 4.07±2.38 4.77±2.01 3.56±2.55 0.165
Enteral nutrition
Post-LT 0.016
<25 6 (19.4) 6 (45.2) 0
25–50 15 (48.4) 4 (30.8) 11 (61.1)
50–75 8 (25.8) 3 (23.1) 5 (27.8)
>75 2 (6.5) 0 2 (11.1)
Post-LT 0.287
Poor 7 (22.6) 4 (30.8) 3 (16.7)
Moderate 17 (54.8) 7 (53.8) 10 (55.6)
Good 7 (22.6) 2 (15.4) 5 (27.8)
Clinical outcome
Readmission due to infection 4 (12.9) 3 (23.1) 1 (5.6) 0.284
Values are presented as mean±standard deviation or number (%).
DDLT, deceased donor liver transplantation; LDLT, living donor liver transplantation; BMI, body mass index; PMI, psoas-muscle index; HCC, hepatocellular carcinoma; PT, prothrombin time; INR, international normalized ratio; Cr, creatinine; MELD, Model for End-Stage Liver Disease; LT, liver transplantation;
ICU, intensive care unit.
Enteral Nutrition Assessment
The liver transplant waiting list is typically assessed by a nutritionist in our transplantation center before trans- plant. Clinical dietitians interviewed the patients and evaluated their oral intake for 2 weeks before LT. Patients’
enteral nutritional status was divided into four categories:
<25%, 25%–50% 50%–75%, and >75% of target nutritional intake. Target nutritional intake was defined by Europe- an Association for the Study of the Liver (EASL) Clinical Practice Guidelines on nutrition in chronic liver disease [5]:
>30 kcal/kg/day for preoperative cirrhotic patients. After LT, the enteral nutritional intake of patients was evaluated by our transplantation center’s nurses who specialize in LT. The post-LT enteral nutritional intake level was divided into: poor (<30%), moderate (30%–60%), and good (>60%).
Clinical Outcome of LT
To evaluate clinical outcomes after LT, we analyzed the duration of intensive care unit (ICU) stay, mechanical ven- tilatory care and total admission duration after LT. From the time of LT, we evaluated initiation and amount of EN intake. Importantly, we also reviewed patients’ rehospital- ization frequency due to infection, cause of infection and treatment progress from their medical records.
Statistical Analysis
Means, and standard deviations were calculated for all continuous variables, and an independent t-test was per- formed to compare means between transplantation type (DDLT and LDLT) groups. Categorical variables were ex- pressed as percentages and the chi-square test was used to compare patient groups. Multivariate logistic regres- sion analyses were performed to identify risk factors for rehospitalization due to infection. Statistical significance was determined at P<0.05, and IBM SPSS ver. 21.0 (IBM Corp., Armonk, NY, USA) was used for all analyses.
RESULTS Baseline Characteristics
Thirty-one patients underwent LT were included in this study. The mean patient age was 55.1 years, and 21 pa- tients were male and 10 were female. The thirteen pa- tients who underwent DDLT had a mean age of 55.9 years and included 11 males and two females. The eighteen pa- tients who underwent LDLT had a mean age of 52.1 years
and included 10 men and 8 women. (Table 1). Ten patients (32.3%) underwent LT due to hepatocellular carcinoma:
five with DDLT and five with LDLT. Baseline Model for End- Stage Liver Disease score (P=0.001), PT-INR (P=0.028), and serum creatinine (P=0.006) were statistically different between the LDLT and DDLT groups, respectively. Howev- er, serum albumin level was not different (P=0.006).
Nutritional Status before LT
Mean baseline body mass index (BMI) for all patients was 23.8 kg/m
2: 24.1 kg/m
2for the DDLT group, and 23.6 kg/
m
2for the LDLT group, and the groups were not signifi- cantly different (P=0.718). The mean PMI for all patients was 12.227±3.812 cm
2/m
2, which we used as an objective measure of baseline nutritional status. The mean baseline PMI was 11.925±4.197 cm
2/m
2among DDLT patients and 12.444±3.619 cm
2/m
2among LDLT patients; this differ- ence was not statistically different (P=0.715) (Table 1).
Nutritional Support Peritransplantation Pretransplantation
Clinical dietitians interviewed all patients and evaluat- ed their enteral intake for 2 weeks before LT. The enter- al intake was classified into four levels according to a comparison with the recommended 30 kcal/kg/day for preoperative cirrhotic patients suggested by the EASL [5]. Among the 31 liver transplant recipients, six (19.4%) had <25% enteral intake before surgery. Fifteen patients (48.4%) had enteral intake of 25%–50%, eight patients (25.8%) had enteral intake of 50%–75%, and two patients (6.5%) had enteral intake of ≥75%. In the DDLT group, six patients (45.2%) had enteral intake <25%, four patients (30.8%) had 25%–50%, three patients (23.1%) had 50%–
75% and no patients (0.0%) had ≥75%. In the LDLT group, 11 patients (61.1%) had enteral intake between 25% and 50%, five patients (27.8%) between 50% and 75%, and two patients (11.1%) had ≥75%. Differences in enteral intake between the two groups were statistically significant (P=0.016) (Table 1).
Posttransplantation
Recipients’ enteral intake was assessed by specialized nurses in the transplantation center until discharge.
Among all 31 recipients, seven (22.6%) showed poor en-
teral intake, 17 (54.8%) were able to maintain moderate
enteral intake, and seven patients (22.6%) had good en-
teral intake. In the DDLT group, four patients (30.8%) had
poor enteral intake, seven patients (53.8%) had moderate
enteral intake, and two patients (15.4%) had good enteral intake. In the LDLT group, three patients (16.7%) had poor enteral intake, 10 (55.6%) maintained moderate intake, and five (27.8%) had good enteral intake. Enteral intake after LT was not associated with LT type (P=0.287) (Table 1).
Post-LT Care
The total mean duration of ICU admission was 6.8 days:
8.7 days for DDLT and 5.5 days for LDLT (P=0.031). In ad- dition, the mechanical ventilation period was 2.9 days in the DDLT group, but only 1.7 days in LDLT group (P=0.020).
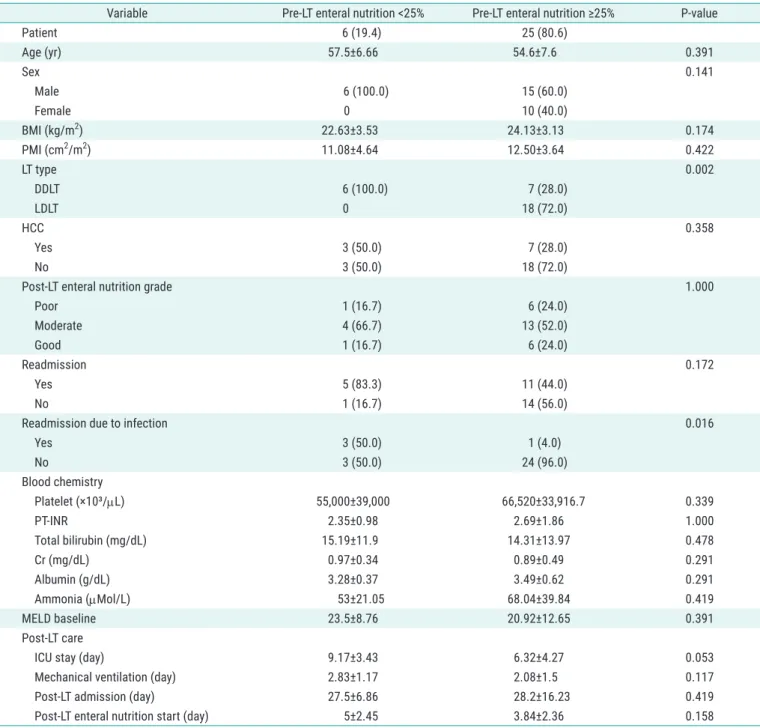
Table 2. Baseline characteristics and clinical outcomes according to amount of enteral nutrition before liver transplantation
Variable Pre-LT enteral nutrition <25% Pre-LT enteral nutrition ≥25% P-value
Patient 6 (19.4) 25 (80.6)
Age (yr) 57.5±6.66 54.6±7.6 0.391
Sex 0.141
Male 6 (100.0) 15 (60.0)
Female 0 10 (40.0)
BMI (kg/m
2) 22.63±3.53 24.13±3.13 0.174
PMI (cm
2/m
2) 11.08±4.64 12.50±3.64 0.422
LT type 0.002
DDLT 6 (100.0) 7 (28.0)
LDLT 0 18 (72.0)
HCC 0.358
Yes 3 (50.0) 7 (28.0)
No 3 (50.0) 18 (72.0)
Post-LT enteral nutrition grade 1.000
Poor 1 (16.7) 6 (24.0)
Moderate 4 (66.7) 13 (52.0)
Good 1 (16.7) 6 (24.0)
Readmission 0.172
Yes 5 (83.3) 11 (44.0)
No 1 (16.7) 14 (56.0)
Readmission due to infection 0.016
Yes 3 (50.0) 1 (4.0)
No 3 (50.0) 24 (96.0)
Blood chemistry
Platelet (×10³/µL) 55,000±39,000 66,520±33,916.7 0.339
PT-INR 2.35±0.98 2.69±1.86 1.000
Total bilirubin (mg/dL) 15.19±11.9 14.31±13.97 0.478
Cr (mg/dL) 0.97±0.34 0.89±0.49 0.291
Albumin (g/dL) 3.28±0.37 3.49±0.62 0.291
Ammonia (µMol/L) 53±21.05 68.04±39.84 0.419
MELD baseline 23.5±8.76 20.92±12.65 0.391
Post-LT care
ICU stay (day) 9.17±3.43 6.32±4.27 0.053
Mechanical ventilation (day) 2.83±1.17 2.08±1.5 0.117
Post-LT admission (day) 27.5±6.86 28.2±16.23 0.419
Post-LT enteral nutrition start (day) 5±2.45 3.84±2.36 0.158
Values are presented as number (%) or mean±standard deviation.
LT, liver transplantation; BMI, body mass index; PMI, psoas-muscle index; LT, liver transplantation; DDLT, deceased donor liver transplantation; LDLT, living
donor liver transplantation; HCC, hepatocellular carcinoma; PT, prothrombin time; INR, international normalized ratio; Cr, creatinine; MELD, Model for End-
Stage Liver Disease; ICU, intensive care unit.
However, the time to start EN after LT was not statistically different between the two groups, starting after 4.7 days in the DDLT group and 3.5 days in the LDLT group (P=0.165).
There was also no significant difference between the two groups in the amount of EN after transplantation between DDLT and LDLT (P=0.287). Our transplant center recom- mended patients not to eat raw foods during the first three months after transplantation. Dietitians encouraged patients to take enough nutrition, especially protein. How- ever, we did not recommend pre or probiotics, specifically.
Moreover, we did not use different diet protocols between DDLT and LDLT. The admission duration after LT was 32.6 days in the DDLT group and 24.7 days in the LDLT group;
the duration difference was not significant (P=0.141).
Readmission Due to Infection after LT LT type
Four of the 31 recipients were readmitted for infection within 3 months after LT, including three DDLT patients and one LDLT patient. The LDLT patient was diagnosed with a genitourinary infection and was hospitalized due to severe oral and genital ulcers. The infectious cause was CMV virus. The three DDLT patients were diagnosed and hospitalized for pulmonary tuberculosis, diverticu- litis, and sepsis, respectively (Fig. 1). Pulmonary tuber- culosis was diagnosed with sputum AFB stain in patient with sustained cough, sputum and progressive dyspnea.
Diverticulitis was confirmed with abdominal CT scan cor- related with colonoscopy underwent before LT. This pa- tient visited outpatient clinic for recurrent abdominal pain and fever. Sepsis was diagnosed in patient visited emer- gency room with sustained fever and general weakness.
Initial vital sign was shock and fever. Blood culture result was gram negative bacteremia. There was no statistical correlation between infection occurrence and LT type (P=0.284) (Table 2).
Amount of enteral nutrition
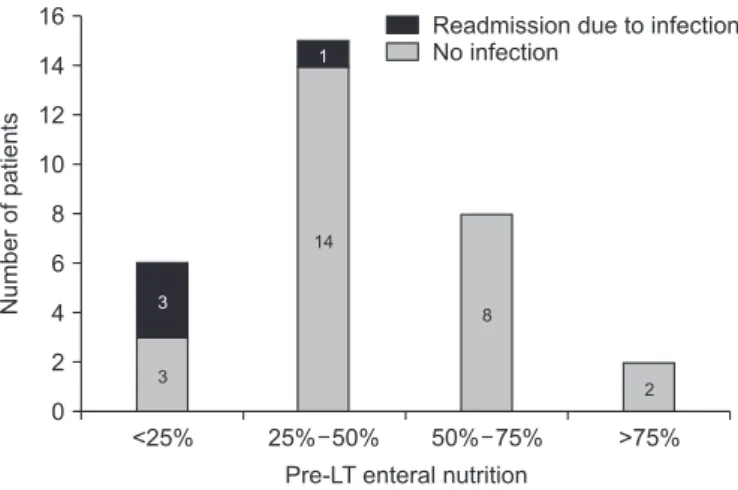
Prior to transplantation, six patients were ingesting <25%
of recommended EN. Three of these patients (50%) were rehospitalized for infection after LT. Fifteen patients main- tained 25%–50% of EN before transplantation, and only one (1/15) of these patients was readmitted for infection.
Among patients who maintained >50% of EN, none (0/10) were readmitted for infection (Fig. 2). Among patients who only maintained <25% enteral intake before transplanta- tion, the readmission rate for infection was 50%. However, this rate dropped to only 4% among patients who man-
aged ≥25% intake (P=0.016) (Fig. 3).
Patients with pretransplant EN <25% were most at risk of readmission for infection within 3 months of LT (P=0.015). Univariable analyses revealed that pretrans- plant EN <25% was closely associated with readmission due to infection (odds ratio, 24.0; 95% confidence interval, 1.852–310.999; P=0.015) (Table 3). Pretransplant enteral intake was an independent risk factor for readmission af- ter LT, regardless of LT type (DDLT vs. LDLT) or PMI.
<25% 25% 50% 50% 75% >75%
16 14 12 10 8 6 4 2
Numberofpatients
Pre-LT enteral nutrition 0
Readmission due to infection No infection
3
1
14
8
2 3
Fig. 2. Pre-LT enteral nutrition and readmission due to infection after liver
transplantation (LT). Six patients were ingesting <25% of the recommend- ed enteral nutrition supply before transplantation, and three (50%) were rehospitalized for infection posttransplantation. Fifteen patients main- tained 25%–50% of enteral nutrition before transplantation, and only one (1/15) was readmitted for infection. No patients who maintained >50%
enteral nutrition (0/10) were readmitted due to infection after LT.
Pre-LT enteral nutrition <25%
50%
4%
60
50
40
30
20
10
0
Readmissionrate(%)
P=0.016
Pre-LT enteral nutririon >25%
Fig. 3. Readmission rate due to infection after liver transplantation (LT)