• 검색 결과가 없습니다.

Clinical Utility of Two Interferon-gamma Release Assays on Pleural Fluid for the Diagnosis of Tuberculous Pleurisy

N/A
N/A
Protected

Academic year: 2022

Share "Clinical Utility of Two Interferon-gamma Release Assays on Pleural Fluid for the Diagnosis of Tuberculous Pleurisy"

Copied!
8
0
0

로드 중.... (전체 텍스트 보기)

전체 글

(1)

Tuberc Respir Dis 2012;73:143-150

CopyrightⒸ2012. The Korean Academy of Tuberculosis and Respiratory Diseases. All rights reserved.

Clinical Utility of Two Interferon-gamma Release Assays on Pleural Fluid for the Diagnosis of Tuberculous Pleurisy

Ji Young Kang, M.D., Chin Kook Rhee, M.D., Na Hyun Kang, Ju Sang Kim, M.D., Hyoung-Kyu Yoon, M.D., Jeong Sup Song, M.D.

Department of Internal Medicine, The Catholic University of Korea College of Medicine, Seoul, Korea

Background: The release of interferon-gamma (IFN-γ) by T lymphocytes increases after rechallenge with Mycobacterium tuberculosis antigen, especially, at a localized site of tuberculosis (TB) infection. We aimed to compare the clincial efficacy of two commercial IFN-γ release assays from pleural fluid for the diagnosis in tuberculous pleurisy.

Methods: We performed T-SPOT.TB and QuantiFERON-TB Gold tests simultaneously on pleural fluid and peripheral blood samples from patients with pleural effusion, in South Korea, an area with intermediate TB burden.

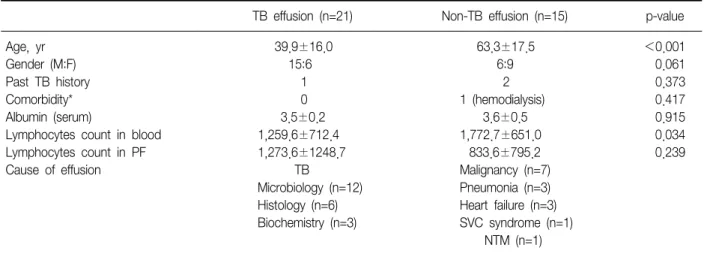
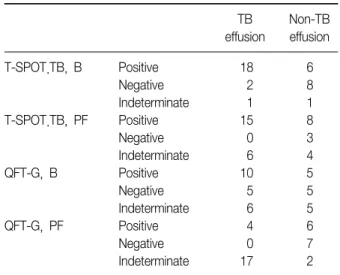
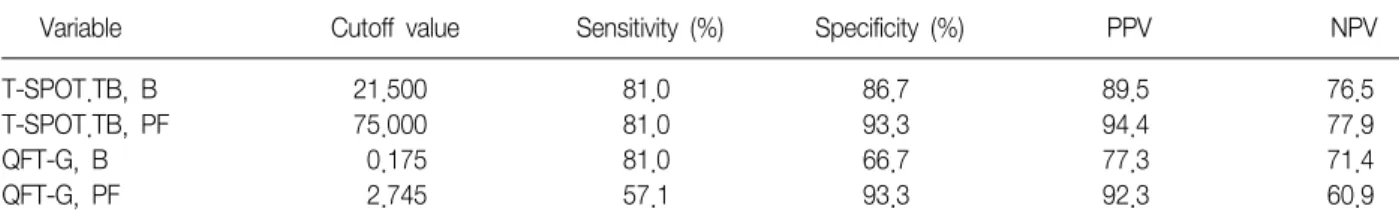
Results: Thirty-six patients were enrolled prospectively, and tuberculous pleurisy was found in 21 patients. Both the numbers of IFN-γ secreting T cells and the concentration of IFN-γ were greater in the pleural tuberculous group, comparing with the non-tuberculous group. Moreover, in the tuberculous group, there was a significant difference in IFN-γ producing spot-forming cells using the T-SPOT.TB method between pleural fluid and peripheral blood. The receiver operating characteristic (ROC) curve, was the greatest for pleural fluid T-SPOT.TB test, followed by peripheral blood T-SPOT.TB test, peripheral blood QuantiFERON-TB Gold test, and pleural fluid QuantiFERON- TB Gold test (area under the ROC curve of 0.956, 0.890, 0.743, and 0.721, respectively). The T-SPOT.TB assay produced less indeterminate results than did QuantiFERON-TB Gold assay in both pleural fluid and peripheral blood.

Conclusion: These findings suggest that the pleural fluid T-SPOT.TB test could be the most useful test among the IFN-γ release assays for diagnosing tuberculous pleurisy in an area with an intermediate prevalence of TB infection.

Key Words: Interferon-gamma Release Tests; Tuberculosis, Pleural

Address for correspondence: Jeong Sup Song, M.D.

Department of Internal Medicine, Yeouido St. Mary's Hospital, The Catholic University of Korea College of Medicine, 62, Yeouido-dong, Yeongdeungpo-gu, Seoul 150-713, Korea

Phone: 82-2-3779-1102, Fax: 82-2-786-1518 E-mail: jssong@catholic.ac.kr

Received: Dec. 8, 2011 Revised: Jan. 30, 2012 Accepted: Aug. 2, 2012

CC

It is identical to the Creative Commons Attribution Non-Commercial License (http://creativecommons.org/licenses/by-nc/3.0/).

Introduction

Tuberculous pleurisy is a common extrapulmonary form of tuberculosis (TB) worldwide and also is the most common manifestation in South Korea 1 . However,

tuberculous pleurisy is frequently difficult to confirm be-

cause existing diagnostic approaches, such as pleural

tapping and biopsy, are relatively invasive and the re-

sults require much time and have variable sensitivity 2-5 .

In the late 1990s, research on the Mycobacterium tu-

berculosis genome led to the identification of early se-

cretory antigenic target-6 (ESAT-6) and culture filtrate

protein-10 (CFP-10), which appear exclusively in M. tu-

berculosis (i.e., not in M. bovis Bacillus Calmette-

Guérin vaccine or most environmental nontuberculous

mycobacteria) 6,7 . Based on the finding that T lympho-

cytes that are exposed to M. tuberculosis release more

interferon-γ (IFN-γ) cytokine on repeat exposure to

these specific antigens, T-cell-based IFN-γ release as-

says (IGRAs) have been developed and are approved

(2)

for diagnosis of latent TB by US and European Union 6-8 . Two tests, the T-SPOT.TB assay (Oxford Immunotec, Oxford, UK) and QuantiFERON-TB assay (Cellestis, Carnegie, Australia), are commercially available. These two methods differ mainly in their techniques for IFN- γ detection (ELISPOT vs. enzyme-linked immunosor- bent assay [ELISA]) and the specimens used (mononu- clear cells vs. whole blood).

During active TB, mycobacterium-specific T cells pro- liferate and are recruited to the site of infection 9,10 . Recognizing this phenomenon and using M. tuber- culosis -specific antigen, Jafari et al. 11 demonstrated that active pulmonary TB can be confirmed rapidly with an ELISPOT assay in bronchoalveolar lavage fluid in smear-negative setting. In tuberculous pleurisy, more CD4+ T lymphocyte subgroups are found in the pleu- ral fluid (PF) than in peripheral blood (blood), and more IFN-γ is secreted by T lymphocytes in the PF than in blood 9 . Therefore, we investigated the clinical utility of two IGRAs applied to both PF and blood ob- tained from patients with pleural effusion for the diag- nosis of tuberculous pleurisy.

Materials and Methods

During the 9-month period from December 2007 to August 2008, consecutive adult patients who visited Yeouido St. Mary's Hospital (Seoul, Korea) with unilat- eral pleural effusion were enrolled prospectively in the study after providing written consent. The Institutional Review Board of Yeouido St. Mary's Hospital approved this study. All patients were asked about their past TB history, clinical symptoms, and radiologic findings.

Thoracentesis was performed in every patient, and a pleural biopsy was performed if possible. PF, pleural tissue, and sputum specimens were subjected to routine biochemical, microbiological, and histological evalua- tion. Tuberculous pleurisy was diagnosed if any of the following criteria was met: 1) positive results for a TB culture, acid-fast bacilli or TB polymerase chain reaction from the respiratory specimens; 2) histological analysis of the pleural tissue showing granulomatous inflam-

mation with or without caseous necrosis or multi- nucleated giant cells; or 3) pleural effusion comprising lymphocyte-dominant exudates with adenosine deami- nase concentration >40 U/L and a positive treatment response to 6 months of antituberculous therapy and if no alternative diagnosis for the effusion other than TB was appropriate, according to a previous study 12 . We used the definition of an immunocompromised con- dition as provided by Lee et al. 13 . The tuberculin skin test was performed using the Mantoux test as described previously 14 . Patients younger than 18 years of age and whose cause of effusion was not identified were ex- cluded from the study.

We collected blood and PF on the same day and all patients except one did not take the antituberculous medication before sampling. We performed the two IGRAs, T-SPOT.TB test and QuantiFERON-TB Gold (QFT-G) test on blood samples following the manu- facturers' instructions. For the T-SPOT.TB assay in PF, we transferred PF to a Falcon tube; the tube was centri- fuged, and mononuclear cells (≥1×10 7 ) were sepa- rated within 2 hours after thoracentesis. To collect an adequate numbers of the cells, we used sufficient amounts, more than 50 mL of PF. The T-SPOT.TB assay was performed on 2.5×10 5 cells per well. The sub- sequent processes were the same as for the test using blood samples. For the QFT-G test, 1 mL of PF was collected in the tubes supplied containing the M. tuber- culosis -specific antigens ESAT-6 and CFP-10, nil control, or a mitogen control (phytohemagglutinin). The tubes were incubated within 5 hours of collection for 18 hours at 37 o C and then centrifuged. The supernatants were stored at −80 o C until the ELISA was performed.

We interpreted the results of the IGRAs on blood as recommended for each test. The results of the T- SPOT.TB test were considered indeterminate if the spot number of nil control was >10 13 . The results of the QFT-G assay were considered indeterminate if one of the following occurred: the nil value was >8 IU/mL;

when if the nil value was ≤8 IU/mL, the TB antigen minus the nil value was <0.35 or it was ≥0.35 and

<25% of the nil value, and the mitogen value minus

(3)

Table 1. Clinical characteristics of the patients

TB effusion (n=21) Non-TB effusion (n=15) p-value

Age, yr 39.9±16.0 63.3±17.5 <0.001

Gender (M:F) 15:6 6:9 0.061

Past TB history 1 2 0.373

Comorbidity* 0 1 (hemodialysis) 0.417

Albumin (serum) 3.5±0.2 3.6±0.5 0.915

Lymphocytes count in blood 1,259.6±712.4 1,772.7±651.0 0.034

Lymphocytes count in PF 1,273.6±1248.7 833.6±795.2 0.239

Cause of effusion TB Malignancy (n=7)

Microbiology (n=12) Pneumonia (n=3) Histology (n=6) Heart failure (n=3) Biochemistry (n=3) SVC syndrome (n=1)

NTM (n=1)

*Diseases requiring immunosuppressive drugs, undergoing hemodialysis, hematologic malignancy, diabetes mellitus, or HIV infection.

TB: tuberculosis; M: male; F: female; Blood: peripheral blood; PF: pleural fluid; SVC syndrome: superior vena cava syndrome; NTM:

nontuberculous mycobacterium; HIV: human immunodeficiency virus.

the nil value was <0.5 14 . To assess the diagnostic accu- racy, we plotted receiver operating characteristic (ROC) curves among the IGRAs. We recalculated new best cut-off values of the tests (T-SPOT.TB and QFT-G) by applying simplified diagnostic criteria which are the dif- ference in the counts of spot-forming cells and in the concentrations of IFN-γ between antigen stimulated samples and the negative control, respectively, without considering the indeterminate results.

1. Data analysis

The results for each group were compared using the Mann-Whitney U test in SPSS version 12.0 (SPSS Inc., Chicago, IL, USA). We constructed a ROC curve by plot- ting the rate of sensitivity against the rate of (1-specific- ity) results over a range of cutoff values of T-SPOT.TB and QFT-G test performed on blood and PF. A p-value of <0.05 was considered significant.

Results 1. Patient characteristics

Of the 36 patients with undetermined unilateral pleu- ral effusions, 21 were diagnosed as tuberculous pleur- isy. Their average age was 49.7 years (range, 19∼89 years). Age differed significantly between the tuber-

culous group and non-tuberculous group (Table 1). The patients were tested for human immunodeficiency virus (HIV) antibodies, and all were negative. In the tuber- culous group, no patient had any immunocompromising disease, and in the non-tuberculous group, one patient was undergoing hemodialysis. The Mantoux test results were available in 25 patients; 15 were in the tuber- culous group and five were positive. A pleural biopsy was performed in 25 of 36 patients, and 18 were in the tuberculous group. Tuberculous pleurisy was diagnosed by microbiological, histological, and biochemical/clini- cal criteria in 12 patients, six patients, and three pa- tients, respectively. The common causes of the non-tu- berculous pleurisy were malignancy (n=7), parapneu- monic effusion (n=3), and heart failure (n=3). The se- rum albumin level, a nutritional marker, and the lym- phocyte count in blood and PF did not differ between the tuberculous and nontuberculous groups.

2. Performance of the T-SPOT.TB and QFT-G assays in PF and peripheral blood

Compared to the nontuberculous group, the tuber-

culous group had significantly more spot-forming T cells

in both PF and blood. Within the tuberculous group,

there were more immunospots in the T-SPOT.TB assay

in PF than in blood (Figure 1). In the QFT-G test in

(4)

Table 2. Interpretation of two interferon-gamma release as- says in pleural fluid and in blood, between the tuberculous and nontuberculous effusion group

TB effusion

Non-TB effusion

T-SPOT.TB, B Positive 18 6

Negative 2 8

Indeterminate 1 1

T-SPOT.TB, PF Positive 15 8

Negative 0 3

Indeterminate 6 4

QFT-G, B Positive 10 5

Negative 5 5

Indeterminate 6 5

QFT-G, PF Positive 4 6

Negative 0 7

Indeterminate 17 2

TB: tuberculosis; B: peripheral blood; PF: pleural fluid; QFT-G:

QuantiFERON-TB Gold.

Figure 2. The concentrations of interferon-gamma (IFN- γ) using the QuantiFERON-TB Gold method in pleural fluid and in blood, between the pleural tuberculosis (plTB) and non-pleural TB (non-TB) groups. IFN-γ values have been subtracted from the corresponding background control values. For group comparison by Mann-Whitney test. NS: not significant. *p<0.05. p<0.01.

Figure 1. Comparison of the numbers of interferon-gam- ma producing spot-forming cells (SFCs) using the T- SPOT.TB method in pleural fluid and in blood, between the pleural tuberculosis (plTB) and non-pleural TB (non- TB) groups. All results have been calculated after sub- traction of SFC counts in the negative control wells. For group comparison by a Mann-Whitney test. NS: not signi- ficant. *p<0.005. p<0.001.

PF and blood, the IFN-γ response was significantly higher in the tuberculous patients than in the non-tuber- culous patients. However, within the tuberculous

group, the QFT-G assay detected no difference in the IFN-γ response between PF and blood (Figure 2).

The sensitivity and specificity in blood were 85.7%

and 53.3% for the T-SPOT.TB test and 47.6% and 33.3%

for the QFT-G test, respectively. Applying the manu- facturers' interpretation of results for blood to PF showed indeterminate results in 10 of 36 patients for the T-SPOT.TB test and in 19 of 36 patients for the QFT-G test, respectively (Table 2). The main cause of indeterrminate results in both IGRAs on PF was a high nil value in the tuberculous group.

3. Comparison of the diagnostic accuracy and deter- mination of the best cutoff value

To evaluate the relative discriminative accuracy of the T-SPOT.TB and QFT-G assay in PF and blood, we as- sessed the ROC curve of each test. The ROC curve was the greatest for the T-SPOT.

TB test in PF, followed by the T-SPOT.TB test in

blood, QFT-G test in blood, and QFT-G test in PF

(Figure 3). The respective area under the ROC curve

were 0.956, 0.890, 0.743, and 0.721 (Table 3). We

chose a cutoff value for each test that maximized the

specificity without a significant loss of sensitivity. For

(5)

Table 4. Application of best cutoff values in the T-SPOT.TB and QFT-G test and their diagnostic performance for the diagnosis of tuberculous pleurisy

Variable Cutoff value Sensitivity (%) Specificity (%) PPV NPV

T-SPOT.TB, B 21.500 81.0 86.7 89.5 76.5

T-SPOT.TB, PF 75.000 81.0 93.3 94.4 77.9

QFT-G, B 0.175 81.0 66.7 77.3 71.4

QFT-G, PF 2.745 57.1 93.3 92.3 60.9

QFT-G: QuantiFERON-TB Gold; PPV: positive predictive value; NPV: negative predictive value; B: peripheral blood; PF: pleural fluid.

Figure 3. Receiver operating characteristic curves be- tween T-SPOT.TB and QuantiFERON-TB Gold (QFT-G) test for the diagnosis of tuberculous pleurisy. ROC: re- ceiver operating characteristic; PF: pleural fluid; B: periph- eral blood.

Table 3. Comparison of diagnostic accuracy for the tuber- culous pleurisy by AUROC curves between T-SPOT.TB and QFT-G test

Variable AUROC curve (95% CI) SE

T-SPOT.TB, B 0.890 (0.781∼1.000) 0.056 T-SPOT.TB, PF 0.956 (0.884∼1.027) 0.037

QFT-G, B 0.743 (0.579∼0.907) 0.084

QFT-G, PF 0.721 (0.550∼0.892) 0.087

AUROC: area under the receiver operating characteristic; TB:

tuberculosis; CI: confidence interval; B: peripheral blood; PF:

pleural fluid; QFT-G: QuantiFERON-TB Gold.

the PF T-SPOT.TB test, a cutoff value of >75 spot counts improved the specificity (93.3%) with a minor decrease in sensitivity (90.5%), and showed a 94.4%

positive predictive value and 77.8% negative predictive value. For the PF QFT-G test, a cutoff of IFN-γ level

>2.745 IU/mL produced a sensitivity of 57.1%, specif- icity of 93.3%, positive predictive value of 92.3%, and negative predictive value of 60.9%. The best cutoff val- ues of the two IGRAs were higher in PF than in blood (Table 4).

Discussion

We prospectively investigated the clinical utility of the T-SPOT.TB and QFT-G tests performed on PF and

blood samples for diagnosing tuberculous pleurisy in a head-to-head comparison. In this study, the T-SPOT.TB assay using PF had the greatest diagnostic accuracy for differentiating tuberculous pleurisy in non-HIV patients in a country with an intermediate incidence of TB infection. The T-SPOT.TB test also produced fewer in- determinate results than the QFT-G test and showed a significant change in the number of IFN-γ spot-form- ing cells between PF and blood within the tuberculous pleurisy group.

Comparing the diagnostic performance of either IGRA

between PF and blood samples in the TB pleurisy, some

clinical studies showed inconsistent results, depending

on the type of assay, patient population, and incidence

of TB infection 12,15-20 . In countries with a low TB bur-

den, the IGRA has superior diagnostic accuracy in PF

than in blood, whereas the reverse is true in inter-

mediate-to high-burden countries 19,20 . In the current

study, we showed that the T-SPOT.TB test had a higher

diagnostic performance in PF, whereas the QFT-G test

had poorer efficacy in PF. However, few studies have

(6)

directly compared the performance of two IGRAs for ac- tive TB infection, especially for TB pleurisy. In 200 pa- tients with suspected TB, Lai et al. 21 reported that the T-SPOT.TB test had a higher sensitivity and produced fewer indeterminate results than the QFT-Gold in-tube (QFT-GIT) assay. To our knowledge, only one report, by Dheda et al. 22 , directly compared the T-SPOT.TB and QFT methods in PF for the diagnosis of the tuberculous pleurisy. Dheda et al. 22 also showed that the PF T-SPOT.TB test had a higher ROC than the PF QFT-GIT test, a finding that is similar to ours. Whereas Dheda et al. 22 included patients from a country with a high TB burden and half of whom were HIV positive, nearly all of our patients were immunecompetent patients and were studied in an intermediate TB burden setting. A recent meta-analysis 23 analyzed the diagnostic accuracy of IGRAs for diagnosing active TB and showed that the T-SPOT.TB test using extrasanguineous fluids is cur- rently the best immunodiagnostic method.

There are some reasons for the superiority of the T-SPOT.TB assay using PF among the IGRAs in our study. First, the T-SPOT.TB assay but not the QFT test requires a mandatory number of mononuclear cells, which might ensure a more accurate result even in pa- tients with low T cell titers, such as those with HIV in- fection or another immunodeficiency. Second, more ac- curate results may be obtained when performing the IGRA in PF, the active infection site of tuberculous pleurisy, because of the compartmentalization of the im- mune response of Th1 cells in TB infection 12,16-18,22

. Third, in our study, the QFT-G test had more in- determinate interpretations than the T-SPOT.TB test in both PF and blood, which might reduce its diagnostic accuracy.

The findings about inconclusive results of the two IGRAs in the present study are consistent with the meta-analysis by Sester et al. 23 , who demonstrated that indeterminate results are common in the QFT test and more frequent in PF than in blood (23.1% and 7%, re- spectively). By contrast, the T-SPOT.TB test showed a similar frequency of indeterminate results between PF and blood (5% and 3.4%, respectively). The causes of

indeterminate results in the ELISA method in our study were high nil value in the TB group and a weak re- sponse to the mitogen in the non-TB group. It is sup- posed that high IFN-γ response in the negative control could occur due to higher rate of inflammation, such as coexisting or transient infection 15,24 . In addition, the weak response to the positive control in the non- tuberculous group may reflect an unverified suppressed immune status. The nontuberculous group had older patients than the tuberculous group, and the older pa- tients might have lower immune responses. Further large-scale research is needed to solve problems, such as the considerable number of indeterminate results and to identify the best cut-off values, for applying IGRAs to PF for diagnosing TB pleurisy.

The current study has several limitations. First, the number of cases was small, and some cases of active TB were diagnosed based on clinical grounds rather than microbiological confirmation. However, restricting the analysis to culture-confirmed TB cases did not change the results. Second, we used QFT-G assay rather than the new QFT-GIT assay, which includes another TB-specific antigen, TB 7.7. Although the QFT-GIT test might be presumed to have superior diagnostic accuracy compared with the QFT-G test, a systemic review by Pai et al. 25 showed that the two QFT assays have similar sensitivity and specificity for the diagnosis of latent TB infection. In conclusion, the PF T-SPOT.TB test showed highest diagnostic accuracy among the IGRAs using blood and PF in the detection of tuberculous pleurisy in an intermediate-burden setting of TB infection. It sug- gests that T-SPOT.TB assay, especially applied directly to PF, may be an adjunctive, but useful method in the diagnosis of tuberculous pleurisy.

Acknowledgements

The statistical consultation was supported by Catholic

Research Coordinating Center of the Korea Health 21

R&D Project (A070001), Ministry of Health & Welfare,

Republic of Korea.

(7)

References

1. Korean Academy of Tuberculosis and Respiratory Disease. Guideline for diagnosis and management of tuberculosis. Seoul: Korean Academy of Tuberculosis and Respiratory Disease; 2005.

2. Seibert AF, Haynes J Jr, Middleton R, Bass JB Jr.

Tuberculous pleural effusion: twenty-year experience.

Chest 1991;99:883-6.

3. Gopi A, Madhavan SM, Sharma SK, Sahn SA. Diagnosis and treatment of tuberculous pleural effusion in 2006.

Chest 2007;131:880-9.

4. Valdés L, Alvarez D, San José E, Penela P, Valle JM, García-Pazos JM, et al. Tuberculous pleurisy: a study of 254 patients. Arch Intern Med 1998;158:2017-21.

5. Burgess LJ, Maritz FJ, Le Roux I, Taljaard JJ. Combined use of pleural adenosine deaminase with lympho- cyte/neutrophil ratio: increased specificity for the diag- nosis of tuberculous pleuritis. Chest 1996;109:414-9.

6. Lalvani A. Diagnosing tuberculosis infection in the 21st century: new tools to tackle an old enemy. Chest 2007;131:1898-906.

7. Pai M, Riley LW, Colford JM Jr. Interferon-gamma as- says in the immunodiagnosis of tuberculosis: a system- atic review. Lancet Infect Dis 2004;4:761-76.

8. Pai M, Zwerling A, Menzies D. Systematic review:

T-cell-based assays for the diagnosis of latent tuber- culosis infection: an update. Ann Intern Med 2008;149:

177-84.

9. Barnes PF, Mistry SD, Cooper CL, Pirmez C, Rea TH, Modlin RL. Compartmentalization of a CD4+ T lym- phocyte subpopulation in tuberculous pleuritis. J Im- munol 1989;142:1114-9.

10. Nemeth J, Winkler HM, Zwick RH, Rumetshofer R, Schenk P, Burghuber OC, et al. Recruitment of Mycobacterium tuberculosis specific CD4+ T cells to the site of infection for diagnosis of active tuberculosis.

J Intern Med 2009;265:163-8.

11. Jafari C, Ernst M, Kalsdorf B, Greinert U, Diel R, Kirsten D, et al. Rapid diagnosis of smear-negative tuberculosis by bronchoalveolar lavage enzyme-linked immuno- spot. Am J Respir Crit Care Med 2006;174:1048-54.

12. Ates G, Yildiz T, Ortakoylu MG, Ozekinci T, Erturk B, Akyildiz L, et al. Adapted T cell interferon-gamma re- lease assay for the diagnosis of pleural tuberculosis.

Respiration 2011;82:351-7.

13. Lee JY, Choi HJ, Park IN, Hong SB, Oh YM, Lim CM, et al. Comparison of two commercial interfer-

on-gamma assays for diagnosing Mycobacterium tuber- culosis infection. Eur Respir J 2006;28:24-30.

14. Kang YA, Lee HW, Yoon HI, Cho B, Han SK, Shim YS, et al. Discrepancy between the tuberculin skin test and the whole-blood interferon gamma assay for the diagnosis of latent tuberculosis infection in an inter- mediate tuberculosis-burden country. JAMA 2005;293:

2756-61.

15. Baba K, Sørnes S, Hoosen AA, Lekabe JM, Mpe MJ, Langeland N, et al. Evaluation of immune responses in HIV infected patients with pleural tuberculosis by the QuantiFERON TB-Gold interferon-gamma assay.

BMC Infect Dis 2008;8:35.

16. Losi M, Bossink A, Codecasa L, Jafari C, Ernst M, Thijsen S, et al. Use of a T-cell interferon-gamma re- lease assay for the diagnosis of tuberculous pleurisy.

Eur Respir J 2007;30:1173-9.

17. Chegou NN, Walzl G, Bolliger CT, Diacon AH, van den Heuvel MM. Evaluation of adapted whole-blood inter- feron-gamma release assays for the diagnosis of pleural tuberculosis. Respiration 2008;76:131-8.

18. Lee LN, Chou CH, Wang JY, Hsu HL, Tsai TH, Jan IS, et al. Enzyme-linked immunospot assay for interfer- on-gamma in the diagnosis of tuberculous pleurisy.

Clin Microbiol Infect 2009;15:173-9.

19. Joshi R, Pai M. Can pleural tuberculosis be diagnosed using interferon-gamma release assays? Respiration 2008;76:128-30.

20. Hooper CE, Lee YC, Maskell NA. Interferon-gamma re- lease assays for the diagnosis of TB pleural effusions:

hype or real hope? Curr Opin Pulm Med 2009;15:358- 65.

21. Lai CC, Tan CK, Lin SH, Liao CH, Huang YT, Hsueh PR. Diagnostic performance of whole-blood interfer- on-gamma assay and enzyme-linked immunospot as- say for active tuberculosis'. Diagn Microbiol Infect Dis 2011;71:139-43.

22. Dheda K, van Zyl-Smit RN, Sechi LA, Badri M, Meldau R, Meldau S, et al. Utility of quantitative T-cell re- sponses versus unstimulated interferon-{gamma} for the diagnosis of pleural tuberculosis. Eur Respir J 2009;34:

1118-26.

23. Sester M, Sotgiu G, Lange C, Giehl C, Girardi E, Migliori GB, et al. Interferon-gamma release assays for the di- agnosis of active tuberculosis: a systematic review and meta-analysis. Eur Respir J 2011;37:100-11.

24. Trajman A, Pai M, Dheda K, van Zyl Smit R, Zwerling

AA, Joshi R, et al. Novel tests for diagnosing tuber-

(8)

culous pleural effusion: what works and what does not? Eur Respir J 2008;31:1098-106.

25. Pai M, Zwerling A, Menzies D. Systematic review:

T-cell-based assays for the diagnosis of latent tuber- culosis infection: an update. Ann Intern Med 2008;149:

177-84.

수치

Table  1.  Clinical  characteristics  of  the  patients
Figure  2.  The  concentrations  of  interferon-gamma  (IFN- (IFN-γ)  using  the  QuantiFERON-TB  Gold  method  in  pleural  fluid and in blood, between the pleural tuberculosis (plTB) and non-pleural TB (non-TB) groups
Table 3. Comparison of diagnostic accuracy for the tuber- tuber-culous  pleurisy  by  AUROC  curves  between  T-SPOT.TB  and  QFT-G  test

참조

관련 문서

Values of Glucose, T-protein, T-cholesterol and Triglyceride of Blistered fluid caused by Buhang blistering --- 19..

To assess the clinical usefulness of performing Q-PCR in practice as a diagnostic technique, we compared blindly the Q-PCR results using blood samples of the

• Diffusion Equation for fluid flow in porous media... Fluid flow

Based on the experiment results using the PIV technique, this study analyzed the pressure field including both the inside fluid flow of the sloshing tank and the surrounding

Ejectors is a fluid transportation device for which a principle is used that high-pressure fluid are spouted through driving pipe and the pressure

A jet pump is a fluid carrying device which spouts fluid of high pressure from a driving engine pipe and absorbs fluid of high pressure whose pressure

Utility of T1-and T2-weighted high-resolution vessel wall imaging for the diagnosis and follow up of isolated posterior inferior cerebellar artery dissection with

n The magnitude of the buoyant force acting on a floating body in the fluid is equal to the weight of the fluid which is displaced by