Copyright © 2016 The Korean Society for Bone and Mineral Research
This is an Open Access article distributed under the terms of the Creative Commons Attribution Non-Commercial Li- cense (http://creativecommons.org/licenses/by-nc/4.0/) which permits unrestricted non-commercial use, distribu- tion, and reproduction in any medium, provided the original work is properly cited.
Comparison in Adherence to Osteoporosis Guidelines according to Bone Health Status in Korean Adult
Hee-Sook Lim1,2, Soon-Kyung Kim3, Hae-Hyeog Lee4, Dong Won Byun5, Yoon-Hyung Park1,*, Tae-Hee Kim4,*
1Department of Preventive Medicine, Soonchunhyang University College of Medicine, Cheonan;
2Department of Clinical Nutrition, Soonchunhyang University Bucheon Hospital, Bucheon;
3Department of Food Sciences & Nutrition, Soonchunhyang University, Asan;
4Department of Obstetrics and Gynecology, Soonchunhyang University College of Medicine, Bucheon;
5Division of Endocrinology and Metabolism, Department of Internal Medicine, Soonchunhyang University Seoul Hospital, Seoul, Korea
Background: Osteoporosis one of the most serious disease to decrease the quality of life and cause economic loss. Thus, prevention of osteoporosis has become an important health concern. The study examined in adherence to osteoporosis guidelines and com- pared the levels of adherence to osteoporosis guidelines between bone health status in Korean adult. Methods: This study used data from a nationally represented sample of Koreans (n=3,419) from 2008 to 2011 Korea National Health and Nutrition Examination Survey. We were divided into three groups by T-score: normal, osteopenia and osteopo- rosis. Assessment of adherence level was based on 5 components of osteoporosis guide- lines, considering intake of sodium, calcium and protein, smoking and regular exercise.
Results: The sex, body mass index, income and educational level did not significantly differ between three groups. Deficient intake of calcium was significantly associated with a threefold greater odds in osteoporosis group (OR 3.6; 95% confidence interval [CI]
2.52-5.22). Excessive protein intake was significantly increased the risk only in osteopo- rosis group compared to the normal group (OR 1.71; 95% CI 1.15-2.62). Smoking in- creased the risk in osteoporosis group compared to the normal group (OR 2.88; 95% CI 1.75-4.76), osteoporosis group compared to the osteopenia group (OR 2.69; 95% CI 1.61- 4.55). Conclusions: Nutritional factor (intake of calcium and protein) and lifestyle-related factor (smoking and exercise) must be accompanied the management for bone health.
An adherence of guidelines is considered very important for the prevention of osteopo- rosis.
Key Words: Bone, Diet, Guideline adherence, Life style, Osteoporosis
INTRODUCTION
The World Health Organization (WHO) defines osteoporosis as a disease of the skeletal system characterized by abnormalities in the amount and architectural arrangement of bone tissue, resulting in an undue susceptibility to fractures, and the National Institute of Health (NIH) defines osteoporosis as a disease of the skel- etal system in which the bones become weak and are more likely to break.[1] Based on the Korean National Health and Nutrition Examination Survey (KNHANES) in Corresponding author
Yoon-Hyung Park
Department of Preventive Medicine, Soonchunhyang University College of Medicine, 31 Suncheonhyang 6-gil, Dongnam-gu, Cheonan 31151, Korea Tel: +82-41-570-2483, Fax: +82-41-575-2406 E-mail: [email protected]
* Yoon-Hyung Park and Tae-Hee Kim contributed equally to this work and should be considered co-corresponding authors.
Received: May 4, 2016 Revised: June 24, 2016 Accepted: July 1 2016
No potential conflict of interest relevant to this article was reported.
This work was supported by the Soonchunhyang University Research Fund.
2012, the prevalence of osteoporosis was 34.9% and 7.8%
for females and males older than 50 years, which was thrice higher than the prevalence of osteoporosis in the United States as reported by the American National Health and Nutrition Examination Survey in 2013.[2]
Approximately 2.2 trillion dollars is spent each year on osteoporosis and related fractures in Korea, which is close to twice the amount spent on diabetes (Korea Centers for Disease Control and Prevention, 2011).[3] The recognition rate of osteoporosis is 24.7%, which means 3 of 4 patients with osteoporosis do not know they have osteoporosis.
Only 10.8% of patients with osteoporosis, approximately 1 of 10, undergo treatment.[4] Therefore, promoting and regulating bone health are important among the general population.
The risk factors for osteoporosis include genetics, hor- mone,[5] exercise,[6] physical activity,[7] and nutrition.[8]
Risk factors such as smoking, excessive alcohol consump- tion,[9] calcium deficiency, and vitamin D deficiency [10]
can be corrected, and balanced nutrition influences bone mass and bone quality as well as fracture occurrence and treatment.[11] International researches reported that ex- cessive sodium intake increases calcium excretion in the urine, which in turn decreases bone density.[12] Low calci- um intake can increase osteoporosis risk,[13] and smoking is a relevant risk factor for osteoporosis.[14] Exercise and physical activities can affect bone density. Weight-bearing activities increase bone density, bone strength, and bal- ance.[15]
Based on the information above, the Korean Society for Bone and Mineral Research provided recommended doses of drugs, meals, and other nutrients to prevent osteoporo- sis.[1] However, researches that support the recommended values are scarce. The present study’s goal is to investigate the effects of correctable factors, such as life habits and nutrition by using the KNHANES. We were conducted to provide a basis for the national health guideline.
METHODS
1. SubjectThis study was conducted by using the 2008 to 2011 KNHANES as raw data. Among the 37,753 initial subjects, subjects younger than 18 years (n=13,500), subjects who were pregnant or lactating, postmenopausal women, sub-
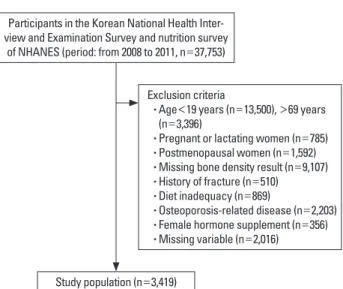
jects older than 70 years (n=3,396), subjects without or missing bone density measurements (n=9,107), subjects with a history of fracture (n=510), subjects with low-calor- ic (less than 800 kcal) or high-caloric intake (more than 4000 kcal) (n=869), subjects with osteoporosis-associated diseases (diabetes, hyperthyroidism, renal failure, cirrhosis, rheumatism, and cancer) (n=2,203), subjects taking fe- male hormone supplements (n=356), and subjects with missing variables (n=2,016) were excluded. The final anal- ysis used the data from 3,419 subjects who were divided into the following three groups: normal (n=2,956), osteo- penia (n=375), and osteoporosis groups (n=88) (Fig. 1).
2. Description of the parameter
The detailed variables used in the study were selected by using the KNHANES Guide from the examination and nutrition categories. The mean age, sex (male and female), body mass index, household income (low, middle-low, middle-high, and high), and educational level (below mid- dle school graduate, high school graduate, above college graduate) were the demographic factors used to group the subjects.
Nutritional variables used in this study were appropriate intake of sodium, calcium, and protein. WHO recommends daily sodium intake less than 2 g, whereas the Korean Nu- trition Society recommends daily and goal intake of 1.2 g and less than 2 g, respectively.[16] Therefore, this study used 2 g as reference to differentiate sufficient intake (less than 2 g per day) and excessive intake (more than 2 g per
Participants in the Korean National Health Inter- view and Examination Survey and nutrition survey
of NHANES (period: from 2008 to 2011, n=37,753)
Exclusion criteria
• Age<19 years (n=13,500), >69 years (n=3,396)
• Pregnant or lactating women (n=785) • Postmenopausal women (n=1,592) • Missing bone density result (n=9,107) • History of fracture (n=510) • Diet inadequacy (n=869)
• Osteoporosis-related disease (n=2,203) • Female hormone supplement (n=356) • Missing variable (n=2,016) Study population (n=3,419)
Fig. 1. Overview of the study population.
day). The evaluation of calcium intake was divided into suf- ficient and excessive intake by calculating the recommend- ed intake to individual intake. The recommended intake for protein varies depending on age based on the Korean Nutrition Society. For example, adult men and women in their 30s are advised to consume 60 g/day and 50 g/day protein, respectively. These values were obtained by calcu- lating the amount of protein that would satisfy the protein intake requirements of 97% to 98% of the sample popula- tion by using results from researches on nitrogen balance and protein digestion.[16] However, protein intake of Ko- reans are still excessive. Therefore, 0.8 g of protein intake per weight was used as reference to differentiate sufficient and excessive protein intake in this study.
Smoking and exercise were investigated as lifestyle-re- lated variables. Subjects who currently smoking or previ- ously smoking and those who have never smoking were included in the smoker and non-smoker groups, respec- tively. Subjects who intensive or moderate exercise more than thrice a week and those who intensive or moderate exercise less than thrice a week were included in the exer- cise and no-exercise groups, respectively.
3. Statistical analysis
All statistical analyses were performed using R 3.1.3 ver-
sion freely available on the web (http://cran.r-project.org/) and SPSS (version 18.0; SPSS Inc., Chicago, IL, USA). Data were reported as mean±standard deviation (SD) or as numbers and percentages. The Chi-squared test and Krus- kal-Wallis test was used to check if there are significant dif- ferences among the three groups. One-way analysis of variance (ANOVA) was conducted for bone status and vari- ous characteristics, respectively. If there seemed to be a significant differences, post hoc comparison was applied by Bonferroni's method. Odds ratio (ORs) were derived us- ing multinomial logistic regression to estimate the associa- tion between bone health status and various factors. Ad- justed ORs were derived after adjustment for the covariates.
All results were considered statistically significant when P<0.05.
RESULTS
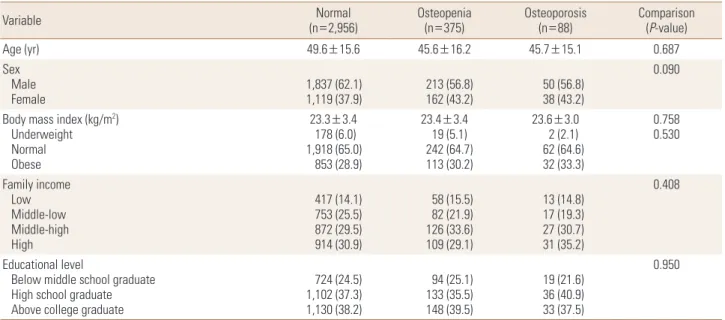
1. Demographic factors of the participants The proportion of the osteopenia and osteoporosis groups was 12.7% and 3.0%, respectively. The average age was 49.6 years, and the sex ratio showed that males were more than females. The proportion of overweight subjects in- creased with decreasing bone density, but the three groups showed no significant differences. Income level was similar
Table 1. Demographic and socioeconomic factors
Variable Normal
(n=2,956) Osteopenia
(n=375) Osteoporosis
(n=88) Comparison
(P-value)
Age (yr) 49.6±15.6 45.6±16.2 45.7±15.1 0.687
Sex Male
Female 1,837 (62.1)
1,119 (37.9) 213 (56.8)
162 (43.2) 50 (56.8)
38 (43.2)
0.090
Body mass index (kg/m2) Underweight Normal Obese
23.3±3.4 178 (6.0) 1,918 (65.0)
853 (28.9)
23.4±3.4 19 (5.1) 242 (64.7) 113 (30.2)
23.6±3.0 2 (2.1) 62 (64.6) 32 (33.3)
0.758 0.530
Family income Low Middle-low Middle-high High
417 (14.1) 753 (25.5) 872 (29.5) 914 (30.9)
58 (15.5) 82 (21.9) 126 (33.6) 109 (29.1)
13 (14.8) 17 (19.3) 27 (30.7) 31 (35.2)
0.408
Educational level
Below middle school graduate High school graduate Above college graduate
724 (24.5) 1,102 (37.3) 1,130 (38.2)
94 (25.1) 133 (35.5) 148 (39.5)
19 (21.6) 36 (40.9) 33 (37.5)
0.950
Data was presented as mean±standard deviation for age and frequency (percentage, %) for the others.
P-values were obtained from Kruskal-Wallis test for age and chi-square test for the others.
Bonferroni's post hoc comparison: i-j means that there exists the significant difference between the i-th group and the j-th group. (i, j=1,2,3; group 1=
normal; group 2=osteopenia; group 3=osteoporosis).
in the three groups, which did not show any significant dif- ference, and the educational level was also similar in the three groups for lower than middle school, high school grad- uate, and college graduate. Educational level showed no significant difference between three groups (Table 1).
2. Nutritional and lifestyle-related factors of the participants
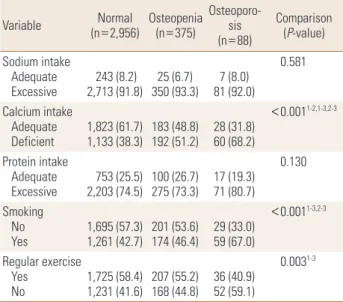
The sodium intake levels revealed that the proportion of subjects who consume excessive sodium were approximate- ly 90% in all three groups. Calcium intake was deficient in 38.3% of the subjects in the normal group, whereas 51.2%
and 68.2% of the subjects were calcium deficient in the os- teopenia and osteoporosis groups, respectively. Adequate calcium intake showed significant differences in the three groups. The proportion of subjects who consume exces- sive protein was high in the osteoporosis group, but no significant difference was found between the three groups.
The proportion of smoking was significantly higher in the osteoporosis group compared with the normal and osteo- penia groups. The proportion of subjects who do not exer- cise was significantly higher in the osteoporosis group than in the normal group (Table 2).
3. Logistic regression analysis for bone health status
The factors showing the significant difference between three groups were analyzed by univariate logistic regres- sion analysis for bone health status. Deficient intake of cal- cium was significantly associated with a threefold greater odds in osteoporosis group (OR 3.6; 95% confidence inter- val [CI] 2.52-5.22). OR was significantly increased in the os- Table 2. Nutritional and lifestyle-related factor
Variable Normal
(n=2,956) Osteopenia (n=375)
Osteoporo- (n=88)sis
Comparison (P-value) Sodium intake
Adequate
Excessive 243 (8.2)
2,713 (91.8) 25 (6.7)
350 (93.3) 7 (8.0) 81 (92.0)
0.581
Calcium intake Adequate
Deficient 1,823 (61.7)
1,133 (38.3) 183 (48.8)
192 (51.2) 28 (31.8) 60 (68.2)
<0.0011-2,1-3,2-3
Protein intake Adequate
Excessive 753 (25.5)
2,203 (74.5) 100 (26.7)
275 (73.3) 17 (19.3) 71 (80.7)
0.130
Smoking No
Yes 1,695 (57.3)
1,261 (42.7) 201 (53.6)
174 (46.4) 29 (33.0) 59 (67.0)
<0.0011-3,2-3
Regular exercise Yes
No 1,725 (58.4)
1,231 (41.6) 207 (55.2)
168 (44.8) 36 (40.9) 52 (59.1)
0.0031-3
Data was presented as mean±standard deviation for age and frequency (percentage, %) for the others.
P-values were obtained from Kruskal-wallis test for age and chi-square test for the others. Bonferroni’s post hoc comparison: i-j means that there exists the significant difference between the i-th group and the j-th group.
(i, j=1,2,3; group 1=normal; group 2=osteopenia; group 3=osteoporosis).
NA, natrium; Ca, calcium.
Table 3. Logistic regression anlaysis for bone health status
Variable Osteopenia vs. Normal Osteoporosis vs. Normal Osteoporosis vs. Osteopenia
OR 95% CI P-value OR 95% CI P-value OR 95% CI P-value
Nutritional factor Sodium intake
Adequate Ref (1.00) Ref (1.00) Ref (1.00)
Excessive 1.07 (0.85-1.35) 0.583 1.33 (0.77-2.51) 0.336 1.26 (0.7-2.45) 0.469
Calcium intake
Adequate Ref (1.00) Ref (1.00) Ref (1.00)
Deficient 1.58 (1.33-1.88) <0.001 3.6 (2.52-5.22) <0.001 2.29 (1.55-3.43) <0.001
Protein intake
Adequate Ref (1.00) Ref (1.00) Ref (1.00)
Excessive 1.1 (0.9-1.36) 0.348 1.71 (1.15-2.62) 0.035 1.64 (1-2.81) 0.058
Lifestyle-related factor Smoking
No Ref (1.00) Ref (1.00) Ref (1.00)
Yes 0.99 (0.82-1.21) 0.949 2.88 (1.75-4.76) <0.001 2.69 (1.61-4.55) <0.001
Regular exercise
Yes Ref (1.00) Ref (1.00) Ref (1.00)
No 1.11 (0.97-1.29) 0.139 1.7 (1.19-2.43) 0.004 1.52 (1.04-2.23) 0.029
ORs were derived after adjustment for age and sex.
NA, natrium; Ca, calcium; OR, odds ratio; CI, confidence interval.
teopenia group compared to the normal group (OR 1.58;
95% CI 1.33-1.88). Excessive protein intake was significant- ly increased the risk only in osteoporosis group compared to the normal group (OR 1.71; 95% CI 1.15-2.62). When com- pared to “not smoking”, smoking increased the risk in os- teoporosis group compared to the normal group (OR 2.88;
95% CI 1.75-4.76), osteoporosis group compared to the os- teopenia group (OR 2.69; 95% CI 1.61-4.55).When exercise was not performed, the risk increased in the osteoporosis group compared to the normal group (OR 1.70; 95% CI 1.19- 2.43) (Table 3).
DISCUSSION
Several factors are known to affect bone formation or maintenance such as calcium, vitamin D, protein and other nutrients, physical activity, or disease. This study investi- gated the variables that affect bone density by using the factors provided by the KNHANES. The subjects were di- vided into three groups and compared. The social and eco- nomic factors were not significantly different between three groups. This study showed different results from pre- vious studies, which identified sex and obesity as risk fac- tors for osteoporosis. Nutritional and lifestyle-related fac- tors showed that calcium deficiency, smoking, and lack of exercise were significantly different between the three groups, and regression analysis identified calcium as a strong factor closely related to the relative risk in all three groups. Based on the KNHANES in 2013, the average calci- um intake of the Korean population was 70% of the rec- ommended value.[17] Blood calcium levels are regulated by hormones. Continuous calcium deficiency depletes cal- cium within the bones, which is used for maintaining blood calcium levels, which increases the risk of osteoporosis.
The study of Meleleo and Picciarelli [18] reported that cal- cium intake of more than 1,200 mg/day by incorporating dairy products in the diet of postmenopausal women for 1 year showed positive effects on bone density. Although many nutrients, such as vitamin D, magnesium, phospho- rus, and vitamin K are necessary in bone formation, the guideline recommends a diet that lowers calcium excre- tion and improves absorption along with sufficient calcium intake. This study showed that calcium deficiency was prev- alent in subjects with low bone mineral density. Calcium intake is crucial, and overall balanced nutrition is required
to prevent and treat osteoporosis.
This study has several limitations. The number of sub- jects in each group are very different. In addition, the cau- sality was difficult to be defined through the cross-section- al data. There may be recall bias. The use drugs, supple- ments of other nutrient and other were not considered.
But importance of this study lies on the observation of cor- relation between the factors affecting bone density de- fined in the osteoporosis prevention and treatment guide- line.
Recognition of an individual’s self-condition and lifestyle- related management should be promoted and regulated to maintain bone health in the Korean population.
ACKNOWLEDGMENT
The authors wish to thank Eun-Ae Jung librarian and Bora Lee biostatistician who assisted in manuscript editing and statistical advice.
REFERENCES
1. Korean Society for Bone and Mineral Research. Physician’s guide for diagnosis & treatment of osteoporosis. 2015 [cit- ed by. Available from: http://www.ksbmr.org/image/jour- nal/골다공증%20지침서2015_final_1002.pdf
2. NIH Consensus Development Panel on Osteoporosis Pre- vention, Diagnosis, and Therapy. NIH consensus develop- ment panel on osteoporosis prevention, diagnosis, and therapy, March 7-29, 2000: highlights of the conference.
South Med J 2001;94:569-73.
3. Paek KS. Lifestyles and factors influencing the bone min- eral density (BMD) among employees in a community. J Korean Acad Community Health Nurs 2013;24:236-44.
4. Kim Y, Kim JH, Cho DS. Gender difference in osteoporosis prevalence, awareness and treatment: based on the Korea national health and nutrition examination survey 2008- 2011. J Korean Acad Nurs 2015;45:293-305.
5. Khadilkar AV, Mandlik RM. Epidemiology and treatment of osteoporosis in women: an Indian perspective. Int J Wom- ens Health 2015;7:841-50.
6. Wei X, Xu A, Yin Y, et al. The potential effect of Wuqinxi ex- ercise for primary osteoporosis: a systematic review and meta-analysis. Maturitas 2015;82:346-54.
7. Lupsa BC, Insogna K. Bone health and osteoporosis. Endo-
crinol Metab Clin North Am 2015;44:517-30.
8. Lim YS, Lee SW, Tserendejid Z, et al. Prevalence of osteo- porosis according to nutrient and food group intake levels in Korean postmenopausal women: using the 2010 Korea National Health and Nutrition Examination Survey Data.
Nutr Res Pract 2015;9:539-46.
9. Yamauchi M. On "2015 guidelines for prevention and treat- ment of osteoporosis". Osteoporosis associated with life- style-related diseases: other lifestyle-related diseases. Clin Calcium 2015;25:1339-46.
10. Weaver CM, Alexander DD, Boushey CJ, et al. Calcium plus vitamin D supplementation and risk of fractures: an up- dated meta-analysis from the National Osteoporosis Foun- dation. Osteoporos Int 2016;27:367-76.
11. Kim KM, Choi HS, Choi MJ, et al. Calcium and vitamin D supplementations: 2015 position statement of the Korean Society for Bone and Mineral Research. J Bone Metab 2015;
22:143-9.
12. Cohen AJ, Roe FJ. Review of risk factors for osteoporosis with particular reference to a possible aetiological role of dietary salt. Food Chem Toxicol 2000;38:237-53.
13. Manios Y, Moschonis G, Trovas G, et al. Changes in biochem-
ical indexes of bone metabolism and bone mineral densi- ty after a 12-mo dietary intervention program: the Post- menopausal Health Study. Am J Clin Nutr 2007;86:781-9.
14. Jørgensen L, Joakimsen R, Ahmed L, et al. Smoking is a strong risk factor for non-vertebral fractures in women with diabetes: the Tromso Study. Osteoporos Int 2011;22:
1247-53.
15. Korpelainen R, Korpelainen J, Heikkinen J, et al. Lifestyle factors are associated with osteoporosis in lean women but not in normal and overweight women: a population- based cohort study of 1222 women. Osteoporos Int 2003;
14:34-43.
16. Ministry of Health and Welfare, The Korean Nutrition Soci- ety. Dietary reference intakes for Koreans 2015. Sejong:
Ministry of Health and Welfare; 2015.
17. Lim HS, Park YH, Lee HH, et al. Comparison of calcium in- take status by region and socioeconomic status in Korea:
The 2011-2013 Korea National Health and Nutrition Ex- amination Survey. J Bone Metab 2015;22:119-26.
18. Meleleo D, Picciarelli V. Effect of calcium ions on human calcitonin. Possible implications for bone resorption by osteoclasts. Biometals 2016;29:61-79.