INTRODUCTION
Moderate alcohol consumption may reduce the risk of heart attack, ischemic stroke, peripheral vascular disease, sudden cardiac death, and death from all cardiovascular diseases (1, 2). However, high alcohol consumption causes various neg- ative health consequences, especially cancer and diseases of the heart, liver, and pancreas (3, 4). The annual costs associ- ated with the consumption of alcohol in Korea were estimat- ed to be 2.86% of the GDP in 2000; this included medical costs for the treatment of alcohol-related diseases, indirect costs (loss of productivity and decreases in the available work- force resulting from premature death), and other costs (loss of property, costs for administration, and costs for the con- sumption of alcoholic beverages) (5).
CAGE is an acronym for the following four questions that cover experiences associated with drinking alcohol: 1) ‘‘Have you ever felt you should CUT down on your drinking?’’ 2)
‘‘Have people ANNOYED you by criticizing your drinking?’’
3) ‘‘Have you ever felt bad or GUILTY about your drinking?’’
4) ‘‘Have you ever had a drink first thing in the morning to steady your nerves or get rid of a hangover (EYE-opener)?’’
Two or more affirmative answers to these questions is usually taken as an indication of an alcohol-related problem (6). The CAGE questionnaire has been used to screen for alcohol depen- dence in clinical settings as well as to estimate the prevalence of problem drinkers in the general population (7-9).
A nationwide knowledge of alcohol consumption and drink- ing problems can provide a foundation for planning and im- plementing national intervention programs; however, the consumption of alcohol and alcohol-related problems in Kore- an adults have not been extensively studied despite the asso- ciated social, economic, and public health burdens. There- fore, this study evaluated daily alcohol consumption and alcohol-related problems through the CAGE questionnaire in Korean adults.
MATERIALS AND METHODS Study population
The study subjects were recruited from the participants of the second Korea National Health and Nutrition Examina-
199
Jong-Tae Park, Byoung-Gwon Kim, and Hyung-Joon Jhun
Department of Occupational and Environmental Medicine, College of Medicine, Korea University, Ansan, Korea
Address for correspondence Hyung-Joon Jhun, M.D.
Department of Occupational and Environmental Medicine, College of Medicine, Korea University, 516 Gojan-dong, Danwon-gu, Ansan 425-707, Korea Tel : +82.31-412-6580, Fax : +82.31-412-5394 E-mail : [email protected]
DOI: 10.3346/jkms.2008.23.2.199
Alcohol Consumption and the CAGE Questionnaire in Korean Adults:
Results from the Second Korea National Health and Nutrition Examination Survey
We evaluated alcohol consumption and alcohol-related problems in Korean adults by evaluating alcohol consumption and responses to the CAGE questionnaire obtain- ed from the second Korea National Health and Nutrition Examination Survey. The age-adjusted prevalence of males who consumed 0, 0.1-20, 20.1-40, or >40 g/day of alcohol were 28.0, 51.5, 12.5, and 8.0%, respectively; 26.9% of male drinkers were CAGE-positive (≥≥2 affirmative responses to the CAGE). The age-adjusted prevalence of females who consumed 0, 0.1-10, 10.1-20, or >20 g/day of alcohol were 67.7, 26.6, 3.9, and 1.8%; 11.9% of female drinkers were CAGE-positive. The risk factors for high alcohol consumption were old age, low education level, smok- ing, and drinking onset at young ages in male drinkers, whereas low education level and smoking in female drinkers. The risk factors for a positive CAGE were young age, marriage, low education level, smoking, high amount of alcohol consumed on a single occasion, and high drinking frequency in male drinkers, whereas high house- hold income, ex-smoking, high amount of alcohol consumed on a single occasion, and high drinking frequency in female drinkers. Our results suggest that high alco- hol consumption and alcohol-related problems in Korean adults are not negligible and require intervention.
Key Words : Drinking; Alcohol-Related Disorders
Received : 16 March 2007 Accepted : 21 July 2007
ond K-NHANES, a self-administered questionnaire inves- tigating health behaviors (i.e., smoking, drinking, exercise, etc.) was distributed to 10,368 randomly sampled Koreans aged 12 yr or more, and 9,170 questionnaires were collect- ed (response rate=88.4%) (10). We excluded subjects who were younger than 20 yr old (n=1,246) and adults who did not report their drinking pattern (n=3) or reported it incom- pletely (n=45). Consequently, 7,876 adults (aged ≥20), con- sisting of 3,578 men and 4,298 women, were included in the analysis of alcohol consumption.
The CAGE questionnaire was administered to current drinkers. Of the 7,876 adult respondents, 3,689 persons (2,467 men and 1,222 women) reported that they were cur- rent drinkers. We excluded 43 drinkers who did not respond or incompletely responded to the CAGE questionnaire. Con- sequently, 3,646 current drinkers, consisting of 2,449 men and 1,197 women, remained for the analysis of alcohol-relat- ed problems.
Data collection
Self-reported demographic (age, gender, residential area, and marital status), socioeconomic (education level and house- hold income), lifestyle (smoking and physical exercise), and alcohol-related (age at drinking onset, drinking frequency, and average amount of alcohol consumed on a single occa- sion) data were drawn from the second K-NHANES. Resi- dential areas were classified as a large city, medium-sized city, or rural area. A large city in this study referred to Seoul (the capital of the Republic of Korea) and six other metropoli- tan cities (Busan, Daegu, Incheon, Gwangju, Daejon, and Ulsan) in Korea. A medium-sized city indicated cities other than Seoul and these six metropolitan cities. A rural area indicated administrative divisions other than the large and medium-sized cities. For smoking status, subjects were clas- sified as nonsmokers, ex-smokers, or current smokers. Phys- ical exercise was categorized into three groups: none, 1-3 session (s)/week, or ≥4 sessions/week.
The subjects were asked to quantify their drinking fre- quency (≤1/month, 2-3/month, 1-2/week, 3-4/week, and almost every day) and estimate the average amount of alco- hol consumed on a single occasion. Soju is the most widely consumed alcoholic beverage in Korea. The alcoholic con- tent in soju was 25% at the time of the second K-NHANES.
The respondents converted the average amount into the cor- responding equivalents of soju expressed in the traditional unit of jan (1 jan of soju=50 mL, containing 10 g of ethanol).
The questionnaire listed the volume of alcoholic beverages that contained the same quantity of ethanol as 1 jan of soju, and the subjects referred to this chart when recording the average amount consumed on a single occasion. The average daily consumption of alcohol for each subject was calculated in jan units by multiplying the average amount consumed
daily consumption was then converted into the amount of ethanol in grams by multiplying the figure by 10.
Definition of categories of daily alcohol consumption and alcohol-related problems
The U.S. Department of Health and Human Services (HHS) and U.S. Department of Agriculture (USDA) define moder- ate drinking as no more than one drink a day for women and two drinks per day for men (11). The definition of a standard drink can vary significantly from country to country and is 8 g of ethanol in the United Kingdom, 10 g in Australia, and 13.5 g in Canada (12). A standard drink in this study was defined as 10 g of ethanol because 1 jan of soju contained 10 g of ethanol at the time of the second K-NHANES. There- fore, moderate drinking was defined as consuming 10 g or less of ethanol per day on average for women and 20 g or less of ethanol per day on average for men. Consuming more than these values was defined as excessive drinking and consum- ing more than twofold of these values was defined as heavy drinking. Consequently, daily alcohol consumption in respon- dents was categorized into four groups by each gender: 0, 0.1-20, 20.1-40, and >40 g/day for men; 0, 0.1-10, 10.1- 20, and >20 g/day for women.
The presence of alcohol-related problems in current drinkers was categorized as either negative or positive (0-1 vs. 2+) according to the commonly recommended cutoff value for the number of affirmative response (s) to the CAGE.
Statistical analysis
The age-adjusted prevalence of the categories of daily alco- hol consumption in Korean adults and positive result to the CAGE in Korean adult drinkers were calculated by direct standardization using the entire Korean population in 2001 as the standard population.
The gender-specific associations of demographic, socioe- conomic, lifestyle, and alcohol-related factors with the cate- gories of daily alcohol consumption and positive result to the CAGE in Korean adult drinkers were evaluated. These associations were presented as mutually adjusted odds ratios (OR) derived from multiple logistic regression models for men and women. Proportional ORs were calculated for the categories of daily alcohol consumption because the depen- dent variable had three categories (excessive and heavy vs.
moderate drinking). In these models, the drinking frequen- cy and average amount of alcohol consumed on a single occa- sion were excluded from the explanatory variables because the dependent variable was derived from a linear combina- tion of these two variables. The PROC LOGISTIC procedure in the SAS statistical package was used for multiple logistic regression. A score test for the proportional odds assumption and the Hosmer and Lemeshow chi-square test, which was
implemented in the PROC LOGISTIC procedure as the LACKFIT option, were used to test the goodness-of-fit of the multiple logistic regression (13).
RESULTS
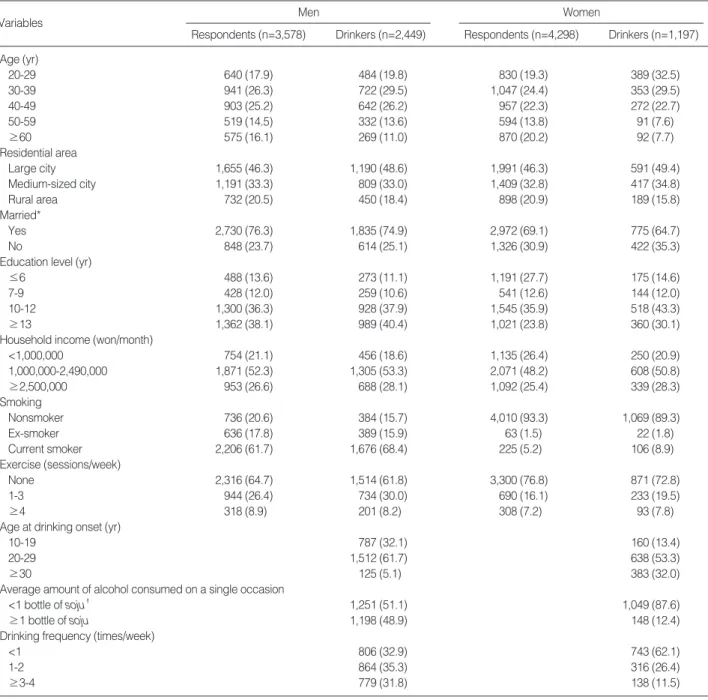
The characteristics of the study population are presented in Table 1. The mean age of male respondents was 43.6± 14.5 yr. The following characteristics were reported by male respondents: 46.3% lived in large cities, 76.3% were mar-
ried, 13.6% had ≤6 yr of education, 21.1% belonged to households that earned less than one million won per month, 61.7% were current smokers, and 64.7% did not perform physical exercise. The mean age of female respondents was 44.6±15.9 yr. The following characteristics were reported by female respondents: 46.3% lived in large cities, 69.1%
were married, 27.7% had ≤6 yr of education, 26.4% be- longed to households that earned less than one million won per month, 5.2% were current smokers, and 76.8% did not perform physical exercise.
The mean age of male drinkers was 41.4±13.2 yr. The
Women
Drinkers (n=1,197) Respondents (n=4,298)
Men
Drinkers (n=2,449) Respondents (n=3,578)
Age (yr)
20-29 640 (17.9) 484 (19.8) 830 (19.3) 389 (32.5)
30-39 941 (26.3) 722 (29.5) 1,047 (24.4) 353 (29.5)
40-49 903 (25.2) 642 (26.2) 957 (22.3) 272 (22.7)
50-59 519 (14.5) 332 (13.6) 594 (13.8) 91 (7.6)
≥60 575 (16.1) 269 (11.0) 870 (20.2) 92 (7.7)
Residential area
Large city 1,655 (46.3) 1,190 (48.6) 1,991 (46.3) 591 (49.4)
Medium-sized city 1,191 (33.3) 809 (33.0) 1,409 (32.8) 417 (34.8)
Rural area 732 (20.5) 450 (18.4) 898 (20.9) 189 (15.8)
Married*
Yes 2,730 (76.3) 1,835 (74.9) 2,972 (69.1) 775 (64.7)
No 848 (23.7) 614 (25.1) 1,326 (30.9) 422 (35.3)
Education level (yr)
≤6 488 (13.6) 273 (11.1) 1,191 (27.7) 175 (14.6)
7-9 428 (12.0) 259 (10.6) 541 (12.6) 144 (12.0)
10-12 1,300 (36.3) 928 (37.9) 1,545 (35.9) 518 (43.3)
≥13 1,362 (38.1) 989 (40.4) 1,021 (23.8) 360 (30.1)
Household income (won/month)
<1,000,000 754 (21.1) 456 (18.6) 1,135 (26.4) 250 (20.9)
1,000,000-2,490,000 1,871 (52.3) 1,305 (53.3) 2,071 (48.2) 608 (50.8)
≥2,500,000 953 (26.6) 688 (28.1) 1,092 (25.4) 339 (28.3)
Smoking
Nonsmoker 736 (20.6) 384 (15.7) 4,010 (93.3) 1,069 (89.3)
Ex-smoker 636 (17.8) 389 (15.9) 63 (1.5) 22 (1.8)
Current smoker 2,206 (61.7) 1,676 (68.4) 225 (5.2) 106 (8.9)
Exercise (sessions/week)
None 2,316 (64.7) 1,514 (61.8) 3,300 (76.8) 871 (72.8)
1-3 944 (26.4) 734 (30.0) 690 (16.1) 233 (19.5)
≥4 318 (8.9) 201 (8.2) 308 (7.2) 93 (7.8)
Age at drinking onset (yr)
10-19 787 (32.1) 160 (13.4)
20-29 1,512 (61.7) 638 (53.3)
≥30 125 (5.1) 383 (32.0)
Average amount of alcohol consumed on a single occasion
<1 bottle of soju� 1,251 (51.1) 1,049 (87.6)
≥1 bottle of soju 1,198 (48.9) 148 (12.4)
Drinking frequency (times/week)
<1 806 (32.9) 743 (62.1)
1-2 864 (35.3) 316 (26.4)
≥3-4 779 (31.8) 138 (11.5)
Table 1. Characteristics of the study population
*, A ‘yes’ response indicates a married person, whereas a ‘no’ response indicates another marital status except married, i.e., single, divorced, sepa- rated, widowed, etc; �, 1 bottle of soju=360 mL, containing 72 g of ethanol.
Variables
48.6% lived in large cities, 74.9% were married, 11.1% had
≤6 yr of education, 18.6% belonged to households that earned less than one million won per month, 68.4% were current smokers, 61.8% did not perform physical exercise, 32.1% started drinking at 10-19 yr of age, 48.9% consum- ed an average of ≥1 bottle of soju (1 bottle of soju=360 mL, containing 72 g of ethanol) on a single occasion, and 31.8%
drank alcohol ≥3-4 times/week. The mean age of female drinkers was 37.5±13.2 yr. The following characteristics were reported by female drinkers: 49.4% lived in large cities, 64.7% were married, 14.6% had ≤6 yr of education, 20.9%
belonged to households that earned less than one million won per month, 8.9% were current smokers, 72.8% did not per- form physical exercise, 13.4% started drinking at 10-19 yr of age, 12.4% consumed an average of ≥1 bottle of soju on a single occasion, and 11.5% drank alcohol ≥3-4 times/
week.
Alcohol consumption
The prevalence of the categories of daily alcohol consump- tion in Korean adults are shown in Table 2. The age-adjust- ed prevalence of moderate, excessive, and heavy drinkers in the total male respondents were 51.5, 12.5, and 8.0%, respec- tively. The prevalence of heavy drinkers (>40 g/day) was highest in their 50s, highest in medium-sized cities among residential areas, higher in married men than in unmarried men, highest in men with ≤6 yr of education compared to other education levels, higher in men whose households earn- ed less than one million won per month than in those whose households earned one or more million won per month, high- er in current smokers than in non- or ex-smokers, and high- er in men who did not perform physical exercise than in those who did perform physical exercise.
The age-adjusted prevalence of moderate, excessive, and heavy drinkers in the total female respondents were 26.6, 3.9, and 1.8%, respectively. The prevalence of heavy drinkers (>20 g/day) was highest in their 40s, highest in rural areas among residential areas, higher in unmarried women than in married women, highest in women with 10-12 yr of edu- cation compared to other education levels, higher in women whose households earned less than one million won per month than in those whose households earned one or more million won per month, higher in current smokers than in non- or ex-smokers, and higher in women who did not perform physi- cal exercise than in those who did perform physical exercise.
The adjusted ORs for excessive and heavy drinking accord- ing to demographic, socioeconomic, lifestyle, and alcohol- related factors among Korean adult drinkers are shown in Table 3. Men aged ≥30 had a higher risk of excessive and heavy drinking than those in their 20s; the ORs for men in their 30s, 40s, 50s, or ≥60s were 1.84 (95% CI, 1.33-2.54), 2.85 (2.00-4.06), 3.34 (2.22-5.03), and 3.57 (2.29-5.56),
respectively. Men with <13 yr of education had a higher risk of excessive and heavy drinking than those with ≥13 yr of education; the ORs for those with ≤6, 7-9, or 10-12 yr of education were 1.87 (1.33-2.63), 1.46 (1.06-2.01), and 1.34 (1.08-1.67), respectively. Men who smoked had a 1.95 (1.47- 2.57) times higher risk of excessive and heavy drinking than nonsmoking men. Men who started drinking at 10-19 yr of age had a 2.64 (1.69-4.12) times higher risk of excessive and heavy drinking than men who started drinking at ≥30 yr of age.
Women with 7-9 or 10-12 yr of education had a 1.89 (1.03-3.50) or 1.66 (1.08-2.54) times higher risk of exces- sive and heavy drinking than those with ≥13 yr of educa-
Men (n=3,578) g/day (%)
0 0.1- >40
20 20.1-
40
Women (n=4,298) g/day (%) 0 0.1- >20
10 10.1-
20 Age (yr)
20-29 23.9 62.3 9.5 4.2 52.5 39.6 5.9 1.9 30-39 22.8 55.9 13.8 7.4 65.4 28.8 3.9 1.8 40-49 28.3 46.0 14.8 10.9 70.8 22.7 4.0 2.5 50-59 35.5 41.1 13.1 11.4 84.3 13.6 1.3 0.7
60+ 52.7 29.4 8.9 9.0 89.2 7.8 1.8 1.1
Residential area
Large city 27.4 51.8 12.6 8.2 69.6 25.7 3.0 1.8 Medium-sized 31.7 47.4 11.6 9.3 69.9 24.2 4.4 1.5
city
Rural area 38.3 40.3 13.3 8.2 78.6 16.1 3.3 1.9 Married
Yes 32.2 45.6 13.3 8.9 73.3 22.4 3.0 1.4
No 27.4 55.5 9.7 7.4 67.8 25.0 4.8 2.4
Education level (yr)
≤6 43.6 30.5 12.5 13.3 85.0 11.7 2.1 1.3
7-9 38.6 39.3 11.4 10.7 73.2 20.3 4.4 2.0 10-12 28.1 48.8 13.8 9.2 65.7 27.6 4.3 2.4
≥13 27.0 56.2 11.3 5.5 64.0 31.5 3.5 1.0
Household income (won/month)
<1,000,000 39.1 39.3 12.5 9.2 77.5 17.4 3.0 2.0 1,000,000- 29.6 49.1 12.7 8.7 70.0 24.8 3.4 1.8
2,490,000
≥2,500,000 27.6 52.7 11.9 7.9 68.4 26.1 4.3 1.2 Smoking
None 47.0 42.7 6.3 4.1 72.7 23.2 3.0 1.1
Ex-smoker 38.4 47.0 9.1 5.5 65.1 25.4 7.9 1.6 Current smoker 23.6 50.0 15.4 10.9 52.4 22.7 12.0 12.9 Exercise (sessions/week)
None 34.0 43.7 12.8 9.4 73.1 21.7 3.4 1.8
1-3 21.9 58.9 12.5 6.7 64.9 29.9 3.9 1.3
≥4 36.5 46.5 9.1 7.9 69.8 24.0 4.5 1.6
Total 31.1 48.0 12.4 8.6 71.6 23.2 3.5 1.7 Age-adjusted 28.0 51.5 12.5 8.0 67.7 26.6 3.9 1.8
prevalence*
*, The age-adjusted prevalence for the categories of daily alcohol con- sumption in Korean adults was calculated by direct standardization using the entire Korean population in 2001 as the standard population.
Variables
tion, respectively. Women who smoked had a 5.71 (3.73- 8.74) times higher risk of excessive and heavy drinking than nonsmoking women.
Positive result to the CAGE questionnaire
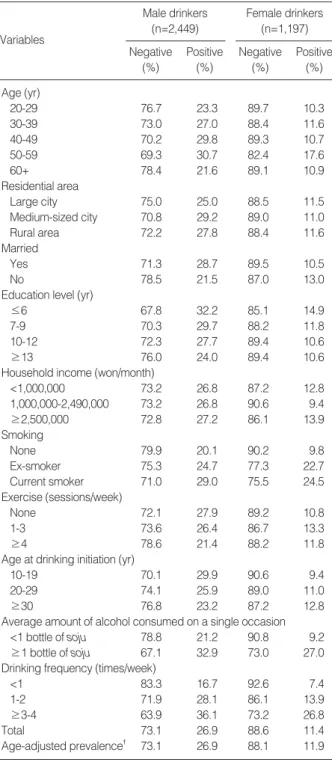
The prevalence of a positive result to the CAGE question- naire in Korean adult drinkers is shown in Table 4. The age- adjusted prevalence of those with a positive CAGE in male drinkers was 26.9%. The prevalence of a positive result to the CAGE questionnaire was highest in their 50s, highest in medium-sized cities among the residential areas, higher in married men than in unmarried men, highest in men with
≤6 yr of education among the education levels, higher in men whose households earned ≥2.5 million won per month than in those whose households earned less monthly income,
higher in current smokers than in non- or ex-smokers, high- er in men who did not perform physical exercise than in those
Male drinkers (n=2,449) Variables
OR (95% CI)
Female drinkers (n=1,197)
OR (95% CI)
Age (yr)
20-29 1.00 1.00
30-39 1.84 (1.33-2.54) 1.23 (0.75-2.02)
40-49 2.85 (2.00-4.06) 1.65 (0.91-2.96)
50-59 3.34 (2.22-5.03) 0.82 (0.34-2.01)
≥60 3.57 (2.29-5.56) 0.97 (0.40-2.37)
Residential area
Large city 1.00 1.00
Medium-sized 1.10 (0.90-1.35) 1.14 (0.81-1.61) city
Rural area 1.02 (0.80-1.30) 1.47 (0.96-2.27) Married
Yes 1.00 1.00
No 1.04 (0.79-1.35) 1.46 (0.97-2.18)
Education level (yr)
≤6 1.87 (1.33-2.63) 1.53 (0.72-3.25)
7-9 1.46 (1.06-2.01) 1.89 (1.03-3.50)
10-12 1.34 (1.08-1.67) 1.66 (1.08-2.54)
≥13 1.00 1.00
Household income (won/month)
<1,000,000 1.07 (0.80-1.43) 0.94 (0.58-1.52) 1,000,000- 1.00 (0.80-1.25) 0.86 (0.59-1.25)
2,490,000
≥2,500,000 1.00 1.00
Smoking
Nonsmoker 1.00 1.00
Ex-smoker 0.93 (0.65-1.32) 1.72 (0.65-4.59) Current smoker 1.95 (1.47-2.57) 5.71 (3.73-8.74) Exercise (sessions/week)
None 1.20 (0.86-1.69) 0.93 (0.53-1.61)
1-3 0.91 (0.63-1.31) 0.78 (0.41-1.48)
≥4 1.00 1.00
Age at onset of drinking (yr)
10-19 2.64 (1.69-4.12) 1.47 (0.81-2.69)
20-29 1.52 (0.99-2.32) 0.90 (0.59-1.37)
≥30 1.00 1.00
Table 3. Adjusted odds ratios (ORs) for excessive and heavy drinking in Korean adult drinkers by multiple logistic regression
Male drinkers (n=2,449) Variables
Negative (%)
Positive (%)
Female drinkers (n=1,197) Negative
(%)
Positive (%) Age (yr)
20-29 76.7 23.3 89.7 10.3
30-39 73.0 27.0 88.4 11.6
40-49 70.2 29.8 89.3 10.7
50-59 69.3 30.7 82.4 17.6
60+ 78.4 21.6 89.1 10.9
Residential area
Large city 75.0 25.0 88.5 11.5
Medium-sized city 70.8 29.2 89.0 11.0
Rural area 72.2 27.8 88.4 11.6
Married
Yes 71.3 28.7 89.5 10.5
No 78.5 21.5 87.0 13.0
Education level (yr)
≤6 67.8 32.2 85.1 14.9
7-9 70.3 29.7 88.2 11.8
10-12 72.3 27.7 89.4 10.6
≥13 76.0 24.0 89.4 10.6
Household income (won/month)
<1,000,000 73.2 26.8 87.2 12.8
1,000,000-2,490,000 73.2 26.8 90.6 9.4
≥2,500,000 72.8 27.2 86.1 13.9
Smoking
None 79.9 20.1 90.2 9.8
Ex-smoker 75.3 24.7 77.3 22.7
Current smoker 71.0 29.0 75.5 24.5
Exercise (sessions/week)
None 72.1 27.9 89.2 10.8
1-3 73.6 26.4 86.7 13.3
≥4 78.6 21.4 88.2 11.8
Age at drinking initiation (yr)
10-19 70.1 29.9 90.6 9.4
20-29 74.1 25.9 89.0 11.0
≥30 76.8 23.2 87.2 12.8
Average amount of alcohol consumed on a single occasion
<1 bottle of soju 78.8 21.2 90.8 9.2
≥1 bottle of soju 67.1 32.9 73.0 27.0
Drinking frequency (times/week)
<1 83.3 16.7 92.6 7.4
1-2 71.9 28.1 86.1 13.9
≥3-4 63.9 36.1 73.2 26.8
Total 73.1 26.9 88.6 11.4
Age-adjusted prevalence� 73.1 26.9 88.1 11.9 Table 4. Prevalence of a positive result to the CAGE* question- naire in Korean adult drinkers
CAGE* is an acronym for four questions that cover experiences asso- ciated with drinking alcohol (cut down, annoyed, guilty, eye-opener). A positive result was defined as two or more (2+) affirmative responses to the CAGE questionnaire.
�, The age-adjusted prevalence of positive result to the CAGE question- naire was calculated by direct standardization using the entire Korean population in 2001 as the standard population.
who performed physical exercise, higher in men who started drinking at 10-19 yr of age than in those who started drink- ing at ≥20 yr of age, higher in men who consumed an aver- age of ≥1 bottle of soju on a single occasion than in those who consumed a smaller amount of alcohol, and higher in men who drank alcohol ≥3-4 times/week than in those who drank less frequently.
The age-adjusted prevalence of those with a positive CAGE in female drinkers was 11.9%. The prevalence of a positive
highest in rural areas among the residential areas, higher in unmarried women than in married women, highest in women with ≤6 yr of education among the education levels, high- er in women whose households earned ≥2.5 million won per month than in those whose households earned less month- ly income, higher in current smokers than in non- or ex-smok- ers, higher in women who performed physical exercise 1-3 session (s)/week than in those who did not exercise or per- formed physical exercise ≥4 sessions/week, higher in women who started drinking at ≥ 30 yr of age than in those who started drinking at 10-29 yr of age, higher in women who consumed an average of ≥1 bottle of soju on a single occa- sion than in those who consumed a smaller amount of alco- hol, and higher in women who drank alcohol ≥3-4 times/
week than in those who drank less frequently.
The adjusted ORs for a positive CAGE according to demo- graphic, socioeconomic, lifestyle, and alcohol-related factors among Korean adult drinkers are shown in Table 5. Men aged ≥60 had a 0.52 (0.32-0.84) times lower risk for a posi- tive CAGE than those in their 20s. Unmarried men had a 0.69 (0.52-0.92) times lower risk for a positive CAGE than married men. Men with ≤6 yr of education had a 1.56 (1.07- 2.27) times higher risk for a positive CAGE than those with
≥13 yr of education. Men who smoked had a 1.33 (1.00- 1.77) times higher risk for a positive CAGE than nonsmok- ing men. Men who consumed an average of ≥1 bottle of soju on a single occasion had a 1.50 (1.24-1.82) times high- er risk for a positive CAGE than those who consumed a small- er amount of alcohol. Men who drank alcohol 1-2 times/week or ≥3-4 times/week had 1.71 (1.34-2.19) and 2.38 (1.84- 3.08) times higher risk for a positive CAGE than those drank less frequently, respectively.
Women whose households earned 1,000,000-2,490,000 won per month had a 0.59 (0.38-0.94) times lower risk for a positive CAGE than those whose households earned ≥ 2,500,000 won per month. Women who were ex-smokers had a 3.25 (1.10-9.64) times higher risk for a positive CAGE than nonsmoking women. Women who consumed an aver- age of ≥1 bottle of soju on a single occasion had a 2.78 (1.72- 4.48) times higher risk for a positive CAGE than those who consumed a smaller amount of alcohol. Women who drank alcohol 1-2 times/week or ≥3-4 times/week had a 1.82 (1.17- 4.48) and 3.69 (2.15-6.32) times higher risk for a positive CAGE than those drank less frequently, respectively.
DISCUSSION
We performed a nationwide assessment of alcohol con- sumption and alcohol-related problems in Korean adults.
The age-adjusted prevalence of excessive and heavy drink- ing was 20.5% in men and 5.7% in women. A total of 10.1%
of Korean adults (18.4% of men and 3.2% of women) had a
Male drinkers (n=2,449) Variables
OR (95% CI)
Female drinkers (n=1,197)
OR (95% CI)
Age (yr)
20-29 1.00 1.00
30-39 0.88 (0.64-1.21) 1.06 (0.57-1.96)
40-49 0.85 (0.60-1.21) 0.77 (0.36-1.66)
50-59 0.84 (0.56-1.28) 1.39 (0.53-3.63)
≥60 0.52 (0.32-0.84) 0.38 (0.12-1.19)
Residential area
Large city 1.00 1.00
Medium-sized city 1.18 (0.96-1.46) 0.92 (0.60-1.40) Rural area 1.05 (0.81-1.37) 0.89 (0.50-1.57) Married
Yes 1.00 1.00
No 0.69 (0.52-0.92) 1.27 (0.77-2.10)
Education level (yr)
≤6 1.56 (1.07-2.27) 1.59 (0.68-3.72)
7-9 1.27 (0.90-1.79) 1.06 (0.50-2.25)
10-12 1.12 (0.90-1.40) 0.89 (0.54-1.48)
≥13 1.00 1.00
Household income (won/month)
<1,000,000 0.91 (0.67-1.24) 0.73 (0.41-1.31) 1,000,000- 0.90 (0.72-1.13) 0.59 (0.38-0.94)
2,490,000
≥2,500,000 1.00 1.00
Smoking
Nonsmoker 1.00 1.00
Ex-smoker 1.22 (0.85-1.73) 3.25 (1.10-9.64) Current smoker 1.33 (1.00-1.77) 1.60 (0.90-2.86) Exercise (sessions/week)
None 1.22 (0.84-1.77) 0.86 (0.43-1.73)
1-3 1.24 (0.84-1.83) 1.18 (0.54-2.55)
≥4 1.00 1.00
Age at onset of drinking (yr)
10-19 1.16 (0.72-1.87) 0.53 (0.23-1.21)
20-29 1.05 (0.67-1.66) 0.87 (0.51-1.49)
≥30 1.00 1.00
Average amount of alcohol consumed on a single occasion
<1 bottle of soju 1.00 1.00
≥1 bottle of soju 1.50 (1.24-1.82) 2.78 (1.72-4.48) Drinking frequency (times/week)
<1 1.00 1.00
1-2 1.71 (1.34-2.19) 1.82 (1.17-2.85)
≥3-4 2.38 (1.84-3.08) 3.69 (2.15-6.32)
annayedm guilty, eye-pener questionnaire in Korean adult drin- kers by multiple logistic regression
positive CAGE, which was converted to 10.8% (19.2% of men and 3.6% of women) after direct standardization using the entire Korean population in 2001 as the standard popu- lation. This is higher than the reported prevalence of a posi- tive CAGE in Canadians (3.4%) and a sample of individuals in three Italian villages (3.5%) (8, 9), using the same defini- tions for drinkers as in the present study. The result appears to agree with the cross-national comparison study of alcohol use disorder reported by Helzer et al. in 1990. They report- ed that the lifetime prevalence of alcohol use disorder in Korea was much higher than in other countries (St. Louis, U.S.A.;
Edmonton, Canada; Puerto Rico; and Taipei City, Taiwan).
The differential effects of socio-cultural moral attitudes, low ability to metabolize alcohol, and ethnic-specific cohort effect were suggested as possible explanations for the prevalence in Korea (14, 15). We think that these explanations are appli- cable to our results. Therefore, our results suggest that high alcohol consumption and alcohol-related problems in Kore- an adults are not negligible and require intervention.
Evaluation of the risk factors for high alcohol consump- tion and a positive CAGE can aid the identification of tar- get groups who need intervention to reduce alcohol-related disorders. This study revealed that old age, low education level, smoking, and onset of drinking at a young age were risk factors for high alcohol consumption in male drinkers, whereas low education level and smoking were risk factors in female drinkers. Young age, marriage, low education level, smoking, high amount of alcohol consumed on a single occa- sion, and high drinking frequency were proven to be risk factors for a positive CAGE in male drinkers, whereas high household income, ex-smoking, high amount of alcohol con- sumed on a single occasion, and high drinking frequency were risk factors in female drinkers.
The risk factors for high alcohol consumption and a posi- tive CAGE identified mostly agreed with the results of pre- vious studies on alcohol problems that identified gender, socioeconomic status, and smoking as important risk factors (16, 17). However, the positive associations of certain fac- tors with a positive CAGE (young age and marriage in male drinkers; ex-smoking and high household income in female drinkers) did not agree with the results of the risk factors for high alcohol consumption in this study. There are several possible explanations for these results. Primarily, they may have been due to chance. Additionally, although high alco- hol consumption and alcohol-related problems are closely related, the underlying mechanism of these two factors may be dissimilar. Studies indicate that genes that affect alcohol intake also affect the risk for alcohol dependence, but other genes only affect alcohol dependence (18). A survival effect can be postulated for the positive association of age with high alcohol consumption and negative association of age with a positive CAGE. Young drinkers with alcohol-related prob- lems cannot manage their drinking level into old age. Drin- kers with a small degree of or without alcohol-related prob-
lems are capable of drinking at an old age.
Caution must be exercised in applying the CAGE ques- tionnaire to the general population. The reliability and valid- ity of the CAGE questionnaire has been demonstrated in the majority of studies conducted in clinical settings, but the validity at the scale of a general population has not been con- clusively demonstrated. Bisson et al. evaluated the validity of the CAGE questionnaire to screen for heavy drinking and drinking problems in a general population survey and con- cluded that the CAGE questionnaire was not valid for use as a screening tool for heavy drinking and drinking problems in a general population survey or as a tool to estimate the preva- lence of drinking problems in the population (19). In con- trast, many other researchers have suggested that the CAGE questionnaire effectively detects subjects at higher risk levels due to alcohol consumption with a predictive value of 50%
compared to 20-40% for laboratory indicators (7).
The age-adjusted prevalence of abstainers was 28.0% in males and 67.7% in females. Various reasons lead people not to drink alcohol, e.g., religion, family history of alcohol depen- dence, and alcohol intolerance. Drinkers who have serious alcohol-related problems might abstain temporarily and would thus be classified as abstainers if they were abstaining at the time of the survey. Therefore, the prevalence for the categories of alcohol consumption and a positive CAGE are variable according to the conditions. Further studies are required to evaluate alcohol consumption and alcohol-related problems in Korea.
REFERENCES
1. Goldberg IJ, Mosca L, Piano MR, Council on Epidemiology and Prevention Fisher EA; Nutrition Committee, and Council on Car- diovascular Nursing of the American Heart Association. AHA Sci- ence Advisory: Wine and your heart: a science advisory for health- care professionals from the Nutrition Committee, Council on Epi- demiology and Prevention, and Council on Cardiovascular Nursing of the American Heart Association. Circulation 2001; 103: 472-5.
2. Malinski MK, Sesso HD, Lopez-Jimenez F, Buring JE, Gaziano JM.
Alcohol consumption and cardiovascular disease mortality in hyper- tensive men. Arch Intern Med 2004; 164: 623-8.
3. Kim JS, Kim CH. Alcohol drinking. In: Korean Academy of Family Medicine, ed, Family medicine. Seoul: Kye-chuk-moon-hwa-sa, 2003;
458-74.
4. Wakai K, Kojima M, Tamakoshi K, Watanabe Y, Hayakawa N, Suzuki K, Hashimoto S, Kawado M, Tokudome S, Suzuki S, Ozasa K, Toyoshima H, Ito Y, Tamakoshi A; JACC Study Group. Alcohol consumption and colorectal cancer risk: findings from the JACC Study. J Epidemiol 2005; 15 (Suppl 2): S173-9.
5. Chung WJ, Chun HJ, Lee SM. Socioeconomic costs of alcohol drink- ing in Korea. J Prev Med Pub Health 2006; 39: 21-9.
6. Working Party of the Royal College of Physicians. ALCOHOL - can the NHS afford it?: Recommendations for a coherent alcohol strategy
7. Maisto SA, Connors GJ, Allen JP. Contrasting self-report screens for alcohol problems: a review. Alcohol Clin Exp Res 1995; 19: 1510-6.
8. Poulin C, Webster I, Single E. Alcohol disorders in Canada as indi- cated by the CAGE questionnaire. CMAJ 1997; 157: 1529-35.
9. Guerrini I, Gentili C, Guazzelli M. Alcohol consumption and heavy drinking: a survey in three Italian villages. Alcohol Alcohol 2006;
41: 336-40.
10. Korea Institute for Health and Social Affairs. Korea National Health and Nutrition Examination Survey 2001. Seoul: Ministry of Health and Welfare of Korea, 2001.
11. U.S. Department of Health and Human Services and U.S. Department of Agriculture. Dietary guidelines for Americans, 2005. Washington, DC: U.S. Government Printing Office, 2005.
12. Miller WR, Heather N, Hall W. Calculating standard drink units:
international comparisons. Br J Addict 1991; 86: 43-7.
13. Karp AH. SUGI 26: Getting Started with PROC LOGISTIC. Avail- able at URL: http://www2.sas.com/proceedings/sugi26/p248-26.
pdf (accessed May 10, 2007)
14. Helzer JE, Canino GJ, Yeh EK, Bland RC, Lee CK, Hwu HG, New-
ulation surveys with the Diagnostic Interview Schedule. Arch Gen Psychiatry 1990; 47: 313-9.
15. Hahm BJ, Cho MJ. Prevalence of alcohol use disorder in a South Korean community-changes in the pattern of prevalence over the past 15 years. Soc Psychiatry Psychiatr Epidemiol 2005; 40: 114-9.
16. Bradstock K, Forman MR, Binkin NJ, Gentry EM, Hogelin GC, Williamson DF, Trowbridge FL. Alcohol use and health behavior lifestyles among U.S. women: the behavioral risk factor surveys.
Addict Behav 1988; 13: 61-71.
17. Mendoza-Sassi RA, Beria JU. Prevalence of alcohol use disorders and associated factors: a population-based study using AUDIT in southern Brazil. Addiction 2003; 98: 799-804.
18. Whitfield JB, Zhu G, Madden PA, Neale MC, Heath AC, Martin NG.
The genetics of alcohol intake and of alcohol dependence. Alcohol Clin Exp Res 2004; 28: 1153-60.
19. Bisson J, Nadeau L, Demers A. The validity of the CAGE scale to screen for heavy drinking and drinking problems in a general popu- lation survey. Addiction 1999; 94: 715-22.