http://dx.doi.org/10.5369/JSST.2019.28.4.205 pISSN 1225-5475/eISSN 2093-7563
Fabrication and Characterization of a Flexible PVDF Fiber-based Polymer Composite for High-performance Energy Harvesting Devices
Duc-Nam Nguyen and Wonkyu Moon+
Abstract
A flexible polyvinylidene fluoride (PVDF)/polydimethylsiloxane (PDMS) composite prototype with high piezoelectricity and force sensitivity was constructed, and its huge potential for applications such as biomechanical energy harvesting, self-powered health mon- itoring system, and pressure sensors was proved. The crystallization, piezoelectric, and electrical properties of the composites were char- acterized using an X-ray diffraction (XRD) experiment and customized experimental setups. The composite can sustain up to 100%
strain, which is a huge improvement over monolithic PVDF fibers and other PVDF-based composites in the literature. The Young’s modulus is 1.64 MPa, which is closely matched with the flexibility of the human skin, and shows the possibility for integrating PVDF/
PDMS composites into wearable devices and implantable medical devices. The 300 µm thick composite has a 14% volume fraction of PVDF fibers and produces high piezoelectricity with piezoelectric charge constants d31 = 19 pC/N and d33 = 34 pC/N, and piezo- electric voltage constants g31 = 33.9 mV/N and g33 = 61.2 mV/N. Under a 10 Hz actuation, the output voltage was measured at 190 mVpp, which is the largest output signal generated from a PVDF fiber-based prototype.
Keywords: polyvinylidene fluoride, EpCA electrospinning, energy harvesting device, microfiber-based composite, piezoelec- tric polymer.
1. INTRODUCTION
One of the most promising applications in micro-energy harvesting is the application of biomechanical energy harvesting capable of integration into implantable devices and the conversion of motion energy in the human body (from activity such as muscle movement, heartbeat, and vibration of the larynx) into electrical energy [1, 2]. Such special applications require not only a high electromechanical conversion rate but also high flexibility and stretchability. Crucially, the mechanical properties of the biomechanical energy harvesting module in an implantable device must match the supporting biological component, such as skin or muscle, which are tissue with complex geometry. Therefore, a micro-energy harvesting device with biomechanical applications possessing the following features is a must: extreme flexibility,
ease of fabrication, and capability for integration into tissue with complex geometry. Chang et al. [3] fabricated aligned electrospun polyvinyl fluoride (PVDF) fibers on a polyethylene terephthalate (PET) substrate using near-field electrospinning (NFES). The fibers generated 5–30 mV under sinusoidal excitation. Chang et al. also reported that randomly oriented PVDF fibers fabricated using electrospinning showed no measurable electrical output, which contradicts reports by Lei et al. [4]. Let et al. reported that the random morphology of electrospun PVDF fibers produced 175 mV, while the aligned electrospun PVDF fibers registered only 83 mV. The primary difference is in the configuration of the electrodes that collect the accumulated charges, as shown in Fig.
S1a and S1b. Therefore, besides the fabrication conditions, which significantly impact the percentage of the dipole phase of the PVDF [5], the configuration of the electrodes plays an essential role in the design of a PVDF nanofiber or microfiber-based energy harvesting device. Ding et al. [6] fabricated a PVDF based composite composed of four layers PET, Cu electrode, PVDF fibers, and Polydimethylsiloxane (PDMS), based on mechano- electrospinning, which is the combination of NFES and precise manipulation of the moving substrate. The composite produces a maximum of 150 mV at 2.3 Hz during a bending test with lots of air voids and potential for layer detachability, because the four layers were stacked with no bonding mechanism. In the literature, Department of Mechanical Engineering, Pohang University of Science and
Technology, San 31, Hyojadong, Namgu, Kyungbuk 37673, South Korea
+Corresponding author: [email protected]
(Received: July. 2, 2019, Revised: July. 11, 2019, Accepted: July. 12, 2019)
This is an Open Access article distributed under the terms of the Creative Commons Attribution Non-Commercial License(http://creativecommons.org/
licenses/bync/3.0) which permits unrestricted non-commercial use, distribution, and reproduction in any medium, provided the original work is properly cited.
the substrate is made from PET or indium tin oxide (ITO) and is used primarily as the supporting structure for the electrodes. The limitation of PET or indium tin oxide is primarily its high stiffness, which is a point of difference from PVDF fibers.
Consequently, all PVDF fiber-based composite materials have been tested primarily through thickness compression or bending tests without mention of performance in terms of pure longitudinal extension. Because of poor bonding strength and a large difference in elastic modulus, peeling phenomena in a lamina composite are inevitable.
In this study, we propose a solution for increasing the sensitivity of PVDF fibers by maximizing the alignment of the electrospun PVDF fibers, and a solution for improving its durability by encasing the well-aligned electrospun PVDF in an elastomer, PDMS. The recently published end-point control assembly (EpCA) method was selected to produce well-aligned bundles of electrospun fibers using a highly controllable process. Taguchi’s analysis was applied to optimize the fabrication process to produce bundles of well-aligned PVDF fibers with uniform fibers diameter. The PVDF/PDMS composite was then characterized based on a variety of properties, including its crystalline phase, mechanical stress-strain behavior, and electromechanical properties.
This report is divided into four sections. The first section, the introduction, will provide an overview of current achievements and obstacles to flexible microfiber-based energy harvesting devices, together with the scope and objectives of this study.
Section 2, materials and methods, presents more detail on the materials and methods used in the fabrication process, including an introduction to Taguchi’s method of engineering analysis described with specific output targets. Section 2 also explains the characterization technique and configuration used in this study.
Results and discussion are the third section, which presents detailed results and analysis. The concluding section summarizes the content and suggests procedures for applicable devices.
2. MATERIALS AND METHODS
2.1 Materials
Polyvinylidene fluoride (Mv = 540,000) in powder form and N, N-dimethylformamide (DMF, anhydrous, 99.8%) were purchased from Sigma Aldrich (South Korea branch) without further processing. Acetone was purchased from Deasung Inc., South Korea. Initially, DMF/Acetone solution was prepared by mixing two solutions with a 4:1 volume ratio of DMF:Acetone at room temperature for 30 minutes. PVDF powder was mixed with the DMF/Acetone solvent in glass bottles. All solutions were heated at 90 °C for five to ten minutes for increased solubility and enhanced β-phase [7]. The heating process was not allowed to exceed 10 minutes to prevent evaporation of the solvent in the solutions, which would increase the concentration. The solutions were then allowed to cool to room temperature for 2–3 hours, at which they attained a bubble-free condition.
2.2 Fabrication procedure for composites
The fabrication procedure for the PVDF/PDMS composite is presented in Fig. 1. First, highly aligned fibers were fabricated using the electrospinning method. Polydimethylsiloxane (PDMS, SYLGARD 184 silicon Elastomer Kit, Dow Corning Corporation, Midland, MI) was prepared following a 10:1 ratio (base:curing agent = 10:1 by weight) and degassed in a vacuum for 30 minutes at room temperature. The PDMS mixture was then poured into a 50 mm diameter crystallization dish (Pyrex) and tilted back and forth continuously to ensure the PDMS mixture was distributed evenly throughout the disk. The PDMS mixture was cured at 150 °C for 15 minutes to obtain a solid transparent substrate. Two 5 nm thick Au-Pd electrodes were sputtered using an ion sputter (E-1045, Hitachi, Japan). The aligned PVDF fibers were manually assembled on top of the electrodes, and a thin layer of PDMS mixture was poured on top of the fibers. The samples were then tilted continuously to increase the distribution of the PDMS mixture and then balanced for 30 minutes at room temperature to ensure a bubble-free condition. After a unified PVDF/PDMS composite was formed, a second Au-Pd sputtering on the PVDF fibers was conducted to increase conductivity. The final prototype Fig. 1. Fabrication procedure for uniaxial PVDF fiber/PDMS com-
psite
was trimmed to the target dimension (Fig. S2a and S2b).
2.3 Electrospinning of PVDF Fibers using End- point Control Assembly Electrospinning Method
The electrospinning (ES) technique was selected for fabricating PVDF fibers because of its superior versatility and consistency in generating nano, micro-sized fibers directly from a PVDF solution. The β-phase PVDF, which exhibits the best piezoelectric, ferroelectric, and pyroelectric properties among the five PVDF polymorphs, including α, β, γ, δ, and ε-phase, can be formed via the electrospinning process [8]. With the help of a rotating collector, which evenly enhances the elongation of a PVDF fluidic jet, the percentage of polar β-phase in PVDF fibers can be increased after the electrospinning step without further processing.
In the ES process, the electrostatic force is one of the most dominant factors influencing the motion of the charged fluid.
Based on the idea of manipulating the electrostatic field, several researchers have tried to develop conventional ES that precisely deposits the fibers on a grounded collector, such as parallel auxiliary electrodes [9], interdigitated electrodes and dielectric substrate [10, 11], electro-centrifugal spinning [12], and near-field electrospinning (NEFS) method [13]. A method categorized as far-field electrospinning (FFES) in which the tip-to-collector distance (TCD) is several centimeters long, has the benefit of high productivity because many fibers are collected within a short period. With the assistance of auxiliary electrodes [14] or a special configuration of the collector [15], the level of orientation of the fibers is significantly much more enhanced than those from conventional ES. However, the precision of deposition of a single
fiber in the target area is a bottleneck for far-field electrospinning methods. NFES, which was first introduced by Sun et al. [16], occupies a short straight path before the jet starts looping, to control the position in which the fibers are deposited, and it obtains the highest level of precision in ES. Consequently, a distance less than one centimeter is preferred for precise deposition of the fibers but is also a drawback to the application of NFES for a polar solution like PVDF. Because of the small gap between the source and the ground, and the low external applied voltage, the polar phase is usually less oriented than in PVDF fibers made using FFES.
The EpCA method is a developmental method of conventional ES for manipulating the electrified jet to deposit its endpoint to a specific area using a concentrated electrostatic field [17, 18]. This method utilizes a voltage generator (Spellman SL 60), a cylindrical collector (radius R = 5 cm), a syringe, and a couple of dielectric films installed as shown in Fig. S3. The rotational motion of the collector is controlled by a DC motor, while translational motion is actuated by a stepper motor through a microcontroller. A charge-coupled-device (CCD) camera (WAT- 202D, Japan) was used to capture and monitor the fabrication process. The dielectric film plays an essential role in the key mechanism focusing the electrostatic field on the target area (Fig.
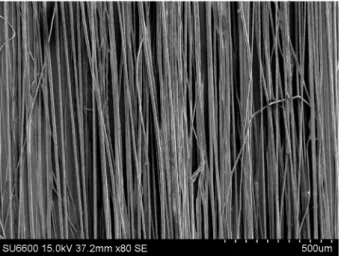
2). Due to the concentration effect of the electric field, the charged polymer jet is damped to a predefined position on the collector, regardless of its whipping process. The EpCA electrospinning method is the only technique that combines the high precision deposition capability of the NFES method with the high productivity of far-field and centrifugal electrospinning. Using EpCA Electrospinning method, bundles of electrospun fiber with uniform fiber diameter, uniform levels of alignment, and controllable width can be easily obtained at high levels of productivity (Fig. 3).
2.4 Application of Taguchi’s method to the optimization of EpCA electrospinning method
In the EpCA electrospinning setup, there are numerous highly varied parameters. The optimal process parameters are often derived through trial and error and based on the know-how of the operator, leading to waste of materials and labor. Therefore, an effective approach is required for obtaining sufficient and relevant data. We used the Taguchi method, which is based on orthogonal array experiments to reduce the variance, and a full factorial of experiments was conducted at optimal conditions for robust quality control. The Taguchi method was applied using the steps Fig. 2. Simulation of electric potential distribution on the EpCA ES
setup
outlined in Table 1.
Taguchi’s method has been applied in micro/nanofiber fabrication using ES to select the optimal level of processing parameters with minimal variations [19, 20]. However, most studies in the literature have focused on the analysis of fiber diameter uniformity, while the alignment level is still a missing section. Thus, in this study, we established two different design of experiment (DOE) tables for different targets: fiber diameter uniformity and fiber alignment level. In the Taguchi analysis, the fiber diameter is targeted for nominal is the best while the alignment is preferred as largest is the best. Because both the open gap and the translational speed do not contribute to variation in fiber diameter, the Taguchi orthogonal array for fiber diameter is L9 (34) while the Taguchi orthogonal array for fiber alignment is
L27 (36). For three level-factors, the L27 orthogonal array is most commonly used without loss of generality, as shown in Table 1 [21]. Therefore, instead of conducting full factorial experiments of trials, only a total of 27 trials are required.
Signal-to-Noise Ratio (SNR):
The SNR characteristic in the Taguchi method can be divided into the following targets:
• If the nominal value is the top priority (nominal is the best):
(1)
• If the smaller value is preferred (smallest is the best):
(2)
• If the larger value is the most concern (largest is the best):
(3)
where n is the number of experiments in each data set, y is the data recorded, and is the standard deviation of each data set.
To calculate the effect of each factor on output performance, the percentage impact of each effect on the overall performance, in percentage, is required.
The total variation is calculated as follows:
(4) 10 log 2
y
S y
N = s
( 2)
10 log1
S y
N = − n ∑
2
1 1
S log
N = − n⎛ y ⎞
⎜ ⎟
⎝∑ ⎠
sy
( )
22
1
1
i
i N
N
i T
i
Y
S Y
N
=
=
= −
⎡ ⎤
⎢ ⎥
⎡ ⎤
⎢ ⎥
⎢ ⎥
⎣ ⎦
⎢ ⎥
⎣ ⎦
∑ ∑
Fig. 3. SEM of electrospun PVDF fibers.
Table 1. Implementation procedure for applying Taguchi’s method
Step Task Note
1 Process parameters are selected based on theory or preliminary exper- iments.
Concentration (C), Tip-to-Collector Distance (TCD), Voltage (V), Rotation speed (ω), Open gap (δ), Translational speed (τ)
2 The number of levels for each process parameter is selected based on pre- liminary experiments.
C (% wt): 20, 25, 30 TCD (cm): 9, 11, 13 V (kV): 10, 14, 18 ω (rpm): 1000, 2000, 3000
δ (mm): 3, 5, 10 τ (mm/s): 5, 10, 20 3 The orthogonal arrays (L27 – 36) are determined using Sigma Magic
software.
4 Selected samples from the orthogonal arrays are generated.
5 The relevant data set and quality characteristics are determined, followed by the design of the experiments.
6 Analyze the data using the signal-to-noise ratio (SNR) and confirm the dependence of outputs on the parameters
7 Verify the optimal parameter set obtained from Step 6.
where is the mean value and N is the number of trials (in this case, N = 27)
while the variation of each factor is calculated as follows:
(5)
where C.F is the correction factor and is calculated as:
(6)
N is the number of S/N values or the number of columns.
Consequently, the percentile impact of each factor is:
(7)
where i = 3, the number of a factor in the case of the target fiber diameter, and T = 6 as the number of a factor in the fiber alignment approach.
2.4.1 Quality character: Fiber diameter
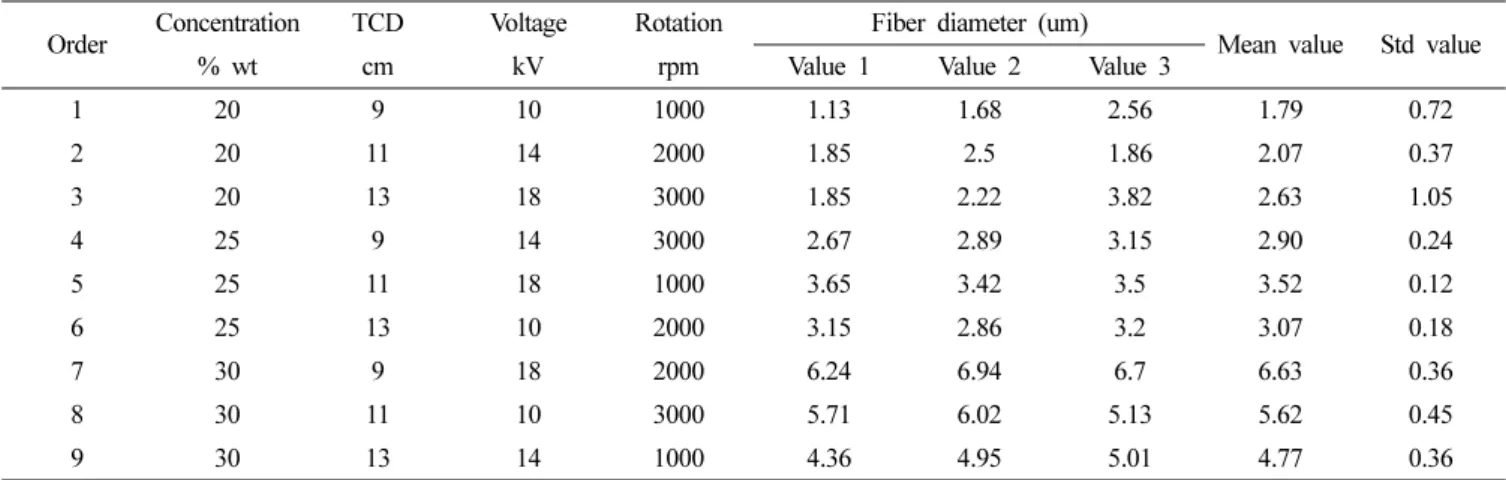
Fiber diameter uniformity is often one of the interesting quality characters for verifying the repeatability and stability of the ES process. Furthermore, a composite with less variation in fiber diameter allows more precise simulation results. The DOE is applied for fiber diameter based on three factors: concentration (C), TCD, and applied voltage (V). Details of the order of the experiments and their results are presented in Table 2.
2.4.2 Quality character: Fiber alignment
The fiber alignment output requires six factors: concentration (C), TCD, voltage (V), rotation speed (ω), open gap (δ), and translational speed (τ). Details of the order of the experiments
orders and their results are presented in Table 3.
2.5 Piezoelectric characterization
The piezoelectric characteristic of the PVDF/PDMS composite was conducted based on the direct piezoelectric effect, with the charge generated measured while applying a known force level.
Because the electric polarization is 1-direction, which is perpendicular to the fiber axis, we targeted to measure the d31 and d31 coefficients.
Measurement of the d31 value
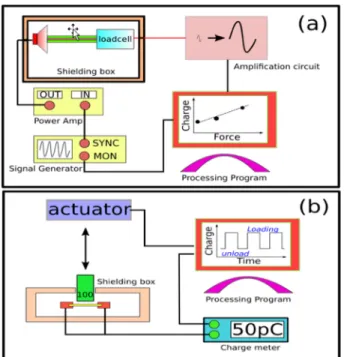
Measurement of the d31 value was based on a setup described by Nguyen et al. in which a loudspeaker baffle was used to actuate the fibers at different frequencies (Fig. 4a). A function generator (Agilent 33522A) was used to generate the waveform while a bipolar amplifier (NF, high-speed bipolar amplifier HAS 4052) was used to amplify the control voltage from the function generator. A load cell (FUTEK LSB200, Irvin, CA, USA, 100g) was connected to one end of the sample, while the other end was fixed to the baffle of the loudspeaker. The charge generated was measured using a charge meter (Keithley 6567B, Cleveland, OH), and recorded using the program designated by Keithley.
Measurement of the d33 value
We used three calibrated weights of 100 g, 200 g, and 500 g, which were lifted up and down using a stepper motor-based system. The velocity and time of loading/unloading are precisely controlled. The whole system was covered with a Faraday cup- like setup shown in Fig. 4b. The charge and voltage generated were recorded using a Keithley 6567B Electrometer/high- resistance.
Yi
2 1
1 .
N
i i
i
S Y C F
N =
= ∑ −
( )
2.
S C F N
= ∑ N
100
i i
T
P S
= S ×
Table 2. Design of Experiment and results for the fiber diameter
Order Concentration TCD Voltage Rotation Fiber diameter (um)
Mean value Std value
% wt cm kV rpm Value 1 Value 2 Value 3
1 20 9 10 1000 1.13 1.68 2.56 1.79 0.72
2 20 11 14 2000 1.85 2.5 1.86 2.07 0.37
3 20 13 18 3000 1.85 2.22 3.82 2.63 1.05
4 25 9 14 3000 2.67 2.89 3.15 2.90 0.24
5 25 11 18 1000 3.65 3.42 3.5 3.52 0.12
6 25 13 10 2000 3.15 2.86 3.2 3.07 0.18
7 30 9 18 2000 6.24 6.94 6.7 6.63 0.36
8 30 11 10 3000 5.71 6.02 5.13 5.62 0.45
9 30 13 14 1000 4.36 4.95 5.01 4.77 0.36
Measurement of voltage generation
The sensitivity of the material was determined by the voltage generated under loading. Therefore, by applying the same configuration as in the piezoelectric coefficient measurement, sensitivity under longitudinal and thickness excitation loading can be measured.
3. RESULTS AND DISCUSSIONS
3.1 Optimization process from Taguchi’s method
Analysis of the effect of processing parameters in the EpCA ES method on the uniformity of fiber diameter
As seen in Fig. 5a, the concentration factor has the most dominant effect on the average fiber diameter compared to TCD
and applied voltage V. To further investigate the viscosity of PVDF/DMF, acetone solutions with different concentration levels and a viscometer instrument for measuring viscosity and shear rate (Brookfield DV-III Ultra Cone/Plate Rheometer) were used.
Five different PDVD/DMF acetone solutions, with concentrations of 5%, 6.5%, 10%, 15%, and 20% wt, were used in the measurement process. The PVDF/DMF acetone with 20% wt solution was the maximum concentration level that can be measured with our equipment without overflow of the measurement scale. The data is presented in Fig. S4 and Fig. S5.
The interpolated viscosity of PVDF/DMF acetone solutions at 25% and 30% wt are 18,300 cP and 51,711 cP, while that of the 20% wt solution is 5000 cP. Such a large variation in viscosity is the primary cause of the large value of the relative impact of the SNR and standard deviation in the case of the fiber diameter being Table 3. Design of Experiment and results as the Quality character is fiber alignment
Order Concentration TCD Voltage Rotation Gap Translation
Mean Std value
% wt cm kV rpm cm mm/s
1 30 9 18 2000 10 10 0.85 0.03
2 20 11 14 2000 5 10 0.89 0.06
3 30 13 14 1000 5 5 0.65 0.19
4 20 9 10 1000 3 5 0.64 0.07
5 25 11 18 1000 3 10 0.65 0.16
6 20 9 10 1000 5 10 0.36 0.12
7 25 11 18 1000 5 20 0.54 0.10
8 25 13 10 2000 10 5 0.67 0.09
9 25 13 10 2000 3 10 0.67 0.05
10 20 13 18 3000 3 5 0.84 0.08
11 30 9 18 2000 5 5 0.77 0.07
12 30 13 14 1000 10 10 0.46 0.12
13 25 9 14 3000 10 5 0.78 0.05
14 20 9 10 1000 10 20 0.49 0.12
15 30 13 14 1000 3 20 0.53 0.10
16 20 11 14 2000 10 20 0.59 0.07
17 30 11 10 3000 10 10 0.81 0.04
18 30 9 18 2000 3 20 0.59 0.12
19 30 11 10 3000 3 20 0.84 0.08
20 20 13 18 3000 10 20 0.72 0.11
21 25 9 14 3000 3 10 0.87 0.05
22 30 11 10 3000 5 5 0.94 0.03
23 25 11 18 1000 10 5 0.73 0.06
24 20 11 14 2000 3 5 0.71 0.17
25 20 13 18 3000 5 10 0.75 0.10
26 25 9 14 3000 5 20 0.83 0.07
27 25 13 10 2000 5 20 0.55 0.08
nominal is the best (Fig. 5b and 5c). Compared to the change in concentration and applied voltage, the TCD adjusted from 9 cm to 13 cm shows the lowest impact on the mean fiber diameter. A high voltage promotes the reduction of the fiber diameter via a strong electrostatic repulsive force and probably a more severe bending instability process. However, the EpCA ES process dampens the looping radius in the bending instability process, resulting in a lower impact of the voltage applied on the fiber diameter. Based on the output table, the highest level of uniformity of fiber diameter can be achieved at process conditions of 25% wt, TCD = 11 cm, and V = 18 kV.
Analysis of the effects of processing parameters in the EpCA ES method on fiber alignment level
One of the most critical objectives of applying Taguchi’s
method to analyze the EpCA ES fabrication technique is to determine the most robust set of parameters at which the maximum level of alignment can be obtained. To fully investigate the most dominant parameters in EpCA ES, six parameters, including concentration (C), TCD, voltage (V), rotation speed (ω), open gap (δ), and translational speed (τ), were selected. The significant impact of the rotation speed ω of the cylindrical collector on the alignment of electrospun fiber has been reported in several papers [15, 22] while the importance of the open gap δ and translational speed τ are discussed for the first time. The open gap in EpCA ES is the key mechanism that enhances the focusing of the location of a flying electrified jet on a target area. It also has effects on the triggered voltage, which is the minimum applied voltage for ejecting the Taylor cone at the beginning of an ES process. The higher trigger voltage means that a high electrostatic charge density on the droplet is required to overcome the surface tension and an even higher electrostatic force exerted on the dipole moment in the polymer chain. The experimental results prove that the open gap is proportional to the trigger voltage and inversely proportional to the bundle width of the fibers (See Fig.
S6). The open gap also determines the boundary width of the bundle if the polyimide films are static. Detailed measurement data presented in Fig. S7 shows that the TCD has no effect on the bundle width if the two dielectric films do not move. However, to fabricate a large area on a PVDF fiber bundle with identical levels of alignment, there must be translation of the open gap.
The analysis using Taguchi’s method consolidates the conclusion in the literature that the rotation speed has the most dominant impact on the level of alignment of electrospun fibers [18, 23]. The impact on the standard deviation of alignment is an approximately equal distribution for concentration, TCD, voltage, and the open gap, while the translation speed is relatively important for the impact of SNR on alignment (Fig. 5d). This conclusion is in agreement with the findings of Nguyen et al. [17]
in which they reported great improvement in the level of alignment in the vicinity of the bundle. The combination of the rotation motion of the collector and translational motion of the dielectric films allows the electrified jet end to approach the collector at the edge of the films. However, while the high rotational speed produces more aligned fibers, translation speed that is too high may cause side effects because of the possibility of tilting the fibers. Therefore, a very high translational speed (10 or 20 mm/s) leads to a low level of alignment, as in experiments No.14, 15, and 27. Based on output data and analysis, the highest level of alignment can be obtained at C = 30 % wt, TCD = 11 cm, V = 10 kV, ω = 3000 rpm, δ = 5 mm, and τ = 5 mm/s. A bundle Fig. 4. The measurement system of (a) d31 value and (b) d33 value
Fig. 5. The relative impact of different parameters in the case of tar- geting to (a) (b) (c) fiber diameter and (d) fiber alignment level.
of PVDF fiber with these parameters and conditions shows an excellent level of alignment, as seen in Fig. 6.
3.2 Mechanical characterization
A single PVDF fiber fabricated using ES was reported to have a Young’s modulus of 2.2 GPa [24], which is much larger than that of a thin PDMS film in the range of several MPa [25], and even larger than the Young’s modulus of the human skin (0.42 to 0.85 MPa), for potential application in biomechanical-energy harvesting. The force data is acquired using a PCI-6281 multifunction I/O device (National Instruments, USA), and the cross-sectional area is measured with a scanning electron microscope (SEM) experiment. The stress-strain curve is presented in Fig. 7, with Young’s modulus value of 1.64 MPa. The stress-strain curve does not show the results for ultimate tensile strengths because of the limitations of the load sensor. However, an alternative experiment was conducted to measure the strain at fracture, and it recorded that the PVDF/PDMS composite started to crack at a strain of 80–100%, which is very attractive for a
highly flexible sensor (Fig. S8).
3.3 Piezoelectric and Force Sensitivity characterization
The piezoelectricity and force sensitivity are the two most essential characteristics for validating the performance of the fabricated composite. Since the 1960s, when PVDF was first reported to exhibit the piezoelectric phenomena, the piezoelectricity has been reported with an increasing coefficient because of the application of different fabrication techniques and more precise measurement methods. The keys to improving the piezoelectricity and the force sensitivity of PVDF monolithic fibers and PVDF fiber-based composite are directly related to the three most significant factors: (1) the percentage of β-phase crystallinity [26], (2) alignment of the polar phase corresponding to the alignment of the fibers [27, 28], and (3) the method of configuring the electrodes [4] collection of the generated signal.
The EpCA ES method offers much more effective results compared to other methods, such as NFES, because of the high voltage required for more extreme polarization (18 kV to 500 V), the large TCD for longer elongation distance (10 cm to 600 µm), and high speed of rotation (3000 rpm or 1.5 m/s for translation to static condition). The X-ray diffractometer (XRD) (D8 Advance, Bruker GMBH, Germany) experiment demonstrates that PVDF fibers fabricated using the EpCA ES method is composed mostly of the β-phase crystallinity at which one sharp peak of intensity was discovered at an angle of 20.8° (Fig. 8). The electrode configuration in the longitudinal direction produces less contact area than in the thickness direction, as described by Lei et al. [4].
However, the thickness mode described by Lei et al., and Chang et al. are limited by the extension force because of a weak bonding layer and a large difference in Young’s modulus among substrate (PET or ITO), PVDF fibers, and PDMS used as the matrix. Therefore, this kind of transversely isotropic PVDF/
PDMS composite is expected to have some properties that are superior to those of composite materials in the literature.
Fig. 6. The SEM micrograph of PVDF fibers fabricated under opti- mum conditions
Fig. 7. Stress-strain curve of the three PVDF/PDMS composite sam- ples
Fig. 8. X-ray diffraction spectrum of PVDF fibers. The spectrum reveals a high percentage of β-phase at a peak of 20.8°.
Thickness mode
The measurement in thickness mode or transverse normal loading condition is abbreviated to a 31-direction, where the 3- direction is the direction for collecting the charge, and the 1- direction is the applied direction of the force. The piezoelectric d31 value of PVDF monolithic fibers has been reported to be up to 23 pC/N [29]. The 14% volume fraction PVDF/PDMS composite can produce a closed value d31 value of 19 pC/N (Fig. 9a). The piezoelectric voltage constant g31 reaches 33 mV/N (Fig.9b).
Transverse mode
Under transverse loading condition, the 14% volume fraction of PVDF fiber composites shows a high piezoelectric constant d33 = 34 pC/N, which is more than half of the highest value reported by J. Pu et al. (57.6 pC/N) [30] (Fig. 9c). PVDF fibers must be integrated into the PDMS matrix to enhance the mechanical properties. Thus, reduction in piezoelectric performance is unavoidable. Force sensitivity in the transverse load condition is summarized in Fig. 9d. It was assumed that the fibers and matrix have perfect bonding under an elastic range. Thus, the PVDF fibers and the PDMS matrix are under equally uniform strain.
Therefore, when applied to a low Young’s modulus composite, a small amount of force is needed to generate strain in the longitudinal direction and is capable of producing higher sensitivity compared to other directions. Compared to the published reports in Table 4, the proposed prototype of PVDF/
PDMS shows a significant improvement in piezoelectric performance.
To further investigate the voltage output of the fabricated composite, we measured the voltage generated by an oscilloscope (Tektronix TDS 2014) without an amplification circuit. One end was actuated using a PZT-based bimorph while the other was fixed on the top (See Fig. S9). The 300 µm thick composite was
clamped in the vertical direction such that the sample was always in a pre-tensioned condition. Series of the same magnitude of actuation forces at 10, 20, 40, and 60 Hz were applied repeatedly.
Results show that the fabricated PVDF/PDMS composite has excellent piezoelectric voltage response to the impact signal, with outputs up to 190 mVpp at frequency f = 10 Hz, 170 mVpp at f
= 20 Hz, 160 mVpp at f = 40 Hz, and 142 mVpp at f = 60 Hz (Fig. 10). The output performance shows significant improvement compared to previously published studies [31-36] and shows promise for application in biomechanical energy harvesting devices and flexible sensors.
Fig. 9. The measurement data of piezoelectric charge and piezo- electric voltage constant
Fig. 10. Voltages generated under the same pressure in the axial load- ing direction at different frequencies: 10 Hz, 20 Hz, 40 Hz, and 60 Hz.
Table 4. Summary of reports on PVDF-based composite and PVDF monolithic fibers. NFES: Near-field Electrospinning, FFES: Far-field Electrospinning, CNT: Carbon Nanotube, N/A: Not available
Composite materials Fabrication
technique Vmax
PVDF/nanoclay [7] NFES 2.76 V
PVDF single [7] NFES 0.78 V
PVDF single [9] FFES 1 V
PVDF [8] NFES 86.9 mV
PVDF/PDMS [11] NEFS 150 mV
PVDF [10] NFES 30 mV
PVDF/CNT [15] NFES N/A
PVDF/CNT [38] NFES 2.26 mV/N
PVDF/PDMS [13] Mechano-ES 100 mV
Single PVDF fiber [31] ES 58.77 pC/N
P(VDF-TrFE) [39] FFES 60.5 mV/N
P(VDF-TrFE) [40] FFES 1.5 V
4. CONCLUSIONS
In this study, two L9 and L27 orthogonal arrays, along with a signal-to-noise ratio analysis using Taguchi’s method, were used to investigate the influence of processing parameters, including:
solution concentration (C), tip-to-collector distance (TCD), applied voltage (V), rotation speed (ω), open gap (δ), and translational speed (τ) of the dielectric film, on the morphology of PVDF fibers such as fiber diameter and fiber alignment.
Employing a robust procedure, one prototype of a flexible composite of well-aligned PVDF fibers with elastomer PDMS as the matrix constituent were fabricated and characterized using the designated experimental setups. A 300 µm thick composite of PVDF/PDMS can be elongated up to 80–100% strain. The piezoelectric charge constants d31 = 19 pC/N and d33 = 33 pC/N, and piezoelectric voltage coefficients g31 = 34 mV/N and g33 = 61.2 mV/N are the highest piezoelectric coefficients among piezoelectric polymer materials. A voltage of 190 mVpp at a frequency of 10 Hz was detected under longitudinal excitation condition, showing great potential for micro-energy harvesting applications. Furthermore, the fabricated composite has a low Young’s modulus of 1.64 MPa, which is equivalent to that of the human skin and can be embedded in biomechanical energy harvesting devices. Furthermore, it is expected that enhanced connectivity throughout the electrode area will facilitate the development of more sensitive sensors such as pressure sensors and acoustical underwater transducers.
ACKNOWLEDGMENT
This work was supported by a National Research Foundation of Korea (NRF) grant funded by the Korea Government (MSIP) (No.2012R1A1A2042543).
REFERENCES
[1] A. B. Amar, A. B. Kouki, Hung Cao, “Power Approaches for Implantable Medical Devices”, Sensors, Vol. 15, No. 11, pp. 28889-914, 2015.
[2] Y. Liu, H. Wang, W. Zhao, M. Zhang, H. Qin, and Y. Xie,
“Flexible, Stretchable Sensors for Wearable Health Mon- itoring: Sensing Mechanisms, Materials, Fabrication Strat- egies and Features”, Sensors, Vol. 18, No. 2, pp. 645(1)- 645(35), 2018.
[3] C. Chang, V. H. Tran, J. Wang, Y.-K. Fuh, and L. Lin,
“Direct-write piezoelectric polymeric nanogenerator with
high energy conversion efficiency”, Nano Lett., Vol. 10, No.
2, pp. 726-731, 2010.
[4] T. Lei, L. Yu, G. Zheng, L Wang, D. Wu, and D. Sun, “Elec- trospinning-induced preferred dipole orientation in PVDF fibers”, J. Mat. Sci., Vol. 50, No. 12, pp. 4342-4347, 2015.
[5] J. Hu, Y. Zhu, H. Zhang, Y. Gu, and X. Yang, “Mixed effect of main electrospinning parameters on the β-phase crys- tallinity of electrospun PVDF nanofibers”, Smart Mater.
Struct., Vol. 26, No. 8, pp. 085019(1)-085019(9), 2017.
[6] Y. Ding, Y. Duan, and Y. An Huang, “Electrohydrody- namically Printer, Flexible Energy Harvester Using In Situ Poled Piezoelectric Nanofibers”, Energy Technol., Vol. 3, No. 3, pp. 351-358, 2015.
[7] P. Martin, A.C. Lopes, and S. Lanceros-Mendez, “Elec- troactive phases of poly(vinylidene fluoride): Determina- tion, processing and applications”, Prog. Polym. Sci., Vol.
39, No. 4, pp. 683-706, 2014.
[8] L. Ruan, X. Yao, Y. Chang, L. Zhou, G. Qin, and X. Zhang,
“Properties and Applications of the β Phase Poly(vinylidene fluoride)”, Polymers, Vol. 10, No. 3, pp. 228(1)-228(27), 2018.
[9] L. S. Carnell, E. J. Siochi, R. A. Wincheski, N. M. Hol- loway, and R. L. Clark, “Electric field effects on fiber align- ment using an auxiliary electrode during electrospinning”, Scr. Mater., Vol. 60, No. 6, pp. 359-361, 2009.
[10] M. M. L. Arras, C. Grasl, H. Bergmeister, and H. Schima,
“Electrospinning of aligned fibers with adjustable orien- tation using auxiliary electrodes”, Sci. Technol. Adv. Mater., Vol. 13, No. 3, pp. 035008(1)-035008(8), 2012.
[11] Y. Ishii, H. Sakai, and H. Murata, “A new electrospinning method to control the number and a diameter of uniaxially aligned polymer fibers”, Mater. Lett., Vol. 62, No. 19, pp.
3370-3372, 2008.
[12] F. Dabirian, S. A. H. Ravandi, A. R. Pishevar and R. A.
Abuzade, “A comparative study of jet formation and nano- fiber alignment in electrospinning and electrocentrifugal spinning systems”. J. Electrostat., Vol. 69, No.6, pp. 540- 546, 2011.
[13] G. Zheng, W. Li, X. Wang, D. Wu, D. Sun, and L. Lin, “Pre- cision deposition of a nanofibre by near-field electrospin- ning”. J. Phys. D, Vol. 43, No. 41, pp. 415501(1)- 415501(6), 2010.
[14] J. Lee, S. Y. Lee, J. Jang, Y. H. Jeong, and D. W. Cho, “Fab- rication of patterned nanofibrous mats using direct-write electrospinning”, Langmuir, Vol. 28, No.18, pp. 7267-7275, 2012.
[15] P. Kiselev and J. Rosell-Llompart, “Highly aligned elec- trospun nanofibers by elimination of the whipping motion”, J. Appl. Polym. Sci., Vol. 125, No. 3, pp. 2433-2441, 2012.
[16] D. Sun, C. Chang, S. Li, and L. Lin, “Near-Field Elec- trospinning”, Nano Lett., Vol. 6, No. 4, pp.839-842, 2006.
[17] D.-N Nguyen, Y. Hwang, and W. Moon, “Electrospinning of well-aligned fiber bundles using an End-point Control Assembly method”, Eur. Polym. J., Vol.77, pp. 54-64, 2016.
[18] D.-N Nguyen, S. M. Yu, and W. Moon, “Electrospinning of poly(γ-benzyl-α,L-glutamate) microfibers for piezoelectric polymer applications”, J. Appl. Polym. Sci., Vol. 135, No.
27, p. 46440, 2018.
[19] A. Nazir, N. Khenoussi, L. Schacher, T. Hussain, and A. H.
Hekmati, “Using the Taguchi method to investigate the effect of different parameters on mean diameter and vari- ation in PA-6 nanofibres produced by needleless electro- spinning”, RSC Adv., Vol. 5, No. 94, pp. 76892-76897, 2015.
[20] C. M. Wu, C. Hsu, C. Su, C. Liu, and J. Lee, “Optimizing parameters for continuous electrospinning of polyacrylo- nitrile nanofibrous yarn using the Taguchi method”, J. Ind.
Text., Vol. 48, No. 3, pp. 559-579, 2017.
[21] R. K. Roy, Design of experiments using the Taguchi approach, John Wiley & Sons, New Jersey, USA, 2001.
[22] S. J. Tuck, M. K. Leach, Z. Feng, and J. M. Corey, “Critical variables in the alignment of electrospun PLLA nanofi- bers”, Mater. Sci. Eng. C, Vol. 32, No. 7, pp. 1779-1784, 2012.
[23] D. Farrar, K. Ren, D. Cheng, S. Kim, W. Moon, W. Wilson, J. E. West, and S. M. Yu, “Permanent polarity and piezo- electricity of electrospun alpha-helical poly(alpha-amino acid) fibers”, Adv Mater., Vol. 23, No. 34. pp. 3954-3968, 2011.
[24] S. Debarun, K. Prakash, S. H. Chen, J. M. Miao, C. Y.
Kwok, M. S. Triantafyllou, M. E. Warkiani, and M. Asad- nia, “Characterization of single polyvinylidene fluoride (PVDF) nanofiber for flow sensing applications”, AIP Adv., Vol. 7, No. 10, pp. 105205(1)-105205(7), 2017.
[25] M. Liu, J. Sun, Y. Sun, C. Bock, and Q. Chen, “Thickness- dependent mechanical properties of polydimethylsiloxane membranes”, J. Micromech. Microeng., Vol. 19, No. 3, pp.
035028(1)- 035028(4), 2009.
[26] Y. Xin, X. Qi, H. Tian, C. Guo, X. Li, J. Lin, and C. Wang,
“Full-fiber piezoelectric sensor by straight PVDF/nanoclay nanofibers”, Mater. Lett., Vol. 164, pp. 136-139, 2016.
[27] N. Shehata, E. Elnabawy, M. Abdelkader, A. H. Hassain, M. Salah, R. Nair, and S. A. Bhat, “Static-Aligned Piezo- electric Poly (Vinylidene Fluoride) Electrospun Nanofibers/
MWCNT Composite Membrane: Facile Method”, Poly- mers, Vol. 10, No.9, pp. 965(1)-965(11), 2018.
[28] A. Chinnappan, J. K. Y. Lee, W. A. D. M. Jayathilaka, and S. Ramakrishna, “Fabrication of MWCNT/Cu nanofibers via electrospinning method and analysis of their electrical conductivity by four-probe method”, Int. J. Hydrog. Energy, Vol. 43, No. 2, pp. 721-729, 2018.
[29] J. Nunes-Pereira, V. Sencadas, V. Correia, J. G. Rocha, and S. L. Mendez, “Energy harvesting performance of piezo- electric electrospun polymer fibers and polymer/ceramic composites”, Sens. Actuator A-Phys., Vol. 196, pp. 55-62, 2013.
[30] J. Pu, X. Yan, Y. Jiang, C. Chang, and L. Lin, “Piezoelectric actuation of direct-write electrospun fibers”, Sens. Actuator A-Phys., Vol. 164, No. 2, pp. 131-136, 2010.
[31] Z. Liu, C. Pan, Z. Ou, and W. Wang, “Piezoelectricity of Well-Aligned Electrospun Fiber Composites”, IEEE Sens.
J., Vol. 13, No. 10, pp. 4098-4103, 2013.
[32] H. Y. Son, J. S. Park, J. Huang, J. Kim, Y. S. Nam, and W.
S. Kim, “Flexible Fibrous Piezoelectric Sensors on Printed Silver Electrodes”, IEEE Trans. Nanotechnol., Vol. 13, No.
4, pp. 709-713, 2014.
[33] C. T. Pan, K. C. Tsai, S. Y. Wang, C. K. Yen, and Y. L. Lin,
“Large-Area Piezoelectric PVDF Fibers Fabricated by Near-Field Electrospinning with Multi-Spinneret Struc- tures”, Micromachines, Vol. 8, No. 4, pp. 97(1)-97(16), 2017.
[34] C. M. Wu, M. H. Chou, and W. Y. Zeng, “Piezoelectric Response of Aligned Electrospun Polyvinylidene Fluoride/
Carbon Nanotube Nanofibrous Membranes”, Nanomateri- als, Vol. 8, No. 6, pp. 420(1)-420(), 2018.
[35] G. Ren, F. Cai. B. Li, J. Zheng, and C. Xu, “Flexible Pres- sure Sensor Based on a Poly(VDF-TrFE) Nanofiber Web”, Macromol. Mater. Eng., Vol. 298, No. 5, pp. 541-546, 2013.
[36] L. Persano, C. Dagdeviren, Y. Su, Y. Zhang, S. Girardo, D.
Pisignano, Y. Huang, and J. A. Rogers, “High performance piezoelectric devices based on aligned arrays of nanofibers of poly(vinylidenefluoride-co-trifluoroethylene)”, Nat Com- mun., Vol. 4, pp. 1633(1)-1633(10), 2013.