Comparison of Bite Forces between Pre- and Post-Treatment in Patients with Temporomandibular Disorders
Sang-Il Lee, D.D.S., Ki-Suk Kim, D.D.S., M.S.D., Ph.D
Department of Oral Medicine, Dankook University School of Dentistry
The purpose of this study was to compare the maximum bite forces between pre- and post-treatment related to specific diagnostic groups of TMD including masticatory muscle disorder (MMD), disc derangement (DD), joint inflammation (JI) and osteoarthritis (OA).
Bite force between pre- and post-treatment was compared in 36 patients with unilateral TMD, successfully-managed in the Department of Oral Medicine, Dankook University Dental Hospital, for this study. The ratio of men to women was 7:29 and their mean age of 28.1±13.7 years. The patients were categorized, through clinical and radiographic examination, into aforementioned 4 groups; MMD (N=18), DD (N=6), JI (N=5) and OA (N=7). The maximum bite force measurements were done at the antagonizing canines and 1st molars using a bite force recorder. Paired t-test, ANOVA, Multiple Comparison t-tests were used for statistical analysis.
The results of this study showed that the maximum bite force before treatment increased after TMD treatment, which was noticeable at the canines (p=0.001 and p=0.000 for the affected and unaffected sides, respectively). In comparison related to the diagnostic groups of TMD, patients with osteoarthritis of TMJ exhibited the lowest strength while those with inflammatory disorder of TMJ had the highest strength on the affected sides. Increase of bite force after treatment was also found in each group. Significant difference between pre- and post-treatment was found at canines on the affected sides in MMD (p=0.045) and DD groups (p=0.009) while on the unaffected sides in OA group (p=0.003).
Conclusively, the reduced bite force due to TMD could be recovered by conservative TMD treatment and that the difference of bite forces between pre- and post-treatment was noticeable at the canines.
Key words : Temporomandibular disorders, Bite force, TMD
Corresponding author: Ki-Suk Kim
Department of Oral Medicine, Dankook University, School of Dentisty
Sinbu-dong San 7-1 Cheonan 330-716 Tel. 041-550-1914
Fax. 041-556-9665 E-mail. [email protected] Received: 2007-02-23 Accepted: 2007-04-11
*The present research was conducted by the research fund of Dankook University in 2005.
I. INTRODUCTION
Bite force is exerted by the jaw elevator muscles
and regulated by the nervous, muscular, skeletal
and dental systems1) and measurement of the
maximum bite force is an attempt to quantify the
total force of the jaw elevator muscles.
2)Patients
with pain or functional disturbance from
masticatory muscles and/or temoromandibular
joints (TMJs) has been reported to have lower
maximal bite force than healthy subjects.
3-5)Reduced bite force has been reported in patients
with TMD by several authors.
4,5)Hagberg
6)suggested that TMD patients use greater relative masticatory forces than normal subjects during chewing. On the contrary, the weakness of masticatory muscle has been considered to be a predisposing factor for TMD.
7)An increase in bite force up to normal levels has been reported with palliation of the symptoms during treatment.
8,9)Tzakis et al
10)demonstrated that masticatory function of the patients with TMD of mainly musclualr origin is compromised and that treatment including information about the disease and intraoral appliance had a positive effect on the masticatory function.
Bite force has often been used as a variable for objectively evaluating masticatory function.
11)However, in a study by Hagberg et al,
12)no significant difference could be found between the maximum bite forces for the healthy women controls and in female patients with objective muscular pain in the masseter muscles. One reason for this discrepancy in results could be that other investigators has included affections of TMJs in their patients materials.
3,4,13)It should be kept in mind that TMD is heterogeneous disorders embracing a number of clinical problems involving masticatory musculatures, temporomandibular joint (TMJ) and associated structures.
14)In addition, Ikebe et al
11)failed to find an association of TMD with bite force and they explained this discrepancy by that a major contributing factor to TMD in their patients was not pain but TMJ noise or mouth opening limitation.
Thus, the purpose of this study was to compare
Dx group MMD DD JI OA Total
N 18 6 5 7 36
M:F 4:14 2:4 1:4 0:7 7:29
Age (yrs) 21.0 ± 12.2 24.8 ± 8.8 40.8 ± 14.7 33.4 ± 19.0 28.1 ± 13.7 MMD: masticatory muscle disorder, DD: disc derangement, JI: joint inflammation,
OA: osteoarthritis
Table 1. Age and sex distribution of the patients with unilateral TMD.
the maximum bite force between pre- and post- treatment related to specific diagnostic groups of TMD including masticatory muscle disorder, disc derangement, joint inflammation and osteoarthritis.
Ⅱ. MATERIALS AND METHODS
1. Subjects
Out of the patients with unilateral TMD from the Department of Oral Medicine, Dankook University Dental Hospital, 36 patients successfully-managed were selected for this study. None of them had any serious systemic illness. Excluded were those with any dental condition which could deteriorate bite force (i.e., severe tooth and periodontal disease, dental implant and large prosthesis of more than a three-unit bridge). Ratio of male to female was 7:29 and their mean age was 28.1±13.7 years.
After taking a comprehensive history and perfor-
ming extensive clinical and radiographic examina-
tions, all subjects were assigned to four diagnostic
sub-groups; masticatory muscle disorders (MMD
group), disc derangement (DD group), joint
inflammation (JI group) and osteoarthritis (OA
group). The group with disc derangement of TMJ
included patients diagnosed as disc derangement
with or without reduction. Those with capsulitis or
retrodiscitis of the TMJ were categorized into JI
group. Demographics for all subjects are presented
in Table 1 and all the measurement of bite force
were done after receiving informed consent.
2. Measurement of the bite force
The maximum bite force of each subject was measured at antagonizing canines and 1st molars on the right and left sides, with a bite force recorder (SG 2001-1, Seokwang Co., Korea) designed to be used for single pairs of antagonizing teeth. Each subject was sit in upright position with neck support. After being asked to bite lightly for several times in order to be familiar with the recorder interposed the teeth to be measured, the subject was instructed to clench and increase the force successively to the maximum strength not until pain was felt, which required to be lasted for three seconds.
15)The bite force of the canines was measured on the affected and unaffected side, respectively, followed by measurement at 1st molars. The measurement was done twice on each pair of teeth with an interval of three minutes to lessen muscle fatigue as possible. The whole measurement before treatment was performed during TMJ examination at the first visit of each patient. Variable conservative therapeutic modalities were given to them, which included behavioral modification, pharmacological therapy, physical therapy and exercise, and occlusal splint therapy. None of them were involved with any irreversible therapy such as prosthestic, orthodontic and surgical treatment. The same measurement procedures were repeated after complete or substantial relief of their signs and
Canines 1st molars
Affected side (mean ± SD)
Unaffected side (mean ± SD)
Affected side (mean ± SD)
Unaffected side (mean ± SD)
Pre-Tx N=36 60.62 ± 23.48 63.32 ± 22.11 83.47 ± 16.99 84.70 ± 20.39
Post-Tx N=36 70.02 ± 19.92 72.32 ± 18.56 88.90 ± 16.25 88.16 ± 13.37
Paired t-test p=0.001 p=0.000 p=0.081 p=0.228
(Unit : kg force) Table 2. Comparison of the maximum bite forces between pre- and post-treatment.
symptoms.
Comparison of the maximum bite force between pre- and post-treatment was performed with Paired t-test. ANOVA and Multiple Comparison t-tests were used to investigate any difference of the mean values and its changes correlated with diagnostic sub-groups and therapeutic effect.
Ⅲ. RESULTS
Table 2 shows the maximum bite force between
antagonizing canines and 1st molars in our subjects
having unilateral TMD. The maximum bite force
between canines obtained before treatment was
60.62±23.48 kg force on the affected sides and
63.32±22.11 kg force on the unaffected ones, which
changed, after treatment, into 70.02±19.92 kg force
and 72.32±18.56 kg force, respectively. Comparison
of the bite forces between pre- and post-treatment,
the maximum bite force at the first visit
significantly increased on the affected as well as
the unaffected sides (p=0.001 and p=0.000,
respectively, Table 2). While the maximum bite
force between antagonizing 1st molars before
treatment was 83.47±16.99 kg force on the affected
sides and 84.70±20.39 kg force on the unaffected,
symptom-free sides, the values after treatment was
88.90±16.25 kg force and 88.16±13.37 kg force,
respectively. The maximum bite force of 1st molars
also increased on the both sides after successful
treatment, though there was no significant
difference between pre- and post-treatment (p=0.081 and p=0.228, respectively, Table 2).
Table 3 exhibits the maximum bite forces of the canines in each diagnostic group in TMD. There was a tendency of difference in the bite forces among MMD, DD, JI and OA groups before treatment on the affected and unaffected sides, respectively (p=0.080 and p=0.069) but significant difference was not found. On the affected sides, the bite force of OA group was the lowest and that of JI group was the highest, exhibiting significant difference between them (p=0.012). The bite force on the unaffected sides was also significantly lower in OA compared with each of other three groups (p=0.034 between OA and MMD, p=0.046 between OA and DD, and p=0.018 between OA and JI). The
Diagnostic groups ANOVA
MMD DD JI OA
Pre-Tx Affected 61.62 ± 23.92 63.48 ± 15.74 77.76 ± 25.35
a43.33 ± 18.83
ap=0.080 Unaffected 65.33 ± 18.78
b68.85 ± 13.23
c75.26 ± 30.16
d44.87 ± 23.29
b,c,dp=0.069
Post-Tx Affected 70.78 ± 19.80 70.93 ± 14.33 81.00 ± 21.82 59.46 ± 21.95 p=0.327 Unaffected 70.86 ± 16.41 70.85 ± 17.62 85.22 ± 25.68 68.11 ± 19.50 p=0.418 MMD: masticatory muscle disorder, DD: disc derangement, JI: joint inflammation, (Unit : kg force) OA: osteoarthritis.
Significant difference existed between the same alphabets in multiple comparison t-test (p<0.05).
Table 3. The maximum bite force of canines in the diagnostic groups.
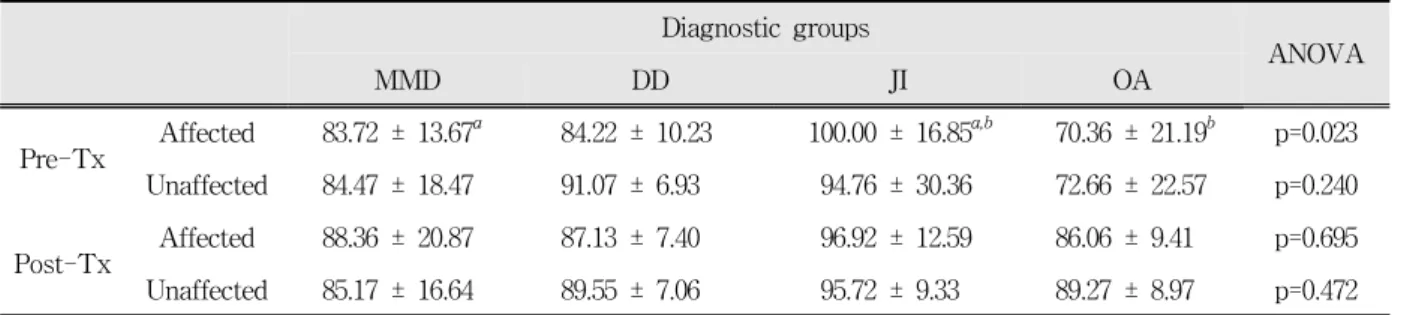
Diagnostic groups
ANOVA
MMD DD JI OA
Pre-Tx Affected 83.72 ± 13.67
a84.22 ± 10.23 100.00 ± 16.85
a,b70.36 ± 21.19
bp=0.023 Unaffected 84.47 ± 18.47 91.07 ± 6.93 94.76 ± 30.36 72.66 ± 22.57 p=0.240
Post-Tx Affected 88.36 ± 20.87 87.13 ± 7.40 96.92 ± 12.59 86.06 ± 9.41 p=0.695 Unaffected 85.17 ± 16.64 89.55 ± 7.06 95.72 ± 9.33 89.27 ± 8.97 p=0.472 MMD: masticatory muscle disorder, DD: disc derangement, JI: joint inflammation, (Unit : kg force) OA: osteoarthritis.
Significant difference existed between the same alphabets in multiple comparison t-test (p<0.05).
Table 4. The maximum bite force of 1st molars in the diagnostic groups.
maximum bite forces obtained after treatment didn’t show any significant difference among the four sub-diagnostic groups on the affected sides (p=0.327), nor the unaffected sides (p=0.418).
The maximum bite force of the 1st molars in the diagnostic groups was indicated in Table 3 and significant difference exists only on the affected sides before treatment (p=0.023). JI group had the highest bite force of 100.00±16.85 kg force, exhibiting significant difference as compared with that in MMD (p=0.044) and OA (p=0.002) groups, respectively.
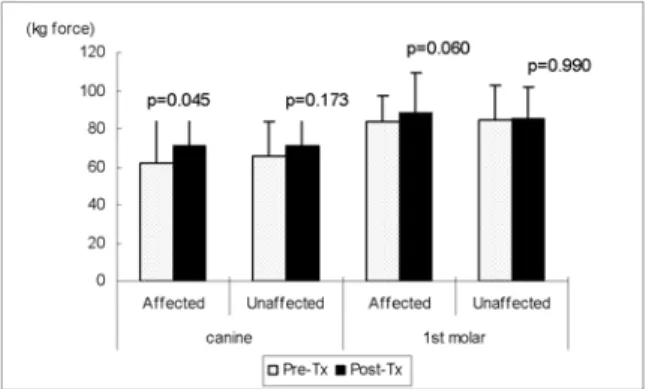
Fig 1 to 4 represents changes in the maximum
bite force before and after treatment in each
diagnostic group. The bite force in the MMD group
was significantly increased after treatment
particularly at the canines on the affected side (p=0.045) and this change was also seen at the 1st molars on the affected sides although they showed weak significance (p=0.060, Fig. 1). In the subjects with DD, significant increase of bite force related with treatment was found only on the canines of the affected sides (p=0.009, Fig. 2) and joint inflammation group showed increase in bite force of the canines of the unaffected sides with weak significant difference (p=0.098, Fig. 3). The maximum bite force in OA group was noticeably increased after treatment but significant difference existed only at the canines of the unaffected sides (p=0.003). The difference of bite force measured between the 1st molars showed weak significance
Fig. 1. Comparison of the maximum bite force between pre- and post-treatment in the masticatory muscle disorder group.
Fig. 2. Comparison of the maximum bite force between pre- and post-treatment in the disc derangement group.
(p=0.058 and p=0.060 for the affected and unaffected
sides, respectively, Fig. 4).
Ⅳ. DISCUSSION
A close correlation between bite force and masticatory efficiency has been found in several studies.
16)Most of the patients with TMD appear to have unsatisfactory masticatory function and compromised values of masticatory efficiency and bite force.
16)Bite force endurance, on a submaximal level, has been found to increase after treatment in TMD patients.
17)Comparison of the maximum bite force between pre- and post-treatment in this study showed
Fig. 3. Comparison of the maximum bite force between pre- and post-treatment in the joint inflammation group.
Fig. 4. Comparison of the maximum bite force between pre- and post-treatment in the osteoarthritis group.
increased the bite force after complete and
substantial relief of TMD, which is in agreement
this study, the bite force of the canines was significantly increased after treatment on the affected and unaffected sides (p=0.001 and 0.000, respectively Table 2). At the 1st molars on the affected sides, the reduced strength of 83.47±16.99 kg force before treatment was recovered to 88.90±16.25 kg force after treatment even though they showed lack of positive significant difference (p=0.081, Table 3). These findings indicate that the bite force exerted by anterior teeth was more deteriorated compared that of posterior teeth. It might be due to the fact that the bite force between 1st molars needs activation of more muscles than canine does. It is, therefore, likely that one or more deteriorated muscles are compensated by other muscles in the molar region. In addition to it, lever system of mandible is more efficient in the 1st molar than in the canines.
14)Review of studies demonstrated that individuals with various TMD were reported to show a decrease in bite force,
18,19)but this has not been found by others.20) These conflicting findings may, in part, resulted from that TMD comprises various clinical problems involving masticatory musculatures, TMJ and associated structures.
Thus, this study compared any difference in the maximum bite force related to the specific diagnostic groups of TMD. When the subjects were categorized into MMD, DD, JI and OA, all the groups showed increased bite force after treatment but significant difference among the groups was found only at the 1st molars on the affected side (p=0.023, Table 3). The subjects with inflammatory disorders of TMJ showed the highest bite force of 100.00±16.85 kg force, exhibiting significant difference as compared with that in MMD (p=0.044) and OA (p=0.002) groups, respectively. Bite force at the canines before treatment showed a tendency of difference among MMD, DD, JI and OA groups although significant difference was weak (p=0.080 and p=0.069 for the affected and unaffected sides, respectively). The maximum strength from both canines and 1st molars was the highest in JI group, which was noticeable on the affected side. The
higher bite force on the affected sides is thought to be that the bite force recorder placed between the teeth of the subjects functioned as a separator, possibly leading to exertion of the maximum force without eliciting pain of TMJ by avoiding joint load.
On the while, OA group showed the lowest in its strength, possibly being explained by pain and orthopedic instability of the TMJ due to structural changes in the subarticular bone of the condyle fossa such as flattening, osteophytes, and erosions.
In a study on masticatory functions in patients with juvenile rheumatoid arthritis, Harper et al
21)observed altered chewing performance which supported the use of a pain avoidance mechanism during chewing. Pain conditions affecting the TMJ may be associated with a “splinting” reaction, which may serve to limit jaw movements, and with peripheral and central sensitization contributing to the pain.
22)Experimental TMJ pain elicited by pressure has been reported to reduce jaw-elevator activity during chewing
23)and patients with TMD have generally longer duration of chewing cycles and lower bite force.
5,24)In a study concerning the patients with TMJ pain, Handsottir and Bakke
25)observed that the maximum bite force was positively correlated with the patient’s TMJ PPT (pressure pain threshold).
Increase of bite force after treatment was also found in all the groups, which demonstrate that bite force can be affected not only from pain (affecting TMJ or masticatory muscles) but also from functional disturbances or otheopedic instability.
However, Bonjardim et al
26)indicated that dysfunction index (DI) of Helkimo’s was not correlated with the bite force and that pain in the masticatory muscles prevented the patients from exerting maximum bite force. On the while, Sato et al
28)showed significantly decreased chewing ability in the patients with disc derangement of TMJ as compared with the normal subjects.
However, due to the lack of number in subjects,
the difference among diagnostic groups can not be
positively ascertained in this study. In order to
understand the difference among the sub-groups of TMD better, there is a need for a clinical study in a large population with TMD. Various pain intensity and muscles involved of the subjects would be concerned as well.
V. CONCLUSIONS
Based on these findings, it is assumed that pain and orthopedic instability due to TMD can deteriorate bite force, possibly leading to functional disturbance of mastication. This study also showed that the reduced bite force due to TMD could be recovered by successful conservative TMD treatment and that the difference of bite forces between pre- and post-treatment was noticeable at the canines.
REFERENCES
1. Ow RK, Carlsson GE, Jemt T. Biting forces in patients with craniomandibular disorders. Cranio 1989;7:119-125.
2. Wang K, Arima T, Arendt-Nielson L, Svensson P.
EMG-force relationships are influenced by experimental jaw-muscle pain. J Oral Rehabil 2000;
27:394-402.
3. Hagberg C. Assessment of bite force: A review. J Craniomandib Dis 1987;1:162-169.
4. Helkimo E, Carlssson GE, Carmeli Y. Bite force in patients with functional disturbances of the masticatory system. J Oral Rehabil 1975;2:397-406.
5. Molin C. Vertical isometric muscle forces of the mandible. A comparative study of subjects with and without manifest mandibular pain dysfunction syndrome. Acta Odontol Scand. 1972;30:485-499.
6. Hagberg C. Electromyography and bite force studies of muscular function and dysfunction in masticatory muscles. Swed Dent J 1986;37:1-64.
7. Sheikholeslam A, Moller E, Lous I. Pain, tenderness and strength of human mandibular elevators. Scand J Dent Res 1980;88:60-66.
8. Helkimo E, Carlsson GE, Helkimo M. Bite force and state of dentition. Acta Odontol Scand 1988;35:
297-303.
9. Sinn DP, de Assis EA, Throckmorton GS. Mandibular excursions and maximum bite forces in patients with
temporomandibular joint disorders. J Oral Maxillofac Surg 1996;54:671-679.
10. Tzakis MG., Dahlström L, Haraldson T. Evaluation of masticatory function before and after treatment in patients with craniomandibular disorders. J Cranio- mandib Disord Facial Oral Pain 1992;6:267-272.
11. Ikebe K, Nobuki T, Morii K, Kashiwagi J, Furuya M.
Association of bite force with ageing and occlusal support in older adults. J Dent 2005;33:131-137.
12. Hagberg C, Agerberg G, Hagberg M. Discomfort and bite force in painful masseter muscles after intramusclular injections of local anesthetics and saline solution. J Prosthet Dent 1986;56:354-358.
13. Manns A, Miralles R, Palazzi C. EMG, bite force and elongation of the masseter muscle under isometric voluntary contraction and variations of vertical dimension. J Prosthet Dent 1979;42:674-682.
14. Okeson JP. Management of Temporomandibular Disorders and Occlusion. 5th ed., St. Louis, 2003, Mosby, pp.191-244.
15. Lee WJ, Kim ME, Kim KS. Evaluation of the bite force in patients with unilateral temporomandibular disorders. Korean J Oral Med 2006;31:347-354.
16. Carlsson GE. Bite force and chewing efficiency, in Kawamura Y (Ed). Frontiers of Oral Physiology:
Physiology of mastication. Vol 1. Basel, 1974, Karger, pp. 265-292.
17. Choy E, Kydd LW. Bite force duration: A diagnostic procedure for mandibular dysfunction. J Prosthet Dent 1988;60:365-368.
18. Tortopidis D, Lyons MF, Baxendale RH. Bite force, endurance and masseter muscle fatigue in healthy edentulous subjects and those with TMD. J Oral Rehabil 1999;26:321-328.
19. Svensson P. Arendt-Nielsen L, Houe L. Muscle pain modulates mastication: an experimental study in humans. J Orofacial Pain 1998;12:7-16.
20. Lyons MF, Baxendale RH. Masseter muscle relaxation rate in volunteers with a myogenous craniomandibular disorders. J Oral Rehabil 1995;22:
355-364.
21. Harper RP, Brown CM, Triplett MM, Villasenor A, Gatchel RJ. Masticatory function in patients with Juvenile Rheumatoid Arthritis. Pediatric Dentistry 2000;22:200-206.
22. Sessle BJ. The neural basis of temporomandibular joint and masticatory muscle pain. J Orofac Pain 1999;13:238-245.
23. Svensson P, Arendt-Nielsen L, Houe L. Sensory
-motor interactions of human experimental unilateral jaw muscle pain: A quantitative analysis. Pain 1996;64:241-249.
24. Møller E, Sheikholeslam A, Lous I. Response of elevator activity during mastication to treatment of functional disorders. Scand J Dent Res 1984;92:64-83.
25. Hansdottir R, Bakke M. Joint tenderness, jaw opening, chewing velocity, and bite force in patients with temporomandibular pain and matched healthy control subjects. J Orofac Pain 2004;18:108-113.
국문요약
측두하악장애 환자의 치료 전후 교합력 비교