753 http://dx.doi.org/10.9713/kcer.2016.54.6.753
PISSN 0304-128X, EISSN 2233-9558
Optimization and Evaluation of Organic Acid Recovery from Kraft Black Liquor Using Liquid-Liquid Extraction
Hee Sun Kwon and Byung Hwan Um†
Department of Chemical Engineering and Interagency Convergence Energy on New Biomass Industry, Hankyong National University, 327, Jungang-ro, Anseong, Gyeonggi, 17579, Korea
(Received 28 July 2016; Received in revised form 29 August 2016; accepted 30 August 2016)
Abstract − Liquid-liquid extraction (LLE) can be used for the recovery of acetic acid from black liquor prior to bioeth- anol fermentation. Recovery of value-added chemicals such as acetic-, formic- and lactic acid using LLE from Kraft black liquor was studied. Acetic acid and formic acid have been reported to be strong inhibitors in fermentation. The study elucidates the effect of three reaction parameters: pH (0.5~3.5), temperature (25~65oC), and reaction time (24~48 min).
Extraction performance using tri-n-octylphosphine oxide as the extractant was evaluated. The maximum acetic acid con- centration achieved from hydrolyzates was 69.87% at 25°C, pH= 0.5, and 36 min. Factorial design was used to study the effects of pH, temperature, and reaction time on the maximum inhibitor extraction yield after LLE. The maximum potential extraction yield of acetic acid was 70.4% at 25.8°C, pH=0.6 and 37.2 min residence time.
Key words: Liquid-liquid extraction, Black liquor, Tri-n-octylphosphine oxide (TOPO), Response surface methodology (RSM)
1. Introduction
The emerging bio-based economy, including biorefining, is a very promising sector, with significant future potential and many business opportunities [1]. There are many different definitions of the word
“biorefinery,” but the term is generally applied to the use of renew- able raw materials (e.g,, biomass) to produce energy, together with a wide range of everyday commodities, in an economic and sustain- able manner [2-5]. The biorefinery concept applies the methods that have been used to refine petroleum to biomass conversion [3]. Biore- fineries simultaneously produce biofuels, biobased chemicals, heat, and power. Biorefining is regarded as a very promising route to meeting our aims for sustained prosperity and preserving the envi- ronment. Unlike oil refineries, which are units of large industrial size, biorefineries can include facilities of various sizes [6].
Renewable sources of energy are required for sustainable develop- ment of our society [7]. Plant biomass is the main source of renew- able materials and represents a potential source of renewable energy.
However, the main source of bioethanol currently used (starch from cereal seeds) is too expensive and of limited availability. In contrast, cellulose is available in high quantities at very low cost (as forest, agricultural, or industrial lignocellulosic wastes and cultures) and, after some current barriers are overcome, could be a widely avail- able and inexpensive bioethanol source in the future [2,8]. Figure 1 presents a simplified block diagram representing the process flow of
a pulp-mill-based biorefinery that co-produces pulp with lignin, fer- mentable sugars, and extracted products from fractionated waste- pulping liquor.
This work focuses on black liquor, which is the waste liquor obtained after pulping is complete in the Kraft process; the liquid consists of dissolved organic material, inorganic compounds (NaOH and Na2S), and spent cooking chemicals [9]. Standardized methods for the analysis of individual components (e.g., sugars, and lignin) of black liquor involve acidic hydrolysis of the black liquor with sulfu- ric acid, followed by gravimetric determination of lignin and chro- matographic determination of sugars. In this work, 18 degradation chemicals were identified and quantified in the hydrolyzates result- ing from acid hydrolysis of black liquor. During acid hydrolysis, the high temperature and pressure of the steam facilitate the conversion of acetyl groups on the xylan backbone to acetic acid. This released acetic acid enhances the hydrolysis and dehydration reactions that change xylan to oligomeric and molecular xylose, and change furfu- ral and hexose to hydroxymethylfurfural (HMF).
Acetic acid is ubiquitous in hemicellulose hydrolyzates, in which hemicellulose and, to some extent, lignin are acetylated [10,11]. The inhibitory effect of acetic acid (pKa = 4.75 at 25oC) in microbial fer- mentation is strongly affected by pH. When the hydrolyzate pH is lower than 4.75, the protonated form of acetic acid is dominant in the solution. Although the effect of acetic acid can be reduced by con- ducting the bioconversion at high pH (above or around 6.0), fermen- tation at this neutral pH can be suboptimal. Because acetic acid is also of value in the chemical market, it is beneficial to recover it prior to fermentation.
The separation of acetic acid from its aqueous solution by simple rectification is very difficult, and requires a column with many stages
†To whom correspondence should be addressed.
E-mail: [email protected]
This is an Open-Access article distributed under the terms of the Creative Com- mons Attribution Non-Commercial License (http://creativecommons.org/licenses/by- nc/3.0) which permits unrestricted non-commercial use, distribution, and reproduc- tion in any medium, provided the original work is properly cited.
and a high reflux ratio, incurring high running cost [12,13]. Studies have shown that a solvent can successfully extract acetic acid from an aqueous solution to an organic phase by liquid-liquid extraction (LLE) [14]. The partition coefficients for these systems vary between 3 and 5 [14-17]. Senol [16] deduced a molar loading of greater than one for carboxylic acids removal from water by alamine 336 in halo- genated hydrocarbon diluents. The use of tri-n-ctylphosphine oxide (TOPO) as an extractant for the removal of fatty acids from aqueous solutions has been discussed in several papers [15,18-25]. Because of its high hydrogen-bonding acceptor basicity, TOPO complexes strongly with a carboxylic acid in an organic phase, enhancing the transfer of the carboxylic acid to the extract phase. In addition, TOPO has excellent stability, a high boiling point, and low solubility in water.
It was concluded that an optimized use of TOPO will enable eco- nomic organic acid recovery.
The purpose of this study was to gain a more accurate understanding of the effect of residence time, temperature and pH on the extraction yields of organic acids LLE to enable overall process optimization.
In addition, response surface methodology (RSM) analysis was per-
formed the initial studies and the LLE conditions for organic acid production were optimized.
2. Materials and Methods
2-1. Raw materials
The Kraft black liquor used in this study was supplied by the Moorim P & P Co., Ltd. (Ulsan, Korea). The pH was 13~14 and it con- tained most of the original inorganic cooking elements the dissolved degraded wood particles. The latter included an extremely complex mixture of acetic acid, formic acid, saccharinic acids, numerous other carboxylic acids (all as sodium salts), dissolved hemicellulo- ses (mainly xylan), methanol, and hundreds of other components.
In addition, the black liquor contained large amounts of lignin phe- nolic compounds.
2-2. Acid hydrolysis of black liquor
The pH of values the black liquor samples, initially 13, was adjusted to a series of values in the range 0.5 to 3, using 96% sulfuric acid. A 1 L Fig. 1. Representing the flow of a black liquor utilization in a bio-refinery plant producing wood pulp, fermentation-derived alcohol and value-
added chemicals.
beaker was used to contain the black liquor, with a working volume of 100 mL. An autoclave was used at a temperature of 121oC for 60 min at the corresponding water vapor pressure. The autoclave was then heated to the desired temperature and held at this temperature for the desired reaction period. The resulting liquid was decanted and a por- tion was filtered using a Büchner funnel. The liquid hydrolyzate was immediately centrifuged at 15 000 rpm for 20 min to settle the solid residue. Aliquots (1 mL) were withdrawn from the micro-tube and then filtered with a 0.45 µm syringe filter (Whatman). The composition of the hydrolyzed black liquor was determined by high performance liquid chromatography (HPLC) and ultra-fast liquid chromatography (UFLC). The composition of the black liquor was analyzed accord- ing to the NREL Chemical Analysis & Testing Standard Procedures in NREL/TP-510-42623 [26]. The theoretical concentration of the composition of the liquor is shown in Table 1.
2-3. Extractant preparation
TOPO (93% purity; CYTEC, Inc., Woodland Park, NJ, USA) was diluted with an alkane (>99% purity; Sigma Aldrich, St. Louis, MO, USA); at a diluent ratio of 37% (w/w), and heated to 60oC to dissolve the TOPO.
2-4. Liquid to liquid extraction experiments
In a typical extraction procedure, 50 ml centrifuge tubes were charged with equal volumes (10 mL) of the organic phase and aqueous solution.
Batch extraction was performed by vigorously shaking the vessels for 6s, followed by 24~48 min in a thermostated water bath at 25~65oC, during which the shaking was repeated six times. The sample was then centrifuged at 4000 rpm for 4 min to assist separation of the two phases. Samples of both phases were analyzed immediately after phase separation.
2-5. HPLC and UFLC-XR
The sugars, organic acids, and furans components were analyzed using a high-performance liquid chromatograph equipped with refrac- tive index (RI) and ultraviolet (UV) detectors (Shimadzu, Columbia, MD, USA), and an Aminex HPX-87H column (Bio-Rad, Hercules, CA, USA). The column was operated with a 5 mM sulfuric acid mobile phase, at a flow rate of 0.6 mL/min and oven temperature of 60oC.
The samples were filtered through 0.25 μm poly (tetrafluoroethylene) syringe filters prior to injection. All the sugar peaks were detected
based on the RIs and UV absorption, identified, and quantified by comparison with the retention times of authentic standards. The Bio- Rad Aminex HPX-87H analytical column enabled concurrent analy- ses of sugar degradation products and organic acids in the liquid sample. The carbohydrate standard used for calibration contained sugars and some organic acids.
A UFLC-XR system consisting of a liquid chromatograph (LC- 20AT, Shimadzu Corp., Kyoto, Japan) fitted with a Kenetex reverse phase C18 (150 mm × 4.6 mm) column (Phenomenex, USA) was used for analyzing sugar and lignin degradation products. The col- umn was maintained at 40oC. A gradient mixture of 0.05% phos- phoric acid in water/acetonitrile was used as the mobile phase at a flow rate of 1 mL/min. The system was used to identify 18 potential decomposition chemicals from the black liquor.
2-6. Extraction yield percent (%)
[HAc] is the acetic acid concentration; subscript “org” denotes the acid concentration extracted from the aqueous phase into the organic phase; and subscript “aq” denotes the acid concentration remaining in the aqueous phase. An alternative means of expressing extraction efficiency is the percentage extraction. The percentage extraction is defined as the fraction of acetic acid removed from the aqueous phase into the organic phase in one extraction step, as shown in Eq. 1.
% Extraction yield = (1−([HAc]remaining aq/[HAc]initial aq)] ×100 (1)
2-7. Response surface methodology (RSM) experimental design
The optimal conditions were determined and the interactions among the environmental variables were evaluated using the Box-Behnken model in an RSM study. Three independent variables (pH, tempera- ture, and residence time) were selected. Table 2 shows the actual lev- els and corresponding codes for the process variables. Seventeen sets of treatment combinations were analyzed using design expert statisti- cal software (version 7.0.0, STAT-EASE Inc., Minneapolis, MN, USA).
Table 2. Factors and their levels for Box-Behnken design Variable Symbol Coded factor level
−1 0 1
pH A 0.5 2.0 3.5
Temperature (oC) B 25 45 65
Reaction time (min) C 24 36 48
Table 1. Composition black liquor hydrolyzates obtained by acid hydrolysis
Entry pH
Chemical composition(g/L)
Sugar Aliphatic acid Aromatic acid Aldehyde
Glu Xyl Ara D-LA DL-LA AA FA FUA MMA GA VA 2-FUA 4-HA Fur SA
1 0.5 0.89 10.32 0.26 5.62 1.82 10.29 4.89 - 1.14 0.02 0.08 0.33 0.02 0.08 0.04
2 2 0.57 0.58 0.15 6.07 1.57 10.03 5.31 - 0.93 0.01 0.04 0.15 0.01 - 0.02
3 3.5 0.54 0.46 0.15 5.57 0.09 10.56 5.35 - 0.78 0.01 0.05 0.16 0.01 - 0.02
*All experiments were carried out at 121°C, for 60 min in an autoclave
*Glu: glucose, Xyl: xylose, Ara: arabinose, D-LA: D-lactic acid, DL-LA: DL-lactic acid, AA: acetic acid, FA: formic acid, FUA:fumaric acid, MMA: methyl malonic acid, GC: gallic acid, VA: vanillic acid, 2-FUA: 2-furoic acid, 4-HA: 4-hydroxybenzoic acid, Fur : furfural, SA: syringaldehyde
Linear and second-order polynomials were used to fit the experimental data obtained. The adequacy of the model was tested using the sequen- tial F-test, lack-of-fit test, and other adequacy measurements. If the response varied in a polynomial manner, it was represented using the following polynomial function Eq. 2:
Y = a0 + a1x1 + a2x2 + a3x3 + a11x21 + a22x22 + a33x23 + a12x1x2
+ a13x1x3 + a23x2x3 (2)
However, if there was a curvature in the system, a higher order polynomial-like quadratic model was used, represented Eq. 3 by
Y = a0 + a1x1 + a2x2 + a3x3 + a11x21 + a22x22 + a33x23 + a12x1x2
+ a13x1x3 + a23x2x3 (3)
where Y is the predicted response (i.e., formic acid, lactic acid, and acetic acid extraction yields), xi are the variables, and ai are the model coefficient parameters. Subscripts 1, 2, and 3 refer to the pH, temperature, and reaction time, respectively.
3. Results and Discussion
3-1. Degradation chemicals as function of pH
Eighteen lignocellulosic degradation products were quantified in the hydrolyzates by HPLC and UFLC-XR analysis. The compounds monitored included aliphatic acids, aromatic acids and aldehydes.
This broad range of compounds was selected because of the previous identification of these analytes as potential inhibitors from biomass [11]. A comprehensive compilation of the observed degradation product concentrations is given in Table 1. Treatment of black liquor with sulfuric acid was performed in triplicate. Two major sugar com- ponents, glucose and xylose, dominated the carbohydrate composition of the hydrolyzates. The concentrations of the degradation products produced during acid hydrolysis were generally pH dependent. The complexity of the hydrolyzates and scope of the present study make it difficult to interpret and discuss the complete data set in detail;
however, we offer some general observations on the findings. For example, the concentrations of sugars, acids, and furans showed higher for black liquor hydrolyzed at low pH. When hemicellulose is degraded, multiple sugars are liberated (e.g., xylose, and glucose).
Aldehydes are directly formed in high concentrations by degrada- tion of sugars. Understanding the various formation and accumula- tion trends of furans is particularly relevant as these compounds are known to have significant inhibitory effects [27]. Phenolic compounds derived from lignin are also potentially harmful to fermentation opera- tions. From these data, it is clear that inhibitory furans are produced most abundantly at low pH, suggesting that higher pH acid hydroly- sis could be used to limit production of these compounds [27].
Here are the results of the production of sugars, acids, and lignin in acid hydrolysis of black liquor. Hydrolysis released significant amounts of xylose from hemicellulose. The sugar and inhibitor con- centration increased with decreasing pH. The maximum concentra- tion of xylose, 10.32 g/L was obtained at pH=0.5 for 60 min at 121oC.
Table 1 shows that the concentration of sugars at pH 0.5 was twenty times higher than those at pH 2. Monosaccharaides were apparently not formed above pH 2. The trend was for the amount of the total sugars (glucose + xylose + arabinose) to increase with decreasing pH.
One of the more relevant aliphatic acids produced during acid hydrolysis is acetic acid. Its relevance arises from its economic value as a useful commercial product and its tendency to be a strong inhibitor of microbial ethanol production. As the data in Table 1 show, acetic acid was produced in significant quantities (10 g/L) under all condi- tions. It was also observed that acetic acid was produced in higher quantities than were other acids. Significant amounts of lactic acid and formic acid were also formed through degradation of the extracted carbohydrates.
Table 1 shows that the amounts of lactic acid, formic acid, and total aliphatic acids did not vary significant as a function of pH and reaction time. This is because the most inhibitory compounds for fer- mentation are acetic acid, formic acid, HMF, and furfural [28-30].
The total quantities of aromatic acids and aldehydes increased with decreasing pH and reaction time.
As noted above, these decompositions may inhibit the growth of ethanologenic species and cause a decline in ethanol production [31,32].
In particular, furfural is well known decomposition product from pentose, in the acid hydrolysis of lignocellulosic biomass. Table 1 show that the maximum concentration of furfural was 0.08 g/L.
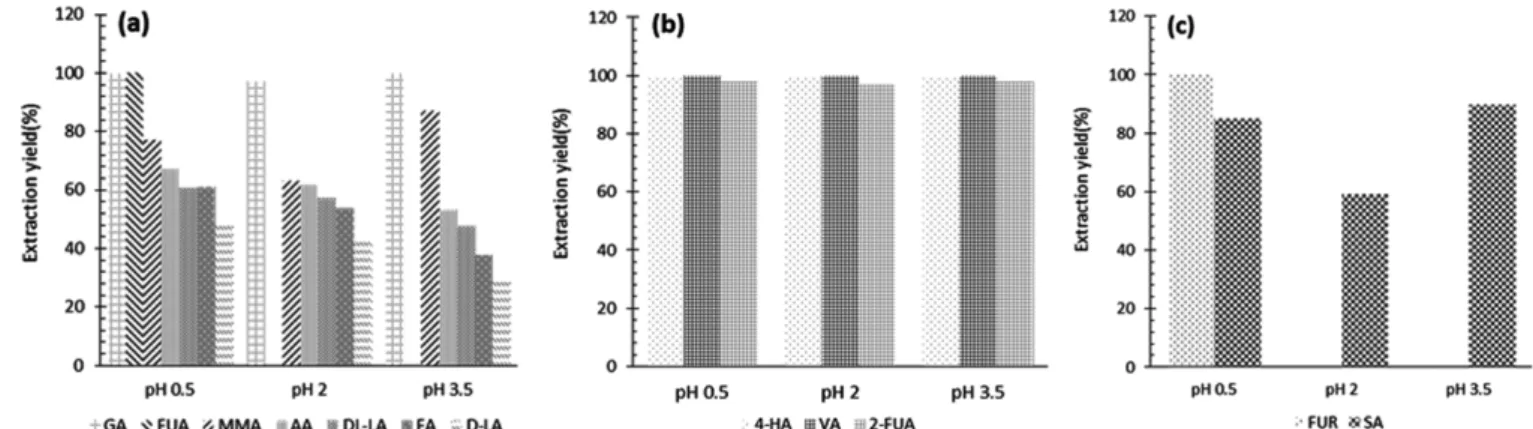
Fig. 2. (a) Aliphatic acid, (b) Aromatic acid, (c) Aldehydes using extraction agent (TOPO) yield from black liquor as a function of pH value. NOTE:
Small amounts of fumaric acid and furfural were hardly obtained from hydrolyzates, which were not emptied in Fig. 2(b), Fig. 2(c).
3-2. Effect of pH on extraction
Figure 2 shows extraction of the degradation products as a function of the pH of black liquor hydrolyzed by TOPO. TOPO has a substantial extraction capacity at low pH levels. Much of the acetic acid remains in the aqueous phase when the extraction is carried out above pH 3 [14]. Extraction at low pH is reasonable in biorefinery processes as LLE extraction can be performed after acid hydrolysis at low pH.
Figure 2(a), 2(b), and 2(c) show the extraction yields of aromatic acids, aliphatic acids, and aldehydes via LLE. On average, the amount of most degradation products increased with decreasing pH. Many degradation products were recovered using TOPO. Figure 2(b) and (c) show that only small amounts of fumaric acid and furfural were obtained from the hydrolyzates, because extraction was incomplete.
The strongest inhibitors among the degradation products were for- mic acid, lactic acid, and acetic acid. Table 3 shows indicates that the maximum yields of formic acid, lactic acid, and acetic acid were 64.56%, 53.18%, and 69.87%, respectively, at pH 0.5.
3-3. Effect of LLE process sugar reduction
The sugar components and total sugar remaining in the aqueous phase after LLE are shown in Figure 3. One of the concerns in opti- mizing the extraction condition of black liquor for fermentation is that the extractant might remove sugars along with organic acids.
After LLE with TOPO, over 80% of the sugars were retained in the aqueous phase. Figure 3 shows that the amount of sugars varied with pH; slightly larger amounts were retained at low pH. Sugars were hardly removed by LLE with TOPO.
3-4. Optimization study by statistical experimental design Three-level RSM factorial design was used to obtain a qua- dratic model consisting of 17 trials. The ranges and levels of three independent variables, pH, temperature, and residence time, were chosen, as shown in Table 2. Analysis of variance (ANOVA) of the regression model, gave the following expression for the pre- dicted responses, Y:
(YFA) = 57.20 − 11.59x1 − 1.61x2 − 1.57x3 + 0.22x1x2 − 0.88x1x3 + 0.68x2x3 − 7.45x12 + 0.12x22 − 0.80x32
Fig. 3. The extent of sugar (glucose + xylose + arabinose) retention in extract derived from black liquor through LLE as function of pH value.
Table 3. Maximum extraction yield of degradation products from black liquor with tri-n-ctylphosphine oxide (TOPO)
Entry Solvent
Extraction yield (%)
Aliphatic acid Aromatic acid Aldehydes
D-LA DL-LA AA FA FUA MMA GA VA 2-FUA 4-HA Fur SA
1 TOPO 53.18 59.87 69.87 64.56 100 75.56 100 100 98.00 100 100 84.45
*The extraction conditions: pH=0.5, temp=25°C and reaction time=36min
*Glu : Glucose, Xyl : Xylose, Ara : Arabinose, D-LA : D-Lactic acid, DL-LA : DL-Lactic acid, AA : Acetic acid, FA: Formic acid, FUA : Fumaric acid, MMA : Methyl malonic acid, GC : Gallic acid, VA :Vanillic acid, 2-FUA: 2-Furoic acid, 4-HA : 4-Hydroxybenzoic acid, Fur : Furfural, SA : Syringaldehyde
Table 4. ANOVA for a response surface quadratic model using with tri-n-ctylphosphine oxide (TOPO)
Source
Formic acid Lactic acid Acetic acid
Sum of
Squares df Mean Square
F Value
p-value Prob > F
Sum of
Squares df Mean Square
F Value
p-value Prob > F
Sum of
Squares df Mean
Square F Value p-value Prob > F Model 1360.46 9 151.16 20.61 0.0003 765.38 3 255.13 27.25 < 0.0001 460.50 3 153.50 46.37 < 0.0001 A 1074.68 1 1074.68 146.55 < 0.0001 733.95 1 733.95 78.38 < 0.0001 396.37 1 396.37 119.74 < 0.0001
B 20.64 1 20.64 2.81 0.1373 28.34 1 28.34 3.03 0.1055 63.45 1 63.45 19.17 0.0007
C 19.72 1 19.72 2.69 0.1451 3.09 1 3.09 0.33 0.5757 0.68 1 0.68 0.20 0.6584
AB 0.20 1 0.20 0.03 0.8743
AC 3.06 1 3.06 0.42 0.5387
BC 1.86 1 1.86 0.25 0.6297
A2 233.84 1 233.84 31.89 0.0008
B2 0.06 1 0.06 0.01 0.9283
C2 2.68 1 2.68 0.37 0.5645
Residual 51.33 7 7.33 121.72 13 9.36 43.03 13 3.31
Lack of Fit 9.07 3 3.02 0.29 0.8340 73.83 9 8.20 0.68 0.7080 32.54 9 3.62 1.38 0.4038
Pure Error 42.26 4 10.57 47.90 4 11.97 10.49 4 2.62
Cor Total 1411.80 16 887.10 16 503.54 16
(YLA) = 40.75 − 9.58x1 − 1.88x2 − 0.62x3 (YAA) = 61.11 − 7.04x1 – 2.82x2 + 0.29x3
where YFA, YLA, and YAA are the predicted extraction yields of for- mic acid, lactic acid, and acetic acid, respectively, and x1, x2, and x3 are the coded values for the three variables, pH, temperature (°C), and residence time (min), respectively.
The significance of the model was studied using ANOVA., and that of the model equations for organic acid extraction yields was checked using the F-test; the results are shown in Table 4. The model F-values for the FA, LA, and AA yield were 20.61, 27.25, and 46.37, respectively. The model probability values for FA, LA, and AA (0.0003, <0.0001, and <0.0001) were low enough to show that the model terms for FA, LA, and AA were significant. Lack-of-fit tests were also used to evaluate the model adequacy; an insignificant lack- of-fit is desirable. The lack-of-fit values for the FA, LA, and AA extraction yields were 0.8340, 0.7080, and 0.4038, respectively; these values were statistically insignificant and showed that the constructed models were suitable for describing the observed data. The model
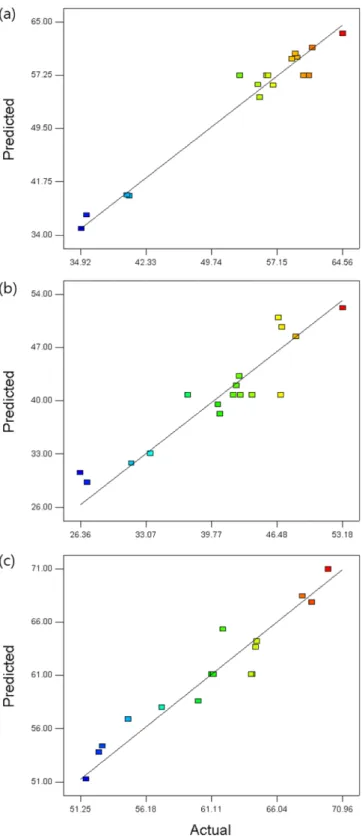
Fig. 4. The plot of predicted values versus actual values for (a) formic acid, (b) lactic acid, and (c) acetic acid using TOPO.
Fig. 5. Estimated response surface for formic acid showing the effects of (a) pH and temperature, (b) temperature and time, and (c) pH and time.
goodness-of-fit was also checked by determining the coefficient R2, the R2 values for the FA, LA, and AA extraction yields were 0.964, 0.863, and 0.915, indicating that the models for all the organic acid extraction yields fitted well with the observed data. The adjusted R2 values for the FA, LA, and extraction yield, models were 0.917, 0.831, and 0.895, respectively, and the predicted values were 0.850, 0.783, and 0.856, respectively. The adjusted and predicted R2 values were in good agreement, and each adjusted R2 value was close to each predicted R2 value, indicating a good adjustment between the observed and predicted values. Figure 4 shows that the points of the predicted versus actual plots for the FA, LA, and AA yields were clustered along the diagonal line, indicating that the predicted values
match the observed ones well.
The ANOVA data shown in Table 4 were used to examine the sig- nificance of the main effects and interacting effects of parameters on the FA, LA, and AA extraction yields, Statistical analysis of the experimental ranges studied identified pH as the most important fac- tor for all the organic acid extraction yields, because the value of Prob
> F less than 0.05, which indicates the significance of the model term. The temperature did not significantly influence the FA and LA extraction yields, but it influenced the AA extraction yield. The effects of time and interacting factors on the organic acid yields were not statistically significant at 95% confidence limits.
Response surface plots showing the FA, LA, and AA extraction
Fig. 6. Estimated response surface for lactic acid showing the effects of (a) pH and temperature, (b) temperature and time, and (c) pH and time.
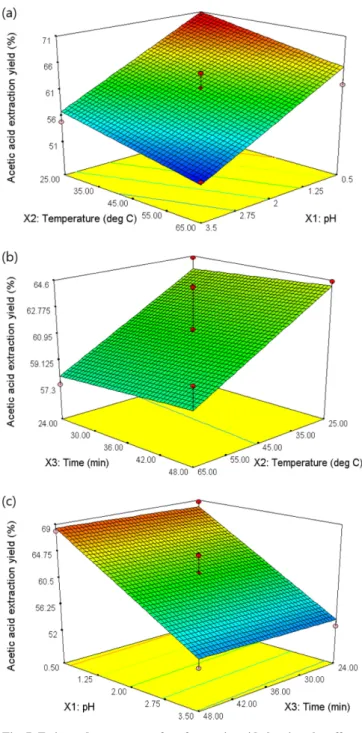
Fig. 7. Estimated response surface for acetic acid showing the effects of (a) pH and temperature, (b) temperature and time, and (c) pH and time.
yields for pairs of interacting variables among pH, temperature, and time were constructed (Figures 5, 6, and 7). The optimum values of the variables that maximize the responses, i.e., the FA, LA, and AA extraction yields, were tracked using RSM. The FA extraction yield under the optimized conditions, pH 0.9, 25.0oC, and 24.0 min, was 64.4%. The LA and AA extraction yields under the optimized condi- tion were 52.8% (at pH 0.5, 25.0oC, and 24.0 min) and 70.4% (pH 0.6, 25.8oC, and 37.2 min), respectively.
4. Conclusions
The results of this study clearly indicate that the production of potentially inhibitory compounds during black liquor hydrolysis is complex and requires careful consideration when evaluating acid pretreatment schemes. There is a continuing need to develop a more thorough mechanistic understanding of the effects of pretreatment chemistry on formation and accumulation of black liquor degrada- tion products. Such an understanding may prove to be particularly relevant in limiting the production of certain compounds (e.g., inhib- itors). The solvent extraction equilibrium of acetic acid by TOPO in an alkane solvent was studied. The organic acid yields increased sig- nificantly with decreased pH. The sugar concentrations in extracts were not greatly affected by LLE with TOPO in an alkane solvent. A bio-refinery including an LLE step for recovering acetic acid should be positioned between the hydrolysis and fermentation units. The maximum AA extraction yield achieved by LLE was 69.87%, repre- senting 91.0% of the maximum possible yield. RSM models were pH 0.6, 25.8oC, and 37.2 min. Statistical optimization and compari- son of multiple variables were successfully carried out in a labora- tory study using RSM. It was found that pH was the most important in parameter LLE. The statistical optimization method, which incor- porates residence time, temperature and pH, provides a useful method for determining the trade-off among the combined effects of these three variables on organic acid extraction yields.
Acknowledgments
This work was supported by a National Research Foundation of Korea (NRF) grant funded by the Korea government (MSIP) (No.
2016R1A2B1007154) (Grant #: 2016R1A2B1007154).
References
1. Luoma, P., Vanhanen, J., Tommila, P., Distributed Bio-Based Economy: Driving Growth, SITRA: Helsinki, Finland (2011).
2. Aresta, M., Dibenedetto, A. and Dumeignil, F., “Biorefinery:
From Biomass to Chemicals and Fuels,” Green Process Synth, 2, 87-88(2013).
3. Um, B. H. and Hanley, T. R., “A CFD Model for Predicting the Flow Patterns of Viscous Fluids in a Bioreactor Under Various Operating Conditions,” Korean J. Chem. Eng., 25(5), 1094-1102 (2008).
4. Zhang, Y. H. P., “Reviving the Carbohydrate Economy via Multi-Product Lignocellulose Biorefineries,” J. Ind. Microbiol.
Biotechnol., 35, 367-375(2008).
5. Himmel, M. E., Biomass Recalcitrance. Deconstructing the Plant Cell Wall for Bioenergy. Blackwell, Oxford (2008).
6. Rodrigues, J. A. R., “From the Mill to a Biorefinery: The Sugar Factory as an Industrial Enterprise for the Generation of Biochemi- cals and Biof Uels,” Quim. Nova, 34, 1242-1254(2011).
7. Dewulf, J. and Van Langenhoven, H., Renewables-Based Tech- nology. Sustainability Assessment. John Wiley & Sons, Chich- ester(2006).
8. Um, B. H. and Bae, S. H., “Statistical Methodology for Optimizing the Dilute Acid Hydrolysis of Sugarcane Bagasse,” Korean J.
Chem. Eng., 28(5), 1172-1176(2011).
9. Xu, J., Cheng, J. J., Sharma-Shivappa, R. R. and Burns, J. C.,
“Sodium Hydroxide Pretreatment of Switchgrass for Ethanol Production,” Energy Fuels 24(3), 2113-2119(2010).
10. Fengcl, D. and Wegener, G., Wood - Chemistry, Ultrastructure, Reactions. Walter de Gruyter, Berlin (1989).
11. Klinke, H. B., Thomsen, A. B. and Ahring, B. K., “Inhibition of Ethanol-producing Yeast and Bacteria by Degradation Products Produced During Pre-treatment of Biomass,” Appl. Microbiol., 66, 10-26(2004).
12. Anasthas, H. M. and Gaikar, V. G., “Removal of Acetic Acid Impurities from Ethyl Acetate by Adsorption on Ion Exchange Resins, Sep. Sci. Technol., 36, 2623-2646(2001).
13. Wasewar, K. L., Yawalkar, A. A.., Moulijn, J. A. and Pangarkar, V. G., “Fermentation of Glucose to Lactic Acid with Reactive Extraction, a Review,” Ind. Eng. Chem. Res., 43, 5969-5982 (2004).
14. Um, B. H., Friedman, B. and van Walsum, G. P., “Conditioning Hardwood-derived Pre-pulping Extracts for Use in Fermentation Through Removal and Recovery of Acetic Acid Using Trioctyl- phosphine Oxide (TOPO),” Holzforschung., 65, 51-58(2011).
15. Rickcr, N. L., Michaels, J. N. and King, C. L., “Solvent Properties of Organic Bases for Extraction of Acetic Acid from water,” J.
Sep. Proc. Technol., 1, 36-41(1979).
16. Senol, A., “Extraction Equilibria of Formic Acid, Levulinic Acid, and Ace Tic Acids Using (alamine 3361diluent) and Con- versional Solvent Sys Tems: Modeling Consideration. 1,” Chem.
Eng. Jpn. 32, 717-731(1999).
17. Sabolova, E., Schlosser, S. and Martak, J., “Liquid-liquid Equi- libria of Butyric Acid in Water+solvent Systems with Trioctyl- amine as Extractant,” J. Chem. Eng. Data., 46, 735-745(2001).
18. Heisel, R. W., “Removing Carboxylic Acid from Aqueous Wastes,”
Chem. Eng. Prog., 73, 55-59(1977).
19. Niitsu, M. and Sekine, T., “Solvent Extraction Equilibria of Acids.
VI. The Extraction of Scveral Mono and Dicarboxylic Acids with Trioctylphosphine Oxide in Hexane,” Bull. Chern. Soc. Jpn. 51, 705-709(1978).
20. Wardell, J. M. and King, C. J., “Solvent Equilibriums for Extraction of Carboxylic Acids From Water,” J. Chern. Eng. Data., 23, 144- 148(1978).
21. Hano, T., Matsumoto, M., Ohtake, T., Sasaki, K. and Kawano, Y.,
“Extraction Equilibria of Organic Acids with Tri-n-octylphosphine- oxide,” J. Chem. Eng. Jpn., 23, 260-264(1990).
22. Reisinger, H. and King, C. J., “Extraction and Sorption or Acetic Acid at pH Above pKa to form Calcium Magnesium Acetate,”
Ind. Eng. Chem. Res., 34, 845-852(1995).
23. Juang, R. S. and Wu, R. T., “Extraction of Acetate From Simulated Waste Solutions in Chloromycetin Production,” Sep. Purif. Tech- nol., 17, 225-233(1999).
24. Al-Mudhaf, H. E., Hegazi, M. E. and Abu-Shady, A. I., “Partition Data of Acetic Acid Between Aqueous NaCI Solutions and Trioctyl- phosphine Oxide in Cyclohexane Diluents,” Sep. Purif. Technol., 27, 41-50(2002).
25. Wisniewski, M. and Pierzchalska, M., “Recovery of Carboxylic Acids C1-C3 with Organophosphine Oxide Solvating Extract- ant,” J. Chem. Technol. Biotechnol., 80, 1425-1430(2005).
26. Sluiter, A., Hames, B., Ruiz, R., Scarlata, C., Sluiter, J. and Temple- ton, D., Determination of Sugars, Byproducts, and Degradation Products in Liquid Fraction Process Samples. In: Laboratory Analyt- ical Procedure (LAP), NREL/TP-510-42623, National Renewable Energy Laboratory, Golden, CO, USA (2006).
27. Du, B., Sharma, N., Becker, C., Chen, S. F., Mowery, R. A., van Walsum, G. P. and Chambliss, C. K., “Effect of Varying Feed- stock-Pretreatment chemistry Combinations on the Formation and Accumulation of Potentially Inhibitory Degradation Products in Biomass Hydrolysates,” Biotechnol. Bioeng., 107(3), 430-440(2010).
28. Chen, W. H., Pen, B. L., Yu, C. T. and Hwang, W. S., “Pretreatment Efficiency and Structural Characterization of Rice Straw by An Integrated Process of Dilute-acid and Steam Explosion for Bioeth- anol Production,” Bioresour. Technol., 102, 2916-2924(2011).
29. Kabel, M. A., Bos, G., Zeevalking, J., Voragen, A. G. J. and Schols, H. A., “Effect of Pretreatment Severity on Xylan Solubility and e30.nzymatic Breakdown of the Remaining Cellulose from Wheat Straw,” Bioresour. Technol., 98, 2034-2042(2007).
30. Larsson, S., Palmqvist, E., Hahn-Hägerdal, B., Tengborg, C., Sten- berg, K., Zacchi, G. and Nilvebrant, N.-O., “The Generation of Fer- mentation Inhibitors During Dilute Acid Hydrolysis of Softwood,”
Enzyme Microb. Technol., 24, 151-159(1999).
31. Hsu, T. C., Guo, G. L., Chen, W. H. and Hwang, W. S., “Effect of Dilute Acid Pretreatment of Rice Straw on Structural Proper- ties and Enzymatic Hydrolysis,” Bioresour. Technol., 101, 4907- 4913(2010).
32. Panagiotopoulos, I. A., Lignos, G. D., Bakker, R. R. and Koukios, E. G., “Effect of Low Severity Dilute-acid Pretreatment of Barley Straw and Decreased Enzyme Loading Hydrolysis on the Produc- tion of Fermentable Substrates and the Release of Inhibitory Compounds,” J. Cleaner Prod., 32, 45-51(2012).