• 검색 결과가 없습니다.

In the past decade, the prevalence of overweight and obesity has increased dramatically.

N/A
N/A
Protected

Academic year: 2021

Share " In the past decade, the prevalence of overweight and obesity has increased dramatically."

Copied!
6
0
0

로드 중.... (전체 텍스트 보기)

전체 글

(1)

Introduction

In the past decade, the prevalence of overweight and obesity has increased dramatically.

1,2)

Currently, 65% of United States adults are overweight and 31% of adults are obese.

1)

Obesity has known to cause insulin resistance, Type 2 diabetes, cardiovascular disease, high blood pressure and even certain types of cancer.

3-5)

Recent data from the Centers for Disease Control reported that Type 2 diabetes, cardiovascular disease, various forms of cancer combine to make up to 70% of all deaths in the United States.

5)

Recently, Olshansky et al. predicted that steady increase in life expectancy seen last centuries will soon decline due to prevalence of obesity.

6)

Therefore, it is important to understand the cause and proper treatment or prevention of obesity.

The past ten years have been the golden age of obesity research.

7)

While long understood that the amount of body fat is determined by an interaction of genes and environment, we are for the first time to identify some of the genes responsible for defining the physiological pathways for the regulation of energy balance. Among the most consequential discoveries were ob gene, leptin and its receptor

8,9)

lacking either leptin or its receptors develop morbid obesity weighing about three times of the normal littermates. Although sciences had advanced the understanding of the genetic role in developing obesity, obesity promoting changes in our diet and lack of physical activity are outpacing scientific progress. As it is recommended by Dr. JS Flier in Cell in 2004, a key goal of future research must be to identify mechanisms by which environmental factors interact with specific genes, either to promote, or facilitate resistance to obesity.
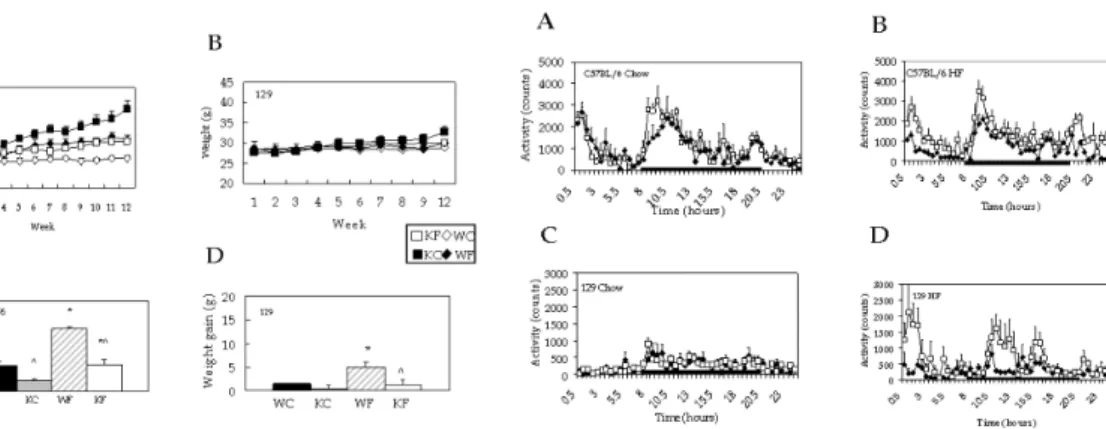
7)

In this paper, I will present three different series of studies investigating 1) interaction between genetic background (C57BL/6, obesity prone and 129, obesity resistant) and single gene deletion of melanin concentrating (MCH) hormone in the developing high fat diet induced obesity,
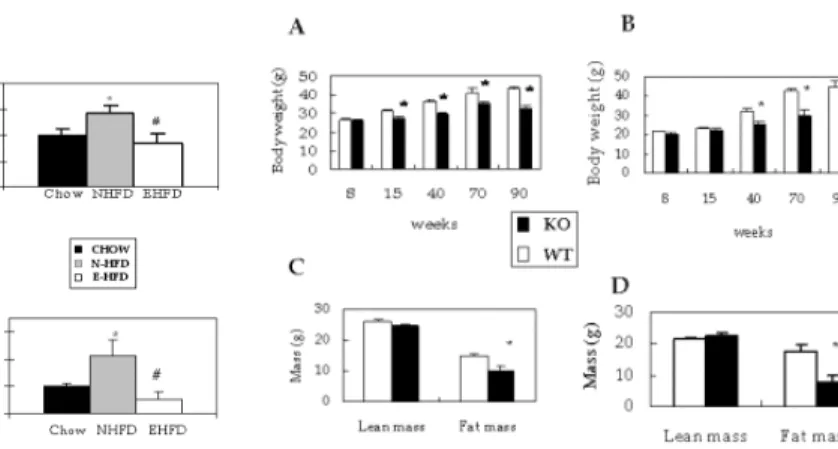
10)

2) interaction between high fat diet and exercise in the development of obesity and insulin resistance,

12)

3) role of leanness in MCH ablated mice on aging associated physiological variables such as insulin resistance, insulin secretion, locomotor activity, and tumor suppressor, p53.

13)

연세대학교 의과대학 사회체육학과

(2)

Study 1

1. Interaction between genes and HFD in development of obesity in MCH -/- mice Genetics and environment contribute to the development of obesity, both in humans and in rodents. However the potential interaction between genes important in energy balance, strain background and dietary environment has been only minimally explored. We investigated the effects of genetic ablation of the melanin-concentrating hormone (MCH), a neuropeptide with a key role in energy balance, with chow and high fat diet (HFD) in two different mouse strains, obesity prone (C57BL/6) and obesity resistant (129). Substantial differences were seen in WT animals of different strains. 129 animals had significantly lower levels of spontaneous locomotor activity than C57BL/6, however 129 mice gained less weight on both chow and HFD. In both strains, deletion of MCH led to attenuated weight gain compared to WT counterparts, an effect secondary to increased energy expenditure. In both strains feeding HFD led to further increases in energy expenditure in both WT and MCH-KO mice, however this increase was more pronounced in 129 mice. In addition, mice lacking MCH have a phenotype of increased locomotor activity, an effect also seen in both strains. The relative increase in activity in MCH -/- mice is modest in animals fed chow but increases substantially when animals are placed on HFD. These studies reinforce the important role of MCH in energy homeostasis and indicate that MCH is a plausible target for anti- obesity therapy.

2. Exercise reverses diet induced obesity and obesity-associated insulin resistance through IKKβ/NFkB pathway

Exercise has been shown to improve insulin sensitivity in human and murine diabetes. We hypothesize that

Figure 1. (A) MCH-/- mice on HFD gained more weight than MCH-/- mice on a chow but did not gain more weight than either WT on chow or WT on HFD. MCH-/- mice on chow gained significantly less weight than WT mice on chow. (B) WT 129 on HFD is the only group gained significant weight with 12 week of HFD. (C) change in weight in C57BL/6 mice. (D) change in weight in 129 mice. *P<0.05, **P<0.01 compared to diffrent diet,

P<

0.05,

∧∧

P<0.01 compared to diffrent genotype. KC: KO on chow, KF: KO on HFD, WC: WT on chow, WF: WT on HFD.

Figure 2. (A) C57BL/6 on chow, (B) C57BL/6 on HFD (C) 129 on

chow, (D) 129 on HFD. Mince were individually housed in the com-

prehensive laboratory animal monitoring system.

(3)

voluntaryexercise may similarly attenuate obesity-associated insulin resistance. We tested this hypothesis in a mouse model of diet-induced obesity. Mice were fed a high fat diet (HFD) for 6 weeks and then divided into two groups. One group was given ad libitum access to free running exercise wheels (E-HFD) while the other received immobilized wheels (N-HFD). E-HFD mice lost weight initially while the N-HFD control group continued to gain weight. Over the course of the 13-week experiment, E-HFD mice gained only 1.8±0.7 g, compared to 6.2

±0.4 g for the N-HFD controls. Glucose and insulin tolerance tests showed that HFD reduced glucose tolerance and increased insulin resistance. These abnormalities were reversed by voluntary exercise (e.g. glucose AUC: chow 32±1, HFD 48±3, E-HFD 38±2 g/dl/2hr, P<0.002). The increase in plasma cholesterol, non esterified fatty

Figure 3. (A) C57BL/6 on chow, (B) C57BL/6 on HF, (C) 129 on chow, (D) 129 on HF, Mice were individually housed in the comprehensive laboratory animal monitoring system.

Figure 4. (A) Growth curve during 13 weeks of exercise. (B) Fat mass measured by DEXA. (C) Cumulative food intake and (D) Locomotor activity during dark cycle and 24 h cycle. Locomotor activity was measured without running wheel by CLAMS after 24 h of acclimation.

*P<0.05 vs Chow. #P<0.05 vs HFD.

P<0.05 vs Chow.

Figure 5. (A,B) Intraperitoneal glucose tolerance test measured (C) Blood for fasting plasma insulin was collected during GTT at -5 min.

(D) Insulin tolerance test was measured during the fed state after 3 hours of fasting (0.75U/g body weight insulin was used). *P<0.05 vs Chow. #P<0.05 vs HFD.

Figure 6. Livers were harvested from chow, HFD and EHFD mice.

H & E staining of livers from each group was performed. To measure liver triglycerides (TG), 200 mg of liver section was used and TG measured using a triglyceride colorimetric assay. *P<0.05 vs Chow.

#P<0.05 HFD.

(4)

acids (NEFA) and liver triglycerides (TG) levels seen in the N-HFD group was reversed by voluntary exercise in the E-HFD group. NF-kB activity and IKKβ gene expression in white adipose tissue (WAT) were increased in N-HFD compared to chow fed controls (NF-kB: chow 7.5±0.6 vs. HFD 13.2±2.2, P=0.02; IKKβ: chow 1.2

±0.1 vs HFD 1.7±0.2, P<0.02). Importantly, voluntary exercise decreased NF-kB activity and target gene expression to levels similar to those seen in chow fed mice (NF-kB: NHFD 13.2±2.2 vs. EHFD 7.7±2.2, p<

0.04; IKKβ: NHFD 1.7±0.2 vs. EHFD 1.1±0.1, P<0.01; TNF-α N-HFD 12.5±3.4 vs E-HFD 4.6±1.4, P

<0.04). In conclusion, voluntary exercise reversed insulin resistance associated with HFD in wild type mice. This was associated with decreases in NF-kB activity and target gene expression, including IKKβ, an upstream

Figure 7. (A) NF-kB DNA binding activity. Nuclear proteins were isolated from white adipose tissue and EMSA performed to compare nuclear NF-kB binding activities in Chow, HFD and EHFD groups.

(B) IKKβ mRNA and (C) TNF-α mRNA as measured by real time PCR. Results are represented as fold increase over Chow. *P<0.05 vs Chow NHFD. #P<0.05 vs HFD.

Figure 8. Growth curve of males (A) and females (B) up to 90 weeks.

(C) and (D) show lean mass and fat mass from males and females, respectively. DEXA was used to measure body composition of mice.

*P<0.01 for MCH-/- vs wild-type mice.

Figure 9. (A) locomotor activity of female MCH-/- and wild type mice at 17 months of age, measured by CLAMS. (B) oxygen con- sumption of female MCH-/- and wild type mice at 17 months of age. (C) aging associated reduction in locomotor activity in wild-type vs MCH-/- mice. Bars represent 24 h average locomotor activity.

(D) metabolic rate of MCH-/- and wild-type mice.

Figure 10. GTT results from (A) 40 week old and (B) 74-week old

MCH-/- and wild-type mice. The shaded squares represent

wild-type and open diamond represents MCH-/- mice. (C) fasting

plasma insulin. (D) percent change in insulin level during GTT

compared to baseline insulin levels.

(5)

activator of NF-kB, and TNF-α, a potential mediator of its effects. These findings are consistent with roles for the NF-kB cascade in the pathogenesis of insulin resistance and as a target for reversal of insulin resistance.

3. MCH-/- mice are resistant to aging associated increases in body weight and insulin resistance

Ablation of the hypothalamic neuropeptide, melanin concentrating hormone (MCH) leads to a lean phenotype and resistance to diet induced obesity. These effects have been defined in young animals, aged between 8∼20 weeks. To assess the potential long-term effects of MCH ablation we monitored male and female MCH -/- mice up to 19 months of age. The lean phenotype of MCH-/-mice persisted over the duration of the study.

At 19 months MCH -/- male and female mice weighed 23.4% and 30.8% less than their wild-type controls.

DEXA analysis revealed that reduction in fat mass was responsible for the reduced body weight in MCH -/- mice. Consistent with reduced fat mass, aging MCH -/- mice were more insulin sensitive compared to wild- type controls. Male and female MCH -/- mice had 29.5% and 52% better glucose tolerance respectively, com- pared to wild-type animals. Aging associated decrease in locomotor activity was also attenuated in MCH -/- mice. Furthermore, we found that expression of the tumor suppressing protein, p53, was reduced with aging in both MCH -/- and wild-type mice. However, aging associated reduction in p53 was small in mice lacking MCH. In summary, aged MCH -/- mice are lean, active and insulin sensitive and this phenotype suggest that the leanness resulting from MCH ablation may ameliorate some of the adverse consequences of aging.

Summary

In summary, these studies showed the interaction between single gene ablation and genetic background of mice in development of obesity. High fat diet results in the development of obesity and insulin resistance, however, voluntary exercise was able to rescue harmful effects of high fat diet in C57BL/6, obesity prone mice. Leanness

Figure 11. P53 protein levels were measured from liver (A) and spleen (B) from

9-month and 18 month old MCH-/- and wild-type mice. #P<0.05 within

genotype, *<0.05 against genotype.

(6)

3. Calle EE, Rodriguez C, Walker-Thurmond K, Thun MJ. Overweight, obesity, and mortality from cancer in a prospectively studied cohort of U.S. adults. New England Journal of Medicine 2003;348:1625-38.

4. Calle EE, Thun MJ, Petrelli JM, Rodriguez C, Heath CW. Body mass index and mortality in a prospective cohort of US adults. New England Journal of Medicine 1999;341:1097-105.

5. Mokdad AH, Marks JS, Stroup DF, Gerberding JL. Actual causes of death in the United States. 2000 JAMA 2004;291:1238-45.

6. Olshansky SJ, Passaro DJ, Hershow RC, Layden J, Carnes BA, Brody J, et al. A potential decline in life expec- tancy in the United States in the 21st century. New England Journal of Medicine 2005;352:1138-45.

7. Flier JS. Obesity Wars: molecular progress confronts an expanding epidemic. Cell 2004;116:337-50.

8. Zhang Y, Proenca R, Maffei M, Barone M, Leopold L, Friedman JM. Positional cloning of the mouse obese gene and its human homologue. Nature 1994;372:425-32.

9. Tartaglia LA, Dembski M, Weng X, Deng N, Culpepper J, Devos R, et al. Identification and expression cloning of a leptin receptor, OB-R. Cell 1995;83:1263-71.

10. Kokkotou E, Jeon JY, Wang X, Marino FE, Carlson M, Trombly DJ, et al. Mice with MCH ablation resist diet induced obesity through strain specific mechanisms. Am J Physiol Regul Integr Comp Physiol 2005;24:[Epub ahead of print]

11. Jeon JY, Cai D, Kennedy AR, Bradley R, Maratos-Flier E. "Exercise reverses diet induced obesity and obesity- associated insulin resistance through IKKβ/NFkB pathway. Unpublished data 2005.

12. Jeon JY, Kokkotou E, Bradley R, Wang X, Pissios P, Maratos-Flier E. MCH-/- mice are resistant to aging

associated increases in body weight and insulin resistance. Diabetes (In revision) 2005.

수치

Figure  1.  (A)  MCH-/-  mice  on  HFD  gained  more  weight  than  MCH-/-  mice  on  a  chow  but  did  not  gain  more  weight  than  either  WT  on  chow  or  WT  on  HFD
Figure  3.  (A)  C57BL/6  on  chow,  (B)  C57BL/6  on  HF,  (C)  129  on  chow,  (D)  129  on  HF,  Mice  were  individually  housed  in  the  comprehensive  laboratory  animal  monitoring  system.
Figure  7.  (A)  NF-kB  DNA  binding  activity.  Nuclear  proteins  were  isolated  from  white  adipose  tissue  and  EMSA  performed  to  compare  nuclear  NF-kB  binding  activities  in  Chow,  HFD  and  EHFD  groups
Figure  11.  P53  protein  levels  were  measured  from  liver  (A)  and  spleen  (B)  from  9-month  and  18  month  old  MCH-/-  and  wild-type  mice

참조

관련 문서