Endocrinol Metab 2016;31:446-453
http://dx.doi.org/10.3803/EnM.2016.31.3.446 pISSN 2093-596X · eISSN 2093-5978
Original Article
Prevalence of Reduced Kidney Function by Estimated Glomerular Filtration Rate Using an Equation Based on Creatinine and Cystatin C in Metabolic Syndrome and Its Components in Korean Adults
Yang Ho Kang1,2, Dong Wook Jeong2,3, Seok Man Son1,2
1Division of Endocrinology and Metabolism, Department of Internal Medicine, 2Research Institute for Convergence of Biomedical Science and Technology, 3Department of Family Medicine, Pusan National University Yangsan Hospital, Pusan National University School of Medicine, Yangsan, Korea
Background: It is known that metabolic syndrome (MetS) is associated with chronic kidney disease. We evaluated and com- pared the prevalence of reduced kidney function in MetS and its components by estimated glomerular filtration rate (eGFR) using an equation based on creatinine (eGFRcr), cystatin C (eGFRcys), and combined creatinine-cystatin C (eGFRcr-cys) in Korean adults.
Methods: We analyzed data from 3,649 adults who participated in a comprehensive health examination.
Results: Mean values of eGFRcys were higher compared with mean values of eGFRcr (96.1±18.2 mL/min/1.73 m2 vs. 91.2±
13.6 mL/min/1.73 m2) in total subjects. The prevalence of reduced kidney function increased with age (9.6% for eGFRcys vs.
5.8% for eGFRcr-cys vs. 4.9% for eGFRcr, in subjects aged ≥60 years), and significantly increased with MetS, abdominal obesi- ty, hypertension, high triglyceride, low high density lipoprotein (HDL), and high insulin resistance. The prevalence of MetS, ab- dominal obesity, hypertension, high insulin resistance, low HDL, and hepatic steatosis was significantly increased in subjects with reduced kidney function. This increased prevalence and the odds ratio of reduced kidney function for prevalence of MetS was highest for eGFRcys, followed by those of eGFRcr-cys, and eGFRcr.
Conclusion: The prevalence of reduced kidney function by eGFR was significantly increased in subjects with MetS and its relat- ed components. eGFRcys and eGFRcr-cys were superior to eGFRcr in detecting reduced kidney function.
Keywords: Glomerular filtration rate; Cystatin C; Creatinine; Metabolic syndrome
INTRODUCTION
Metabolic syndrome (MetS), a constellation of cardiovascular disease (CVD) risk factors [1] is associated with risk of coro-
nary heart disease, stroke, and cardiovascular related mortality [2,3]. Moreover, MetS is associated with progression to chronic kidney disease (CKD) [4-6]. The glomerular filtration rate (GFR) is considered the most widely used index of overall kid-
Received: 19 May 2016, Revised: 16 June 2016, Accepted: 17 June 2016 Corresponding author: Yang Ho Kang
Division of Endocrinology and Metabolism, Department of Internal Medicine, Pusan National University Yangsan Hospital, Pusan National University School of Medicine, 20 Geumo-ro, Mulgeum-eup, Yangsan 50612, Korea
Tel: +82-55-360-2358, Fax: +82-55-360-2150, E-mail: [email protected]
Copyright © 2016 Korean Endocrine Society
This is an Open Access article distributed under the terms of the Creative Com- mons Attribution Non-Commercial License (http://creativecommons.org/
licenses/by-nc/4.0/) which permits unrestricted non-commercial use, distribu- tion, and reproduction in any medium, provided the original work is properly cited.
pISSN 2093-596X · eISSN 2093-5978
ney function and is estimated rather than measured in clinical practice. Generally, estimation of GFR from equations based on serum creatinine level is the most common method. How- ever, creatinine is affected by age, sex, race, muscle mass, and diet [7,8].
Recently, serum cystatin C, an endogenous protein, which is freely filtered by the glomerulus, reabsorbed, and catabolized, but not secreted by the renal tubules [9], has been proposed as a potential alternative for serum creatinine as a filtration mark- er [10]. Cystatin C is less affected by age, race, muscle mass, and diet [7,11]. However, body mass index (BMI), diabetes, and inflammation affect cystatin C level independent of kidney function [12]. Tsai et al. [13] estimated GFR (eGFR) using equations based on creatinine (eGFRcr) and cystatin C (eGFR- cys) and compared the discordance of the equations using the two filtration markers in evaluating the prevalence of reduced kidney function and incident all-cause and cardiovascular mor- tality among persons with diabetes in the United States. How- ever, few studies have evaluated the prevalence of reduced kid- ney function in MetS or compared equations based on creati- nine and cystatin C to eGFR as an indicator of kidney function especially in an Asian population.
The aim of this study was to evaluate and compare the preva- lence of reduced kidney function in MetS and related metabolic components by eGFR using an equation based on eGFRcr, eG- FRcys, and combined creatinine-cystatin C (eGFRcr-cys).
METHODS
Subjects
We analyzed data from 3,649 adults aged ≥20 years who par- ticipated in a comprehensive health examination at Pusan Na- tional University Yangsan Hospital in Yangsan, Korea in 2013.
Of the subjects, we excluded those with liver disease (serum levels of aspartate aminotransferase or alanine aminotransferase greater than three times the upper limit of the reference range) (n=19), abnormal serum thyroid stimulating hormone (TSH) levels (TSH <0.27 μIU/mL or TSH >4.2 μIU/mL; n=473), or elevated high-sensitivity C-reactive protein (hs-CRP) level (>10.0 mg/L; n=3). Finally, 3,154 adults (1,871 men, 1,283 women) were enrolled in the study. No subject had an eGFR lower than 15 mL/min/1.73 m2 or an eGFR higher than 200 mL/
min/1.73 m2.
Informed consent for use of the health screening data ana- lyzed in this study was obtained from all subjects. This study was approved by the Institutional Review Board of Pusan Na-
tional University Yangsan Hospital (subject no. 05-2016-025).
Anthropometric and biochemical data
Height and weight were measured with subjects barefoot and wearing light weight clothing. BMI was calculated as weight in kilograms divided by the square of height in meters. Waist cir- cumference was measured with a soft tape measure on standing subjects midway between the lowest rib and the iliac crest.
Blood pressure was measured on the right arm with subjects in a seated position after a 5-minute rest. Blood specimens were collected from the antecubital vein after an overnight fast. Fast- ing blood glucose (FBG) was measured by the glucose oxidase method (Synchron LX-20, Beckman Coulter Inc., Fullerton, CA, USA). Concentrations of standard liver enzymes, total cholesterol, high density lipoprotein (HDL) cholesterol, serum triglyceride (TG), γ-glutamyltransferase (GGT), and serum creatinine (Jaffe’s kinetic assay) were measured using an auto- analyzer and an enzymatic colorimetric method (Hitachi 7600, Hitachi Ltd., Tokyo, Japan). The serum cystatin C level was measured by the latex agglutination test (Modular P800, Roche Diagnostics, Mannheim, Germany).
Estimating equations
GFR was estimated using equations developed by the CKD- epidemiology collaboration (CKD-EPI). eGFRcr was comput- ed using the CKD-EPI creatinine 2009 equation [10,14]. eG- FRcys and eGFRcr-cys [10,15] were used to assess the most accurate estimate of GFR and were computed using the CKD- EPI cystatin C 2012 equation and the CKD-EPI creatinine-cys- tatin C 2012 equation, respectively [10].
Definitions
Reduced kidney function was defined as eGFR <60 mL/
min/1.73 m2. MetS was defined according to the modified, re- vised National Cholesterol Education Program Adult Treat- ment III [16,17] as the presence of three or more of the follow- ing criteria: (1) abdominal obesity defined as waist circumfer- ence ≥90 cm in men and ≥80 cm in women; (2) impaired fasting glucose as defined by FBG ≥100 mg/dL; (3) high TG as defined by TG ≥150 mg/dL (for conversion to mmol/L, multiply by 0.01129); (4) low HDL as defined by HDL <40 mg/dL in men and <50 mg/dL in women (for conversion to mmol/L, multiply by 0.02586); and (5) blood pressure ≥ 130/85 mm Hg. The homeostasis model assessment of insulin resistance (HOMA-IR) index was calculated using the follow- ing formula:
HOMA-IR=[fasting serum insulin (mU/L)×fasting plasma glucose (mmol/L)]/22.5
High insulin resistance was defined as an HOMA-IR score higher than the 75th percentile [18]. Fatty liver index (FLI) was calculated as below [19,20], and an FLI ≥60 was considered to indicate hepatic steatosis:
FLI=[e0.953×loge (TG)+0.139×BMI+0.718×loge (GGT)+
0.053×waist circumference–15.745)]/[1+e0.953×loge (TG) +0.139×BMI+0.718×loge (GGT)+0.053×waist circumfer- ence–15.745]×100
Statistical analysis
All data are presented as mean±SD for continuous variables.
Median values are also indicated in the cases of TG, GGT, and hs-CRP, which had skewed distributions. Categorical variables were compared using the chi-square test. Odds ratio (OR) and corresponding 95% confidence interval (CI) as an estimate of the relative risk of reduced kidney function for the prevalence of MetS were calculated by multiple logistic regression analy- ses with non-adjusted data (model 1), after adjusting for age (20 to 39, 40 to 59, ≥60 years) and sex (men, women) (model
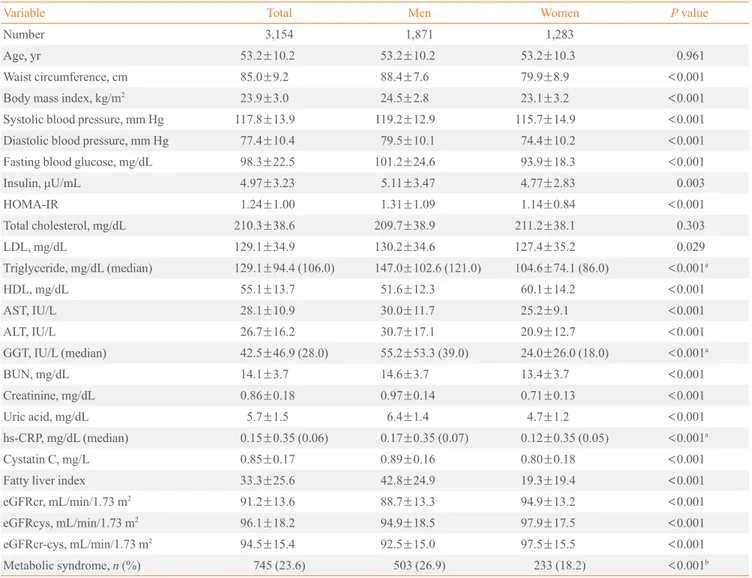
Table 1. Clinical Characteristics of the Subjects
Variable Total Men Women P value
Number 3,154 1,871 1,283
Age, yr 53.2±10.2 53.2±10.2 53.2±10.3 0.961
Waist circumference, cm 85.0±9.2 88.4±7.6 79.9±8.9 <0.001
Body mass index, kg/m2 23.9±3.0 24.5±2.8 23.1±3.2 <0.001
Systolic blood pressure, mm Hg 117.8±13.9 119.2±12.9 115.7±14.9 <0.001
Diastolic blood pressure, mm Hg 77.4±10.4 79.5±10.1 74.4±10.2 <0.001
Fasting blood glucose, mg/dL 98.3±22.5 101.2±24.6 93.9±18.3 <0.001
Insulin, μU/mL 4.97±3.23 5.11±3.47 4.77±2.83 0.003
HOMA-IR 1.24±1.00 1.31±1.09 1.14±0.84 <0.001
Total cholesterol, mg/dL 210.3±38.6 209.7±38.9 211.2±38.1 0.303
LDL, mg/dL 129.1±34.9 130.2±34.6 127.4±35.2 0.029
Triglyceride, mg/dL (median) 129.1±94.4 (106.0) 147.0±102.6 (121.0) 104.6±74.1 (86.0) <0.001a
HDL, mg/dL 55.1±13.7 51.6±12.3 60.1±14.2 <0.001
AST, IU/L 28.1±10.9 30.0±11.7 25.2±9.1 <0.001
ALT, IU/L 26.7±16.2 30.7±17.1 20.9±12.7 <0.001
GGT, IU/L (median) 42.5±46.9 (28.0) 55.2±53.3 (39.0) 24.0±26.0 (18.0) <0.001a
BUN, mg/dL 14.1±3.7 14.6±3.7 13.4±3.7 <0.001
Creatinine, mg/dL 0.86±0.18 0.97±0.14 0.71±0.13 <0.001
Uric acid, mg/dL 5.7±1.5 6.4±1.4 4.7±1.2 <0.001
hs-CRP, mg/dL (median) 0.15±0.35 (0.06) 0.17±0.35 (0.07) 0.12±0.35 (0.05) <0.001a
Cystatin C, mg/L 0.85±0.17 0.89±0.16 0.80±0.18 <0.001
Fatty liver index 33.3±25.6 42.8±24.9 19.3±19.4 <0.001
eGFRcr, mL/min/1.73 m2 91.2±13.6 88.7±13.3 94.9±13.2 <0.001
eGFRcys, mL/min/1.73 m2 96.1±18.2 94.9±18.5 97.9±17.5 <0.001
eGFRcr-cys, mL/min/1.73 m2 94.5±15.4 92.5±15.0 97.5±15.5 <0.001
Metabolic syndrome, n (%) 745 (23.6) 503 (26.9) 233 (18.2) <0.001b
Values are expressed as mean±SD unless otherwise indicated. P value was calculated by independent t test unless otherwise indicated.
HOMA-IR, homeostasis model assessment of insulin resistance; LDL, low density lipoprotein; HDL, high density lipoprotein; AST, aspartate ami- notransferase; ALT, alanine aminotransferase; GGT, γ-glutamyltransferase; BUN, blood urea nitrogen; hs-CRP, high-sensitivity C-reactive protein;
eGFRcr, estimated glomerular filtration rate (GFR) from creatinine equation; eGFRcys, estimated GFR from cystatin C equation; eGFRcr-cys, esti- mated GFR from creatinine-cystatin C equation.
aMann-Whitney test; bChi-square test.
2), and after adjusting for age, sex, abdominal obesity (yes, no), and high fasting glucose (yes, no) (model 3), using pre- served kidney function (eGFR ≥60 mL/min/1.73 m2) as the reference category. Statistical analyses were performed with the SPSS version 18.0 (SPSS Inc., Chicago, IL, USA). A prob- ability value less than 0.05 was considered significant.
RESULTS
Clinical characteristics
The prevalence of MetS was 26.9% in men and 18.2% in women. Men showed higher mean levels of serum creatinine (0.97±0.14 mg/dL vs. 0.7±0.1 mg/dL, P<0.001) and serum cystatin C (0.89±0.16 mg/dL vs. 0.80±0.18 mg/dL, P<0.001) than women. Mean eGFRcys was higher than mean eGFRcr (96.1±18.2 mL/min/1.73 m2 vs. 91.2±13.6 mL/min/1.73 m2, respectively), with mean eGFRcr-cys falling between them (94.5±15.4 mL/min/1.73 m2) in total subjects (Table 1).
The prevalence of reduced kidney function by eGFRcr, eGFRcys, and eGFRcr-cys
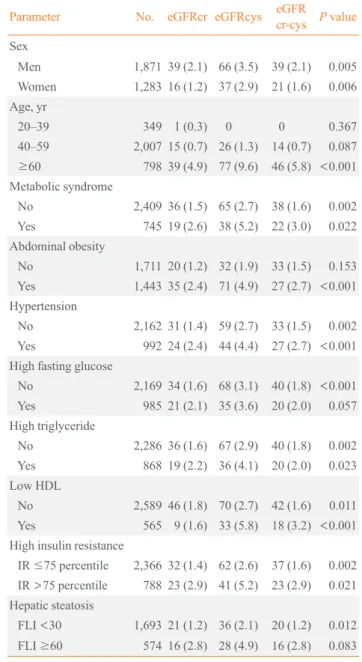
With an increase in age, the prevalence of reduced kidney func- tion increased and was highest for eGFRcys, intermediate for eGFRcr-cys, and lowest for eGFRcr (9.6% for eGFRcys vs.
5.8% for eGFRcr-cys vs. 4.9% for eGFRcr, P<0.001 in sub- jects aged ≥60 years) (Table 2). With regard to metabolic pa- rameters, the prevalence of reduced kidney function was sig- nificantly increased in subjects with MetS, abdominal obesity, hypertension, high TG, low HDL, and high insulin resistance and was highest for eGFRcys, intermediate for eGFRcr-cys, and lowest for eGFRcr (Table 2).
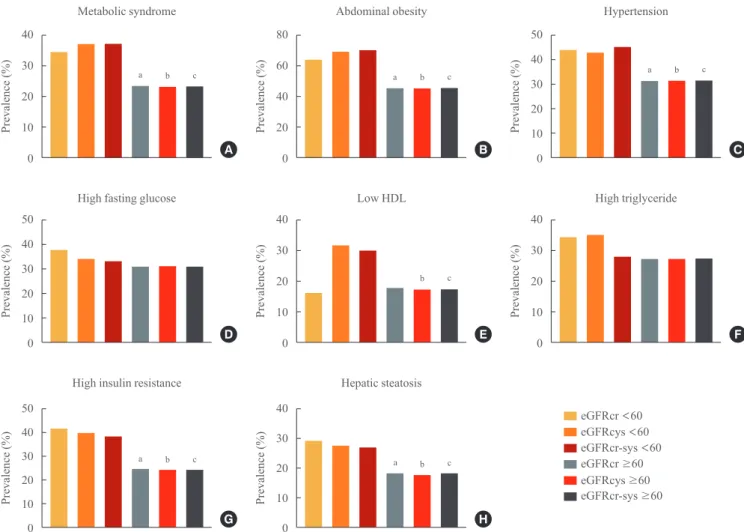
Prevalence of MetS and its components between subjects with reduced kidney function and those with preserved kidney function by eGFRcr, eGFRcys, and eGFRcr-cys The prevalence of MetS (34.5% vs. 23.1% in eGFRcr, 36.9%
vs. 22.9% in eGFRcys, 36.7% vs. 23.1% in eGFRcr-cys), ab- dominal obesity (63.6% vs. 45.5% in eGFRcr, 68.9% vs. 45.0%
in eGFRcys, 70.0% vs. 45.3% in eGFRcr-cys), hypertension (43.6% vs. 31.2% in eGFRcr, 42.7% vs. 31.1% in eGFRcys, 45.0% vs. 31.2% in eGFRcr-cys), high insulin resistance (41.8%
vs. 24.7% in eGFRcr, 39.8% vs. 24.5% in eGFRcys, 38.3% vs.
24.7% in eGFRcr-cys), and hepatic steatosis (29.1% vs. 18.0%
in eGFRcr, 27.2% vs. 17.9% in eGFRcys, 26.7% vs. 18.0% in eGFRcr-cys) was significantly increased in subjects with re- duced kidney function compared with subjects with preserved
kidney function. In case of low HDL, the increased prevalence was only significant in eGFRcys and eGFRcr-cys (16.4% vs.
17.9% in eGFRcr, 32.0% vs. 17.4% in eGFRcys, 30.0% vs.
17.7% in eGFRcr-cys) (Fig. 1).
Table 2. The Prevalence of Reduced Kidney Function by eGFR Based on Creatinine, Cystatin C, and Combined Creatinine- Cystatin C
Parameter No. eGFRcr eGFRcys eGFR cr-cys P value Sex
Men 1,871 39 (2.1) 66 (3.5) 39 (2.1) 0.005 Women 1,283 16 (1.2) 37 (2.9) 21 (1.6) 0.006 Age, yr
20–39 349 1 (0.3) 0 0 0.367
40–59 2,007 15 (0.7) 26 (1.3) 14 (0.7) 0.087 ≥60 798 39 (4.9) 77 (9.6) 46 (5.8) <0.001 Metabolic syndrome
No 2,409 36 (1.5) 65 (2.7) 38 (1.6) 0.002 Yes 745 19 (2.6) 38 (5.2) 22 (3.0) 0.022 Abdominal obesity
No 1,711 20 (1.2) 32 (1.9) 33 (1.5) 0.153 Yes 1,443 35 (2.4) 71 (4.9) 27 (2.7) <0.001 Hypertension
No 2,162 31 (1.4) 59 (2.7) 33 (1.5) 0.002 Yes 992 24 (2.4) 44 (4.4) 27 (2.7) <0.001 High fasting glucose
No 2,169 34 (1.6) 68 (3.1) 40 (1.8) <0.001 Yes 985 21 (2.1) 35 (3.6) 20 (2.0) 0.057 High triglyceride
No 2,286 36 (1.6) 67 (2.9) 40 (1.8) 0.002 Yes 868 19 (2.2) 36 (4.1) 20 (2.0) 0.023 Low HDL
No 2,589 46 (1.8) 70 (2.7) 42 (1.6) 0.011 Yes 565 9 (1.6) 33 (5.8) 18 (3.2) <0.001 High insulin resistance
IR ≤75 percentile 2,366 32 (1.4) 62 (2.6) 37 (1.6) 0.002 IR >75 percentile 788 23 (2.9) 41 (5.2) 23 (2.9) 0.021 Hepatic steatosis
FLI <30 1,693 21 (1.2) 36 (2.1) 20 (1.2) 0.012 FLI ≥60 574 16 (2.8) 28 (4.9) 16 (2.8) 0.083 Values are expressed as number (%). P value was calculated by chi- square test.
eGFR, estimated glomerular filtration rate; eGFRcr, estimated GFR from creatinine equation; eGFRcys, estimated GFR from cystatin C equation; eGFRcr-cys, estimated GFR from creatinine-cystatin C equation; HDL, high density lipoprotein; IR, insulin resistance; FLI, fatty liver index.
40 30 20 10 0
50 40 30 20 10 0
50 40 30 20 10 0
80 60 40 20 0
40 30 20 10 0
40 30 20 10 0
50 40 30 20 10 0
40 30 20 10 0
Prevalence (%)Prevalence (%)Prevalence (%) Prevalence (%)Prevalence (%)Prevalence (%) Prevalence (%)Prevalence (%)
Metabolic syndrome
High fasting glucose
High insulin resistance
Abdominal obesity
Low HDL
Hepatic steatosis
Hypertension
High triglyceride
Fig. 1. Prevalence of metabolic syndrome and its components between reduced kidney function and preserved kidney function by esti- mated glomerular filtration rate (eGFR) based on creatinine (eGFRcr), cystatin C (eGFRcys), and combined creatinine-cystatin C (eG- FRcr-cys). (A) Metabolic syndrome, (B) abdominal obesity, (C) hypertension, (D) high fasting glucose, (E) low high density lipoprotein (HDL), (F) high triglyceride, (G) high insulin resistance, and (H) hepatic steatosis. P value was calculated by chi-square test. aP<0.05 vs. eGFRcr <60 mL/min/1.73 m2; bP<0.05 vs. eGFRcys <60 mL/min/1.73 m2; cP<0.05 vs. eGFRcr-cys <60 mL/min/1.73 m2.
A
D
G
B
E
H
C
F
a b c a a
b
b
a b
c b
c
c
c
a b c
eGFRcr <60 eGFRcys <60 eGFRcr-sys <60 eGFRcr ≥60 eGFRcys ≥60 eGFRcr-sys ≥60
Table 3. ORs (95% CI) of Reduced Kidney Function by eGFR Based on Creatinine, Cystatin C, and Combined Creatinine-Cystatin C for the Prevalence of Metabolic Syndrome
eGFR Model 1a Model 2b Model 3c
OR (95% CI) P value OR (95% CI) P value OR (95% CI) P value
eGFRcr ≥60 1 (reference) 1 (reference) 1 (reference)
eGFRcr <60 1.75 (1.00–3.07) 0.050 1.29 (0.72–2.29) 0.380 1.03 (0.47–2.28) 0.928
eGFRcys ≥60 1 (reference) 1 (reference) 1 (reference)
eGFRcys <60 1.97 (1.30–2.96) 0.001 1.47 (0.96–2.25) 0.070 1.57 (0.92–2.67) 0.094
eGFRcr-cys ≥60 1 (reference) 1 (reference) 1 (reference)
eGFRcr-cys <60 1.93 (1.13–3.28) 0.015 1.42 (0.82–2.45) 0.203 1.42 (0.71–2.85) 0.315 eGFR is expressed as mL/min/1.73 m2.
OR, odds ratio; CI, confidence interval; eGFR, estimated glomerular filtration rate; eGFRcr, estimated GFR from creatinine equation; eGFRcys, esti- mated GFR from cystatin C equation; eGFRcr-cys, estimated GFR from creatinine-cystatin C equation.
aModel 1, non-adjusted; bModel 2, adjusted for age and sex; cModel 3, adjusted for age, sex, abdominal obesity, and high fasting glucose.
OR (95% CI) of reduced kidney function for prevalence of MetS according to eGFRcr, eGFRcys, and eGFRcr-cys In comparison of relative risk of reduced kidney function for prevalence of MetS, eGFRcys was the highest (OR, 1.97; 95%
CI, 1.30 to 2.96; P=0.001), followed by eGFRcr-cys (OR, 1.93;
95% CI, 1.13 to 3.28; P=0.015), and eGFRcr (OR, 1.75; 95%
CI, 1.00 to 3.07; P=0.050) in the non-adjusted model. Howev- er, it was attenuated after adjusting for age and sex (model 1) and for age, sex, abdominal obesity, and high fasting glucose (model 2) (Table 3).
DISCUSSION
In this study, we evaluated and compared the prevalence of re- duced kidney function in subjects with MetS and its related pa- rameters by eGFRcr, eGFRcys, and eGFRcr-cys in Korean adults. The mean value of eGFRcys (96.1±18.2 mL/min/1.73 m2) was higher than the mean value of eGFRcr (91.2±13.6 mL/min/1.73 m2). This finding was consistent with previous large scale studies [13,21] from the National Health and Nutri- tion Examination Survey in the United States and study [22]
using data from an Italian population. This finding might be due to more disperse distributions of eGFRcys than eGFRcr and differences in non-GFR determinants, such as BMI, be- tween serum cystatin C and creatinine levels [21,23].
Similar to previous results [21,24], there was an increase in the prevalence of reduced eGFR with age in our study. Pattaro et al. [22] reported that correlation of eGFRcys and eGFRcr was significantly different in those ≥65 years compared to in those <65 years. Tsai et al. [13] showed that the absolute dif- ference in reduced kidney function prevalence between eGFR- cys and eGFRcr was 6.9% in those aged 60 to 80 years and 10.3% in those aged 80 years or older. Similarly, the discrepan- cy in the prevalence of reduced kidney function between eG- FRcys and eGFRcr was largest in those aged ≥60 years (38%) compared to those aged 40 to 59 years (11%) in this study. A possible reason for the increased prevalence of reduced kidney function by eGFRcys than eGFRcr in older age (9.6% vs.
5.8%, P<0.001 in aged ≥60 years respectively) could be that muscle mass and diet are significant non-GFR determinants in the case of creatinine, and eGFRcr may be confounded by ca- chexia and muscle wasting at older ages [8,13,21]. Further- more, serum cystatin C is known to have a higher association with mortality and CVD than serum creatinine, especially in older adults [25-27]. Therefore, our finding suggests that cys- tatin C is a better filtration marker than creatinine in elderly
persons [12,15].
In the present study, we demonstrated that the prevalence of reduced kidney function was significantly increased and higher when using eGFRcys than eGFRcr in subjects with MetS, ab- dominal obesity, hypertension, low HDL, and high insulin re- sistance. In addition, the prevalence of MetS, abdominal obesi- ty, hypertension, high insulin resistance, and hepatic steatosis was significantly increased in subjects with reduced kidney function compared to those with preserved kidney function, and the percentage was higher according to eGFRcys than eG- FRcr. Previous studies have demonstrated that cystatin C had stronger associations than creatinine with systolic blood pres- sure, weight, and BMI [12], and eGFRcys were more accurate, sensitive, and specific in overweight and obese subjects includ- ing visceral obesity compared to eGFR equations based on cre- atinine [28,29]. It was also shown that cystatin C may be a sen- sitive marker of small reductions in kidney function (preclinical kidney disease) [30], and eGFRcys may be more reliable than eGFRcr, particularly in subjects with a mild reduction in GFR, in whom changes in serum creatinine are not detected [7,31].
MetS and its related components such as obesity, hypertension, dyslipidemia, and insulin resistance were also important in in- creased risk of CKD [32]. The possible pathophysiologic mechanism of the strong association between MetS and ad- vancing CKD is that obesity, insulin resistance, hypertension, dyslipidemia, and inflammation result in increased expression of adipocytokines, angiotensin, and inflammatory cytokines and have been identified as causes of renal inflammation and fibrosis [32,33]. Hepatic steatosis is now also considered to be a component of MetS [34] and has an association with advanc- ing CKD [35]. Hence, these earlier reports may provide expla- nations for our findings. Diabetes is also an important factor, has a strong association with cystatin C [36,37], and is one of the non-GFR determinants for eGFRcys [12]. Tsai et al. [13]
showed that the prevalence of reduced kidney function was al- most three times higher in persons with diabetes compared to those without diabetes (eGFRcys 22.0% vs. 7.9%, eGFRcr 16.5% vs. 5.8%). However, in our study, there was no signifi- cant difference in the prevalence of reduced kidney function compared to preserved kidney function in subjects with high fasting glucose. Additionally, the percentage of reduced kidney function by eGFRcys (3.6%) was higher than that by eGFRcr (2.0%) in those with high fasting glucose, but showed a weak significance. The possible reason for this finding might be that enrolled subjects in this study were mostly healthy and hyper- glycemia was defined by fasting glucose only. Therefore, the
number of actual diabetic patients would be very small in our data.
In comparison of relative risk of reduced kidney function for prevalence of MetS, eGFRcys was also higher than eGFRcr in a non-adjusted model, although it was attenuated after adjust- ing for the non-GFR determinants of both filtration markers in- cluding age, sex, abdominal obesity, and high fasting glucose.
The eGFRcr-cys has been suggested as a useful and confir- matory test for CKD, because it performed better than equa- tions based on either of these markers alone [10,15,21]. In this study, the values of eGFRcr-cys were higher than those of eG- FRcr but lower than those of eGFRcys in all performed analy- ses. These results support suggestion that the combination of creatinine and cystatin C is a more accurate tool for eGFR due to over-estimation using cystatin C alone or under-estimation using creatinine alone.
Our study has some limitations. First, serum cystatin C and creatinine were measured only once. Second, direct-measured GFR was not performed, and we could not compare direct- measured GFR with eGFR as determined by the three equa- tions to assess approximation to true kidney function. Third, we could not analyze social data such as exercise, diet, smok- ing, and medication use for previously diagnosed hypertension and/or hyperlipidemia, which could affect the prevalence of MetS and its related components, and serum levels of creati- nine and cystatin C.
In conclusion, the prevalence of reduced kidney function by eGFR was significantly increased in subjects with MetS and its related components. eGFRcys and eGFRcr-cys were superior to eGFRcr in detecting the prevalence of reduced kidney func- tion.
CONFLICTS OF INTEREST
No potential conflict of interest relevant to this article was re- ported.
ACKNOWLEDGMENTS
This study was supported by a Clinical Research Grant (2015) of Pusan National University Yangsan Hospital.
ORCID
Yang Ho Kang http://orcid.org/0000-0002-1215-7975 Seok Man Son http://orcid.org/0000-0002-3878-9030
REFERENCES
1. Alberti KG, Zimmet P, Shaw J; IDF Epidemiology Task Force Consensus Group. The metabolic syndrome: a new worldwide definition. Lancet 2005;366:1059-62.
2. Ford ES. Risks for all-cause mortality, cardiovascular dis- ease, and diabetes associated with the metabolic syndrome:
a summary of the evidence. Diabetes Care 2005;28:1769-78.
3. Obunai K, Jani S, Dangas GD. Cardiovascular morbidity and mortality of the metabolic syndrome. Med Clin North Am 2007;91:1169-84.
4. Chen J, Muntner P, Hamm LL, Jones DW, Batuman V, Fon- seca V, et al. The metabolic syndrome and chronic kidney disease in U.S. adults. Ann Intern Med 2004;140:167-74.
5. Kurella M, Lo JC, Chertow GM. Metabolic syndrome and the risk for chronic kidney disease among nondiabetic adults. J Am Soc Nephrol 2005;16:2134-40.
6. Kanauchi M, Kanauchi K, Kimura K, Inoue T, Saito Y. As- sociations of chronic kidney disease with the metabolic syndrome in non-diabetic elderly. Nephrol Dial Transplant 2006;21:3608-9.
7. Ferguson MA, Waikar SS. Established and emerging mark- ers of kidney function. Clin Chem 2012;58:680-9.
8. Chew-Harris JS, Florkowski CM, George PM, Elmslie JL, Endre ZH. The relative effects of fat versus muscle mass on cystatin C and estimates of renal function in healthy young men. Ann Clin Biochem 2013;50(Pt 1):39-46.
9. Laterza OF, Price CP, Scott MG. Cystatin C: an improved estimator of glomerular filtration rate? Clin Chem 2002;48:
699-707.
10. Inker LA, Schmid CH, Tighiouart H, Eckfeldt JH, Feldman HI, Greene T, et al. Estimating glomerular filtration rate from serum creatinine and cystatin C. N Engl J Med 2012;
367:20-9.
11. Tangri N, Stevens LA, Schmid CH, Zhang YL, Beck GJ, Greene T, et al. Changes in dietary protein intake has no ef- fect on serum cystatin C levels independent of the glomeru- lar filtration rate. Kidney Int 2011;79:471-7.
12. Stevens LA, Schmid CH, Greene T, Li L, Beck GJ, Joffe MM, et al. Factors other than glomerular filtration rate af- fect serum cystatin C levels. Kidney Int 2009;75:652-60.
13. Tsai CW, Grams ME, Inker LA, Coresh J, Selvin E. Cys- tatin C- and creatinine-based estimated glomerular filtration rate, vascular disease, and mortality in persons with diabe- tes in the U.S. Diabetes Care 2014;37:1002-8.
14. Levey AS, Stevens LA, Schmid CH, Zhang YL, Castro AF
3rd, Feldman HI, et al. A new equation to estimate glomer- ular filtration rate. Ann Intern Med 2009;150:604-12.
15. Stevens LA, Coresh J, Schmid CH, Feldman HI, Froissart M, Kusek J, et al. Estimating GFR using serum cystatin C alone and in combination with serum creatinine: a pooled analysis of 3,418 individuals with CKD. Am J Kidney Dis 2008;51:395-406.
16. Expert Panel on Detection, Evaluation, and Treatment of High Blood Cholesterol in Adults. Executive summary of the third report of the National Cholesterol Education Pro- gram (NCEP) expert panel on detection, evaluation, and treatment of high blood cholesterol in adults (Adult Treat- ment Panel III). JAMA 2001;285:2486-97.
17. Grundy SM, Cleeman JI, Daniels SR, Donato KA, Eckel RH, Franklin BA, et al. Diagnosis and management of the metabolic syndrome: an American Heart Association/Na- tional Heart, Lung, and Blood Institute Scientific State- ment. Circulation 2005;112:2735-52.
18. Li C, Ford ES, Zhao G, Mokdad AH. Prevalence of pre-di- abetes and its association with clustering of cardiometabol- ic risk factors and hyperinsulinemia among U.S. adoles- cents: National Health and Nutrition Examination Survey 2005-2006. Diabetes Care 2009;32:342-7.
19. Bedogni G, Bellentani S, Miglioli L, Masutti F, Passalac- qua M, Castiglione A, et al. The fatty liver index: a simple and accurate predictor of hepatic steatosis in the general population. BMC Gastroenterol 2006;6:33.
20. Bedogni G, Kahn HS, Bellentani S, Tiribelli C. A simple index of lipid overaccumulation is a good marker of liver steatosis. BMC Gastroenterol 2010;10:98.
21. Grams ME, Juraschek SP, Selvin E, Foster MC, Inker LA, Eckfeldt JH, et al. Trends in the prevalence of reduced GFR in the United States: a comparison of creatinine- and cys- tatin C-based estimates. Am J Kidney Dis 2013;62:253-60.
22. Pattaro C, Riegler P, Stifter G, Modenese M, Minelli C, Pramstaller PP. Estimating the glomerular filtration rate in the general population using different equations: effects on classification and association. Nephron Clin Pract 2013;123:
102-11.
23. Vupputuri S, Fox CS, Coresh J, Woodward M, Muntner P.
Differential estimation of CKD using creatinine- versus cystatin C-based estimating equations by category of body mass index. Am J Kidney Dis 2009;53:993-1001.
24. Coresh J, Selvin E, Stevens LA, Manzi J, Kusek JW, Egg- ers P, et al. Prevalence of chronic kidney disease in the
United States. JAMA 2007;298:2038-47.
25. Shlipak MG, Sarnak MJ, Katz R, Fried LF, Seliger SL, Newman AB, et al. Cystatin C and the risk of death and car- diovascular events among elderly persons. N Engl J Med 2005;352:2049-60.
26. Sarnak MJ, Katz R, Stehman-Breen CO, Fried LF, Jenny NS, Psaty BM, et al. Cystatin C concentration as a risk fac- tor for heart failure in older adults. Ann Intern Med 2005;
142:497-505.
27. Shlipak MG, Katz R, Sarnak MJ, Fried LF, Newman AB, Stehman-Breen C, et al. Cystatin C and prognosis for car- diovascular and kidney outcomes in elderly persons without chronic kidney disease. Ann Intern Med 2006;145:237-46.
28. Marwyne MN, Loo CY, Halim AG, Norella K, Sulaiman T, Zaleha MI. Estimation of glomerular filtration rate using serum cystatin C in overweight and obese subjects. Med J Malaysia 2011;66:313-7.
29. Franca AK, Dos Santos AM, Salgado JV, Hortegal EV, da Silva AA, Salgado Filho N. Estimated visceral adipose tis- sue, but not body mass index, is associated with reductions in glomerular filtration rate based on cystatin C in the early stages of chronic kidney disease. Int J Nephrol 2014;2014:
574267.
30. Dharnidharka VR, Kwon C, Stevens G. Serum cystatin C is superior to serum creatinine as a marker of kidney function:
a meta-analysis. Am J Kidney Dis 2002;40:221-6.
31. Herget-Rosenthal S, Bokenkamp A, Hofmann W. How to estimate GFR-serum creatinine, serum cystatin C or equa- tions? Clin Biochem 2007;40:153-61.
32. Singh AK, Kari JA. Metabolic syndrome and chronic kid- ney disease. Curr Opin Nephrol Hypertens 2013;22:198- 203.
33. Bhowmik D, Tiwari SC. Metabolic syndrome and chronic kidney disease. Indian J Nephrol 2008;18:1-4.
34. Tarantino G, Saldalamacchia G, Conca P, Arena A. Non-al- coholic fatty liver disease: further expression of the meta- bolic syndrome. J Gastroenterol Hepatol 2007;22:293-303.
35. Marcuccilli M, Chonchol M. NAFLD and chronic kidney disease. Int J Mol Sci 2016;17.
36. Sahakyan K, Lee KE, Shankar A, Klein R. Serum cystatin C and the incidence of type 2 diabetes mellitus. Diabetolo- gia 2011;54:1335-40.
37. Sim EH, Lee HW, Choi HJ, Jeong DW, Son SM, Kang YH.
The association of serum cystatin C with glycosylated he- moglobin in Korean adults. Diabetes Metab J 2016;40:62-9.