D I A B E T E S & M E T A B O L I S M J O U R N A L
This is an Open Access article distributed under the terms of the Creative Commons Attribution Non-Commercial License (http://creativecommons.org/licenses/by-nc/4.0/) which permits unrestricted non-commercial use, distribution, and reproduction in any medium, provided the original work is properly cited.
Associations between Body Mass Index and Chronic Kidney Disease in Type 2 Diabetes Mellitus Patients:
Findings from the Northeast of Thailand
Sojib Bin Zaman1,2,3, Naznin Hossain4, Muntasirur Rahman5
1Faculty of Public Health, Khon Kaen University, Khon Kaen, Thailand,
2Maternal and Child Health Division, International Centre for Diarrhoeal Disease Research, Bangladesh (icddr,b), Dhaka, Bangladesh,
3Institute of Tropical Medicine and International Health Berlin, Charite-University Medicine, Berlin, Germany,
4Department of Pharmacology, Dhaka Medical College, Dhaka, Bangladesh,
5School of Public Health, University of Queensland, Brisbane, Australia
Background: Chronic kidney disease (CKD) has emerged as a public health burden globally. Obesity and long-term hyperglycae- mia can initiate the renal vascular complications in patients with type 2 diabetes mellitus (T2DM). This study aimed to investigate the association of body mass index (BMI) with the CKD in patients with T2DM.
Methods: This study has used retrospective medical records, biochemical reports, and anthropometric measurements of 3,580 T2DM patients which were collected between January to December 2015 from a district hospital in Thailand. CKD was defined according to the measurement of estimated glomerular filtration rate (<60 mL/min/1.73 m2). Multiple logistic regression analysis was used to explore the association between BMI and CKD in patients with T2DM.
Results: The mean age of the participants was 60.86±9.67 years, 53.68% had poor glycaemic control, and 45.21% were overweight.
About one-in-four (23.26%) T2DM patients had CKD. The mean BMI of non-CKD group was slightly higher (25.30 kg/m2 vs.
24.30 kg/m2) when compared with CKD patients. Multivariable analysis showed that older age, female sex, hypertension, and mi- croalbuminuria were associated with the presence of CKD. No association was observed between CKD and poorly controlled gly- cosylated hemoglobin or hypercholesterolemia. Adjusted analysis further showed overweight and obesity were negatively associ- ated with CKD (adjusted odds ratio [AOR], 0.73; 95% confidence interval [CI], 0.58 to 0.93) and (AOR, 0.53; 95% CI, 0.35 to 0.81), respectively.
Conclusion: The negative association of BMI with CKD could reflect the reverse causality. Lower BMI might not lead a diabetic patient to develop CKD, but there are possibilities that CKD leads the patient to experience reduced BMI.
Keywords: Body mass index; Diabetes mellitus, type 2; Kidney diseases
Corresponding author: Sojib Bin Zaman https://orcid.org/0000-0002-3043-7954 Maternal and Child Health Division, International Centre for Diarrhoeal Disease Research, Bangladesh (icddr,b), GPO Box 128, Dhaka 1000, Bangladesh E-mail: [email protected]
INTRODUCTION
Type 2 diabetes mellitus (T2DM) has emerged as a global pan- demic in the 21st century [1]. Chronic kidney disease (CKD) is a frequent microvascular complication among the diabetic patients [2,3]. CKD is the leading cause to develop ‘end stage of renal diseases (ESRD)’ and very frequent to appear in patients
with T2DM both for the developed and developing countries [4]. For the South East Asian context, the prevalence of renal failure as a diabetic microvascular complication is quite high [5]. It is estimated that kidney disease as a complication of T2DM will eventually take the leading position of global dis- ease burden by the year 2030 [6].
As a country of Southeast Asia, Thailand has experienced https://doi.org/10.4093/dmj.2017.0052
pISSN 2233-6079 · eISSN 2233-6087
the effects of the epidemiological transition in recent years, and the prevalence of non-communicable diseases is rising [7].
Among the various reasons, behavioural factors like physical inactivity and increasing trend of junk food consumption are responsible for causing over-nutrition, which can gradually trigger microvascular complications in patients with diabetes mellitus (DM) [8]. Though it is not certain that all diabetic pa- tient will develop CKD, but the minimal damage to the kidney is frequent due to uncontrolled DM [9,10]. Another study sug- gested that age, sex, race, positive family history, high blood pressure, and dietary habit are the influencing factors for CKD [11]. Moreover, long-term hyperglycaemia due to uncon- trolled DM can play a vital role to initiate renal vascular dis- eases [12]. Therefore, it is always desirable to keep the glycae- mic state under control to prevent kidney disease for the pa- tients who have DM [13].
High body mass index (BMI) relates to metabolic disorders that can act as a risk factor for microvascular complication.
Therefore, obese patients are more likely to develop diabetic microvascular kidney complication when compared with the normal BMI patients [14]. However, a previous study found that the association of BMI with CKD is not straightforward in patients with T2DM [15]. Some epidemiological studies have found that overweight and obesity can be protective for some patients of the ESRD [16-18]. Besides, patients with high BMI might survive more during the dialysis stage of CKD [16-18].
A new terminology of survival paradox has appeared to ex- plain that patients with high BMI might survive well [19]
which is very controversial. This study will give us a good in- sight by investigating the above relationship in Thai popula- tion. To the best of our knowledge, the relationship of obesity with CKD has not been fully explored in Northeastern Thai- land. Therefore, this study aims to explore the association be- tween BMI and CKD among the diabetic patients in Thailand.
METHODS
Data source
The study population was T2DM patients who sought care in a large district hospital located in the northeast of Thailand. The hospital has been maintaining a diabetic registry under an on- going screening program for more than a decade. Based on this clinical registry, we have extracted the hospital record of 3580 T2DM who attended the hospital between January 1, 2015 and December 30, 2015. This study has also collected
three consecutive monthly records of estimated glomerular fil- tration rate (eGFR) of a T2DM patient to determine the pres- ence of CKD. Patients above 18 years were enrolled in this study. All the information related to patient’s anthropometric measurement and biochemical tests were taken at the same time during a patient’s hospital visit. Fasting blood samples were used to report glycosylated hemoglobin (HbA1c) and lip- id profile for the individual patient.
Data management
A medical record number (MRN) was used as a unique identi- fier to retrieve the hospital records across the hospital’s elec- tronic system. One MRN was linked with three datasets. First one was the clinical data where medical diagnosis, treatment, and anthropometric measurements were recorded. The second dataset contained the demographic information that was col- lected by accessing the patient’s health card. The laboratory staff prepared the third data set for this study. Data entry was done by a group of skilled data operator under the supervision of a data management officer (DMO). All the entered data were verified by DMO to detect the entry errors and inconsis- tencies. Error data were cross-checked with the laboratory re- cords and clinical case recording forms. Physical measure- ments were recorded twice to minimize the observer error, and quality of biochemical tests was maintained by ensuring the regular quality control check of the laboratory.
Definition of variables and measurement
CKD was defined based on the eGFR value according to the
‘National Kidney Foundation-Kidney Disease Outcomes Qual- ity Initiative (NKF-KDOQI)’ which states that “GFR less than 60 mL/min/1.73 m2 for 3 months with or without the other signs of kidney damage” [20]. This study has used the ‘Chronic Kidney Disease Epidemiology Collaboration (CKD-EPI)’
equation to estimate the eGFR and we have used CKD staging (stage 1 to 5 based on eGFR). Participant’s age was categorized into two subgroups based on the Thai retirement age. For the detection of the poor glycaemic control, this study has used the World Health Organization (WHO) recommendation to con- sider HbA1c >6.5% as a cut-off point [21]. BMI was classified into four different categories according to WHO recommend- ed BMI classification: underweight (<18.50 kg/m2), normal (18.50 to 24.99 kg/m2), overweight (25.00 to 29.99 kg/m2), and obese (≥30.00 kg/m2) [22]. Hypertension was defined by mea- suring the average systolic (≥140 mm Hg) and/or diastolic
blood pressure (≥90 mm Hg) or positive history of taking the antihypertensive drugs [23]. Microalbuminuria was defined according to ‘American Diabetic Association Classification of Microalbuminuria’ if the excretion rate of albumin is from 30 to 300 mg/day of urine collection for a patient. Low density li- poprotein cholesterol (LDL-C) was categorized into normal or high (LDL-C ≥130 mg/dL) based on ‘American Association of Clinical Endocrinologists’ guideline [24].
Statistical analysis
Descriptive statistics were used to present the categorical and continuous variables. The difference between CKD and the non-CKD group was examined by performing the chi-square test. Bivariable and multiple logistic regression analysis were used to explore the association of CKD with known risk fac- tors including BMI. We have simultaneously used all the po- tential risk factors in the model during the adjusted analysis.
STATA version 13 (StataCorp, College Station, TX, USA) was used for data analysis [25], and a cut-off value of 0.05 was con- sidered as statistical significance.
Ethics statement
The Ethical Committee of Khon Kaen University (KKU) ap- proved this study (approval no. HE2247). Anonymous hospital data were analysed, and all participants provided informed consent to be included in the hospital registry. Hence, the In- stitutional Review Board of KKU exempted the study team from obtaining consents from individual patients.
RESULTS
Participant’s characteristics
Table 1 outlines the general features of the study participants.
The mean age was 60.86±9.67 years, and male to female ratio was 1.00:1.80. Their primary occupation was farming (60.02%), 11.26% were unemployed, while about one-thirds (28.72%) were engaged in different types of employment.
Nearly half of T2DM patients (54.79%) had normal BMI, while one-thirds were overweight (34.81%) and one of 10 patients were obese (10.40%). About 42.74% of the T2DM patient was hypertensive, and 53.68% had poor glycaemic control. High LDL-C and microalbuminuria were present among 24.34%
and 62.70% patients, respectively. About one-quarter of the T2DM patients (23.26%) were diagnosed as CKD cases.
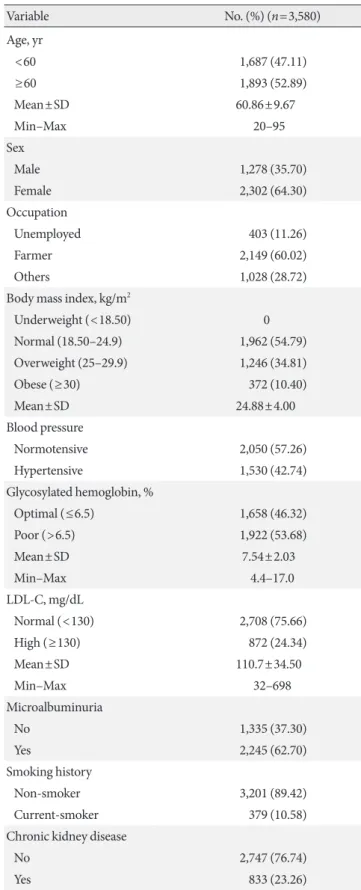
Table 1. General characteristic of study participants
Variable No. (%) (n=3,580)
Age, yr
<60 1,687 (47.11)
≥60 1,893 (52.89)
Mean±SD 60.86±9.67
Min–Max 20–95
Sex
Male 1,278 (35.70)
Female 2,302 (64.30)
Occupation
Unemployed 403 (11.26)
Farmer 2,149 (60.02)
Others 1,028 (28.72)
Body mass index, kg/m2
Underweight (<18.50) 0
Normal (18.50–24.9) 1,962 (54.79) Overweight (25–29.9) 1,246 (34.81)
Obese (≥30) 372 (10.40)
Mean±SD 24.88±4.00
Blood pressure
Normotensive 2,050 (57.26)
Hypertensive 1,530 (42.74)
Glycosylated hemoglobin, %
Optimal (≤6.5) 1,658 (46.32)
Poor (>6.5) 1,922 (53.68)
Mean±SD 7.54±2.03
Min–Max 4.4–17.0
LDL-C, mg/dL
Normal (<130) 2,708 (75.66)
High (≥130) 872 (24.34)
Mean±SD 110.7±34.50
Min–Max 32–698
Microalbuminuria
No 1,335 (37.30)
Yes 2,245 (62.70)
Smoking history
Non-smoker 3,201 (89.42)
Current-smoker 379 (10.58)
Chronic kidney disease
No 2,747 (76.74)
Yes 833 (23.26)
SD, standard deviation; LDL-C, low density lipoprotein cholesterol.
CKD (−) T2DM group
Association of BMI with CKD in patients with T2DM Fig. 1 describes the BMI distribution among the T2DM pa- tients by CKD status. Mean BMI of the non-CKD group was slightly higher than CKD group (25.30 kg/m2 vs. 24.30 kg/m2), Fig. 2 shows the normal distribution of eGFR categories ac- cording to optimal BMI, overweight, and obese condition among the patients with T2DM.
Table 2 demonstrates the association of CKD with different risk factors. In the bivariate analysis, higher age (crude odds ratio [COR], 4.12; 95% confidence interval [CI], 5.28 to 5.87), female sex (COR, 1.41; 95% CI, 1.12 to 2.18), hypertension
(COR, 1.97; 95% CI, 1.19 to 2.51), and microalbuminuria (COR, 1.73; 95% CI, 1.40 to 2.14) showed statistically signifi- cant positive association with CKD. On the other hand, com- pared to unemployment status, being farmer (COR, 0.71; 95%
CI, 0.32 to 0.91) or employed in other areas (COR, 0.21; 95%
CI, 0.15 to 0.26) and compared to normal BMI, being over- weight (COR, 0.69; 95% CI, 0.58 to 0.81) or obese (COR, 0.49;
95% CI, 0.37 to 0.65) were negatively associated with CKD, and the association was statistically significant. We did not find any significant association for poorly controlled HbA1c, high LDL-C, and smoking history with CKD.
In multivariable analysis, CKD was negatively associated with high BMI: overweight, (adjusted odds ratio [AOR], 0.73;
95% CI, 0.58 to 0.93) and obese (AOR, 0.53; 95% CI, 0.35 to 0.81) in this study. On the other hand, older age, female sex, hypertension, and microalbuminuria showed positive associa- tion of CKD (P<0.05).
DISCUSSION
This study observed a significant negative association between higher BMI and CKD among T2DM patients. On the contrary to expectation, the measure of BMI was found lower among the CKD patients’ than the non-CKD group. Our observed negative association of CKD with BMI could be demonstrated by the fact that CKD patients usually lose their weight. More- over, there are high chances of reverse causation, which can be Fig. 1. Distribution of mean body mass index (BMI) values
among type 2 diabetes mellitus patients by chronic kidney dis- ease (CKD) status. CKD (–), non-CKD patient; CKD (+), CKD patient. aP<0.05.
40 35 30 25 20 15 BMI (kg/m2 )
CKD (−)
BMI distribution according to CKD status CKD (+) P=0.0001a
Fig. 2. Distribution of estimated glomerular filtration rate (eGFR) categories (by chronic kidney disease [CKD]) according to body mass index (BMI) classification. T2DM, type 2 diabetes mellitus.
eGFR 1
CKD (+) T2DM group Distribution of eGFR categories by BMI classification
Normal BMI Overweight Obese
eGFR 2 eGFR 3 eGFR 4 eGFR 5
739
683
492
42 6
540
465
217
21 3
196
124
46 5 1
explained that CKD patients might receive special attention and treatment from the health care system, and their adher- ence to healthy diet intake and good lifestyle might reduce ex- tra calories and carbohydrates. Another explanation could be that CKD patients usually develop anaemia and their nutri- tional status can also in decline [19].
There is plenty of evidence showing obesity as a risk factor of CKD. For example, the findings of Framingham study cohort
reported that high BMI could predict the reduced kidney function independently [26]. Therefore, our results do not sup- port the Framingham cohort study. However, using BMI to know the status of CKD for T2DM patients can be problemat- ic. These diabetic patients not only tend to lose muscle mass but also experience increased body fat at the same time. As BMI cannot differentiate between the body muscle and the body fat; therefore, BMI should not be used as a reliable indi- Table 2. Association of CKD with different risk factors including BMI among type 2 diabetes mellitus patients
Characteristic Non-CKD (n=2,747) CKD (n=833) COR (95% CI) AOR (95%CI)a
Age, yr
≤60 1,465 (53.35) 221 (26.58) 1.00 1.00
>60 1,282 (46.65) 612 (73.42) 4.12 (5.28–5.87)b 3.95 (2.53–5.82)b
Sex
Male 1,175 (42.76) 376 (45.13) 1.00 1.00
Female 1,572 (57.24) 457 (54.87) 1.41 (1.12–2.18)b 1.27 (1.12–2.02)b
Occupation
Unemployed 278 (10.12) 136 (16.34) 1.00 1.00
Farmer 1,271 (46.27) 413 (49.55) 0.71 (0.32–0.91)b 0.69 (0.42–0.93)
Others 1,198 (43.61) 284 (34.11) 0.21 (0.15–0.26)b 0.58 (0.32–0.87)
Body mass index
Normal range 1,405 (51.14) 541 (64.98) 1.00 1.00
Overweight 1,002 (36.47) 229 (27.48) 0.69 (0.58–0.81)b 0.73 (0.58–0.93)b
Obese 340 (12.39) 63 (7.54) 0.49 (0.37–0.65)b 0.53 (0.35–0.81)b
Glycosylated hemoglobin
Optimal control 897 (32.64) 340 (40.79) 1.00 1.00
Poor control 1,850 (67.36) 493 (59.21) 1.03 (0.67–1.12) 1.12 (0.83–1.52)
Blood pressure
Normotensive 1,255 (45.69) 272 (32.61) 1.00 1.00
Hypertensive 1,492 (54.31) 561 (67.39) 1.97 (1.19–2.51)b 1.43 (1.02–2.11)b
LDL-C
Normal 1,881 (68.46) 551 (66.13) 1.00 1.00
High 866 (31.54) 282 (33.87) 1.06 (0.63–1.71) 1.12 (0.88–1.47)
Microalbuminuria
No 1,336 (48.65) 351 (42.11) 1.00 1.00
Yes 1,411 (51.35) 482 (57.89) 1.73 (1.40–2.14)b 1.79 (1.41–2.27)b
Smoking history
Non-smoker 2,537 (92.37) 755 (90.58) 1.00 1.00
Current-smoker 210 (7.63) 78 (9.42) 0.92 (0.61–1.41) 0.81 (0.47–1.09)
Values are presented as number (%).
CKD, chronic kidney disease; BMI, body mass index; COR, crude odds ratio; CI, confidence interval; AOR, adjusted odds ratio; LDL-C, low density lipoprotein cholesterol.
aAdjustment for age, sex, occupation, glycosylated hemoglobin, LDL-C, BMI, and smoking, bP<0.05.
cator of CKD for T2DM patients [27].
Previous research mainly focusing on the longitudinal study has argued that obese person can experience a good survival outcome, particularly who are with cardiovascular and/or re- nal disease [28]. This statement is neither completely under- stood nor universally accepted in the research community;
hence, this phenomenon is known as obesity paradox. This theory of obesity paradox found in a longitudinal study [19]
hypotheses that high BMI might enable a patient to be protect- ed from various metabolic illnesses by utilizing energy stores from their body. Therefore, an abrupt decline in body muscle over a period could be linked to reducing the survival in CKD patients [19]. One study showed that a reduction in the content of body fat over a 6-month period was associated with higher mortality in patients with maintenance haemodialysis [17].
However, it is difficult to compare our study with above-men- tioned association of obesity and CKD as our findings are based on retrospective cross-sectional study.
The global distribution of kidney disease does not share the same epidemiological feature, and it varies by geographical as- pects, ethnicity, and racial consideration [29]. This study found that increased age was associated with renal insufficiency which corresponded with a previous study finding [30]. In this study, the mean of BMI was 24.88 kg/m2 among the T2DM pa- tients. After applying the WHO recommended BMI classifica- tion (overweight: BMI ≥25.00 kg/m2 and obese ≥30.00 kg/
m2), the overweight and obese T2DM patients were found 34.81% and 10%, respectively (27.48% overweight, and 7.54%
obese among the T2DM with CKD). The finding was consis- tent and contextual, after taking consideration of another study, which found that about 50% of participants of a selected area in Taiwan were accounted as overweight and obese [31].
Considering the other risk factors of CKD, degenerative changes of the renal glomerular tissue is found as frequent among the older age group [30]. The number of female pa- tients with CKD was more when compared with their male counterparts. Our findings are similar to other large-scale studies where old age and female sex were found as a risk fac- tor of CKD [11,32]. Our study found that T2DM patients with hypertension had 1.4 times high chances to get CKD which is similar to a previous report [33]. Moreover, diabetic patients with higher microalbuminuria were 1.7 times more likely to have CKD, which corresponds to an earlier study [34]. To the best of our knowledge, this was the first initiative to analyze the individual relationship between BMI and diabetic CKD in the
northeast of Thailand.
However, this study has experienced certain limitations. It was a monocentric study, and this study could not collect rele- vant information on food habit, behaviour, duration of T2DM, first-time identification of DM, medication use like lipid-low- ering drugs, and adherence to treatment. This study did not consider other comorbidities like chronic obstructive pulmo- nary disease, heart failure, or malignancies which are contribu- tory factors for weight change due to unconfirmed diagnosis.
Therefore, residual confounding might influence the study findings. The results of this cross-sectional study should be in- terpreted with caution due to the usual cause and effect dilem- ma. However, this study has used a large volume of sample and high-quality data to come up with the finding.
Finally, the negative association of BMI with CKD in pa- tients with T2DM might reflect the reverse causality. Lower BMI might not contribute to CKD, but there are probabilities that CKD can lead to the reduced BMI. Therefore, longitudinal studies are required to explore the actual relationship of BMI with the development of diabetic CKD.
CONFLICTS OF INTEREST
No potential conflict of interest relevant to this article was re- ported.
ACKNOWLEDGMENTS
This research was partially supported by the German Academ- ic Exchange Service (DAAD). We would like to thank Profes- sor Frank P. Schelp, Pattara Sanchaisuriya, Benja Muktabhant, and Wongsa Laohasiriwong for their guidance. The authors are grateful to Mr. Samak Sornpiron and other staffs of the partici- pating hospital. We would also like to place our gratitude to Petra Meyer (DAAD), Ina Hammesfahr and Marta Gogluska (Institute of Tropical Medicine and International Health Ber- lin), Pootsadee kaiyawong, and Jidapa Phl (Khon Kaen Uni- versity) for their excellent administrative support.
REFERENCES
1. WHO Expert Consultation. Appropriate body-mass index for Asian populations and its implications for policy and interven- tion strategies. Lancet 2004;363:157-63.
2. Levey AS, Coresh J. Chronic kidney disease. Lancet 2012;379:
165-80.
3. Schneider C, Coll B, Jick SS, Meier CR. Doubling of serum cre- atinine and the risk of cardiovascular outcomes in patients with chronic kidney disease and type 2 diabetes mellitus: a co- hort study. Clin Epidemiol 2016;8:177-84.
4. Chittinandana A. Thailand renal replacement therapy registry (TRT Registry) report. J Nephrol Soc Thai 2000;6:250-5.
5. van Dieren S, Beulens JW, van der Schouw YT, Grobbee DE, Neal B. The global burden of diabetes and its complications: an emerging pandemic. Eur J Cardiovasc Prev Rehabil 2010;17 Suppl 1:S3-8.
6. Shaw JE, Sicree RA, Zimmet PZ. Global estimates of the preva- lence of diabetes for 2010 and 2030. Diabetes Res Clin Pract 2010;87:4-14.
7. Zaman SB. Detection of chronic kidney disease by using differ- ent equations of glomerular filtration rate in patients with type 2 diabetes mellitus: a cross-sectional analysis. Cureus 2017;9:
e1352.
8. Muktabhant B, Sanchaisuriya P, Sarakarn P, Tawityanon W, Tr- akulwong M, Worawat S, Schelp FP. Use of glucometer and fasting blood glucose as screening tools for diabetes mellitus type 2 and glycated haemoglobin as clinical reference in rural community primary care settings of a middle income country.
BMC Public Health 2012;12:349.
9. Rossing K, Christensen PK, Hovind P, Tarnow L, Rossing P, Parving HH. Progression of nephropathy in type 2 diabetic pa- tients. Kidney Int 2004;66:1596-605.
10. Rossing P, Rossing K, Jacobsen P, Parving HH. Unchanged in- cidence of diabetic nephropathy in IDDM patients. Diabetes 1995;44:739-43.
11. Zaman SB, Hossain N, Rahman AE, Islam SMS. Can glycated hemoglobin act as a reliable glycemic indicator in patients with diabetic chronic kidney disease? Evidence from the Northeast of Thailand. Med J Indones 2017;26:102-8.
12. Bhutani J, Bhutani S. Worldwide burden of diabetes. Indian J Endocrinol Metab 2014;18:868-70.
13. Zaman SB, Karim MA, Hossain N, Al Kibria GM, Islam SMS.
Plasma triglycerides as a risk factor for chronic kidney disease in type 2 diabetes mellitus: evidence from northeastern Thai- land. Diabetes Res Clin Pract 2018;138:238-45.
14. Bae JP, Lage MJ, Mo D, Nelson DR, Hoogwerf BJ. Obesity and glycemic control in patients with diabetes mellitus: analysis of physician electronic health records in the US from 2009-2011.
J Diabetes Complications 2016;30:212-20.
15. Agarwal R, Light RP. Relationship between glycosylated hemo-
globin and blood glucose during progression of chronic kidney disease. Am J Nephrol 2011;34:32-41.
16. Johansen KL, Young B, Kaysen GA, Chertow GM. Association of body size with outcomes among patients beginning dialysis.
Am J Clin Nutr 2004;80:324-32.
17. Kalantar-Zadeh K, Kuwae N, Wu DY, Shantouf RS, Fouque D, Anker SD, Block G, Kopple JD. Associations of body fat and its changes over time with quality of life and prospective mortality in hemodialysis patients. Am J Clin Nutr 2006;83:202-10.
18. Kalantar-Zadeh K, Abbott KC, Salahudeen AK, Kilpatrick RD, Horwich TB. Survival advantages of obesity in dialysis patients.
Am J Clin Nutr 2005;81:543-54.
19. Mafra D, Guebre-Egziabher F, Fouque D. Body mass index, muscle and fat in chronic kidney disease: questions about sur- vival. Nephrol Dial Transplant 2008;23:2461-6.
20. Hogg RJ, Furth S, Lemley KV, Portman R, Schwartz GJ, Coresh J, Balk E, Lau J, Levin A, Kausz AT, Eknoyan G, Levey AS; Na- tional Kidney Foundation’s Kidney Disease Outcomes Quality Initiative. National Kidney Foundation’s Kidney Disease Out- comes Quality Initiative clinical practice guidelines for chronic kidney disease in children and adolescents: evaluation, classifi- cation, and stratification. Pediatrics 2003;111:1416-21.
21. WHO Guidelines Approved by the Guidelines Review Com- mittee. Use of glycated haemoglobin (HbA1c) in the diagnosis of diabetes mellitus: abbreviated report of a WHO Consulta- tion. Geneva: World Health Organization; 2011.
22. World Health Organization: BMI classification. Available from:
http://apps.who.int/bmi/index.jsp?introPage=intro_3.html (updated 2018 Mar 29).
23. Domrongkitchaiporn S, Sritara P, Kitiyakara C, Stitchantrakul W, Krittaphol V, Lolekha P, Cheepudomwit S, Yipintsoi T. Risk factors for development of decreased kidney function in a Southeast Asian population: a 12-year cohort study. J Am Soc Nephrol 2005;16:791-9.
24. Jellinger PS, Smith DA, Mehta AE, Ganda O, Handelsman Y, Rodbard HW, Shepherd MD, Seibel JA; AACE Task Force for Management of Dyslipidemia and Prevention of Atherosclero- sis. American Association of Clinical Endocrinologists’ guide- lines for management of dyslipidemia and prevention of ath- erosclerosis. Endocr Pract 2012;18 Suppl 1:1-78.
25. StataCorp: 2013 Stata Statistical Software: Release 13. College Station, TX: StataCorp LP. Available from: http://www.stata.
com/support/faqs/resources/citing-software-documentation- faqs/ (cited 2018 Mar 30).
26. Fox CS, Larson MG, Leip EP, Culleton B, Wilson PW, Levy D.
Predictors of new-onset kidney disease in a community-based population. JAMA 2004;291:844-50.
27. Janssen I, Katzmarzyk PT, Ross R. Waist circumference and not body mass index explains obesity-related health risk. Am J Clin Nutr 2004;79:379-84.
28. Galal W, van Domburg RT, Feringa HH, Schouten O, Elhendy A, Bax JJ, Awara AM, Klein J, Poldermans D. Relation of body mass index to outcome in patients with known or suspected coronary artery disease. Am J Cardiol 2007;99:1485-90.
29. Ramirez SP, McClellan W, Port FK, Hsu SI. Risk factors for proteinuria in a large, multiracial, Southeast Asian population.
J Am Soc Nephrol 2002;13:1907-17.
30. Rifkin DE, Shlipak MG, Katz R, Fried LF, Siscovick D, Chon- chol M, Newman AB, Sarnak MJ. Rapid kidney function de- cline and mortality risk in older adults. Arch Intern Med
2008;168:2212-8.
31. Lee PH, Chang HY, Tung CW, Hsu YC, Lei CC, Chang HH, Yang HF, Lu LC, Jong MC, Chen CY, Fang KY, Chao YS, Shih YH, Lin CL. Hypertriglyceridemia: an independent risk factor of chronic kidney disease in Taiwanese adults. Am J Med Sci 2009;338:185-9.
32. Jha V, Garcia-Garcia G, Iseki K, Li Z, Naicker S, Plattner B, Sa- ran R, Wang AY, Yang CW. Chronic kidney disease: global di- mension and perspectives. Lancet 2013;382:260-72.
33. Peralta CA, Hicks LS, Chertow GM, Ayanian JZ, Vittinghoff E, Lin F, Shlipak MG. Control of hypertension in adults with chronic kidney disease in the United States. Hypertension 2005;45:1119-24.
34. Glassock RJ. Is the presence of microalbuminuria a relevant marker of kidney disease? Curr Hypertens Rep 2010;12:364-8.
![Fig. 2. Distribution of estimated glomerular filtration rate (eGFR) categories (by chronic kidney disease [CKD]) according to body mass index (BMI) classification](https://thumb-ap.123doks.com/thumbv2/123dokinfo/5221412.123570/4.892.132.761.750.1036/distribution-estimated-glomerular-filtration-categories-disease-according-classification.webp)
