INTRODUCTION
People value happy, healthy and long lives. The effec- tive management of lifestyle and cognitive resources contributes to adaptation and enjoyment of old age. The elderly who maintain the best cognitive function are also those with a high level of social interaction.
It has been generally assumed that cognitive function declines in old age because of morphologic changes in cerebral tissue and decreases in circulatory capacity and neurotransmitters. Older people always perform more slowly than younger people in tasks involving neuro- muscular learning, because of slower reaction time and an increase in cautious behavior.
Cognitive functioning is a broad construct that in- cludes a number of categories: attention span, concen-
tration, intelligence, judgement, learning ability, memo- ry, orientation, perception, problem solving, psychomo- tor ability, reaction time, and social interaction (Ebersole
& Hess, 1998). While cognitive impairment is a severe threat to social function, the psychopathology of the el- derly is in turn influenced by socioenvironmental factors.
The decline of memory is the key component of demen- tia and one of the risk factors of age-related dementia (Park & Kim, 1997).
Much of cognitive impairment care is provided in the home by family members. The elderly who suffer from dementia and who need help in performing daily activi- ties become a burden to family members responsible for their care (Oh, 1995; Kang et al., 1999).
As the population ages, health problems of the elderly, including functional disorders and cognitive impairment, have become one of the most important social issues in
Prevalence of Cognitive Impairment and Related Factors Among the Elderly in
Rural Communities of Jeju Province
Keumja Ko, RN, PhD1, Min Jung, RN, PhD1, Sungchul Hong, MD, PhD2
1. Cheju Halla College 2. Cheju National University
Corresponding author: Min Jung, Cheju Halla College, Cheju Halla College, 690-708, Korea.
Tel: 82-64-741-7657 Fax: 82-64-741-7639 E-mail: [email protected] Received April 29, 2003 ; Accepted June 9, 2003
Purpose. The purpose of this study was to survey the prevalence rate of cognitive impairments and to identify the factors influencing cognitive impairment in the elderly in rural communities of Jeju Province..
Methods. 590 elderly in 6 rural communities of Jeju Province were interviewed, using a questionnaire consisting of sociodemographic characteristics, health behavior, quality of life, and MMSE-K
Results. Prevalence of cognitive impairment was 33.1% (39.1% of females, 16.76% of males). Prevalence of dementia was 12.4% (16.3% of females, 2.87% of males). Factors related to cognitive impairment were age, sex, education, standard of living, employment status, and subjective health state.
Conclusions. In community health care for the elderly, factors relating to cognitive impairment have to be con- sidered. When planning community health care, priority should be given to the elderly; who need care but live alone; who lack social support; who have a low standard of living; who experience discomfort in the activities of daily living; who believe they are not in a good state of health; or whose life satisfaction is low.
Key Words: Cognition Disorders, Dementia, Elderly, Rural Community.
Korea. The health problems of the elderly in rural com- munities not served by medical doctors are of particular concern. Therefore, it is necessary to determine and manage for cognitive impairment in the elderly, even if they are not diagnosed as suffering from dementia.
However, there are limited health care and social ser- vice systems and institutions available to the elderly suf- fering from dementia, and to their families. There is also a shortage of professional personnel and facilities. The systems that exist are not well integrated. Furthermore, the precise number and actual conditions of such people is not well known.
Dementia is usually regarded by lay people as a nor- mal aging process. The lack of social support and proper coping techniques increase the problems of the elderly with dementia, and their families.
It is very important to find out the influencing factors related to cognitive function plays a key role to maintain healthy lives of the aged and the prevalence of cognitive impairment of the aged was shown higher(Cho, Hahm, Jhoo, Bae, & Kwon, 1998; Park, Ko, Ha, Park, & Jung, 1991) than that in western coutries(Fratiglioni et al., 1991; Landerman, Blazer, & Anthony, 1991)
The aim of this study was to survey the rate of preva- lence of cognitive impairment, to investigate the factors influencing cognitive impairment, and to offer basic data useful for the prevention and management of cognitive impairment.
METHODS
Sample
The subjects of this study were residents 65 years old and older, selected randomly in six rural communities, using cluster sampling method. Three of the rural com- munities were in North Jeju County, and three were in South Jeju County. The total number of residents in these areas who were 65 years old and older was 779.
Of these, 189 were absent when the interviewer visited their houses, in a state of imminent death, or uncoopera- tive. A total of 590 people became subjects of this sur- vey.
Instruments
A structured questionnaire and MMSE-K instrument were used for the survey. The questionnaire contained 7 items of demographic characteristics, 4 items of health behavior, and 5 items regarding quality of life. MMSE-K
(the Korean version of the Mini Mental State Examination) was developed by Folstein, and modified and standardized by Kwon & Park (1989), to screen de- mentia in the elderly in Korea. MMSE-K is composed of 7 items and 30 points, i.e. 5 points for time orientation, 5 points for place orientation, 3 points for memory regis- tration, 3 points for memory recall, 5 points for attention and calculation, 7 points for verbal ability, and 2 points for comprehension and judgment.
Subjects were divided into 3 groups in accordance with the suggestion of Park, Park, & Ko (1991). The state of those who scored 25 points and higher was classified as “normal state”, of those who scored between 21 and 24 points as “doubtful dementia”, and or those scoring 20 points and lower as “confirmed dementia”. All those who scored 24 or fewer points were classified as having
“cognitive impairment”.
Procedure
Form October 3, 2001 to October 31, 2001, six re- search assistants collected data through interviews, using a questionnaire and the MMSE-K. These research assis- tants were the directors of 6 primary health care centers in areas not served by a medical doctor. The research as- sistants were educated in data collection protocol. While data were being collected, members of the research team met with research assistants to share opinions about the questionnaire and matters demanding special attention.
The directors who were chosen as assistants of this study had a good relationship with the subjects in their dis- tricts and knew well their conditions. Before started questioning the subjects of this study informed about this study and asked for their permission to participate.
And then subjects were interviewed at the nursing care center or in their own home. The directors read and ex- plained the questions for the subjects those who couldn’t read and understand and checked their response accord- ing to the questions.
Data analysis
The data were analyzed using the Statistical Package for Social Sciences.
The characteristics of the variable were analyzed using the actual number, percentage, Chi square, and Multiple Logistic Regression analysis.
RESULTS
The general characteristics of subjects are shown in Table 1. 590 subjects participated in this study. Of these, 174 (29.5%) were male, and 416 (70.5%) were female.
Distribution of subjects in the six geographical research areas was: Egue (20.5%), Kumak (16.9%), Sunheul
(15.3%), Gapa (12.0%), Shinphung (17.3%), and Kwangryung (19.0%). There are some gender differ- ences in marital status, residence, education and working state. The number of male subjects who were married was 158 out of 174 (90.8%) and the number of female subjects who were married was 118 out of 416 (28.4%).
And 91.6% of male subjects and only 57.7% of female subjects were living with spouse or offspring. More men
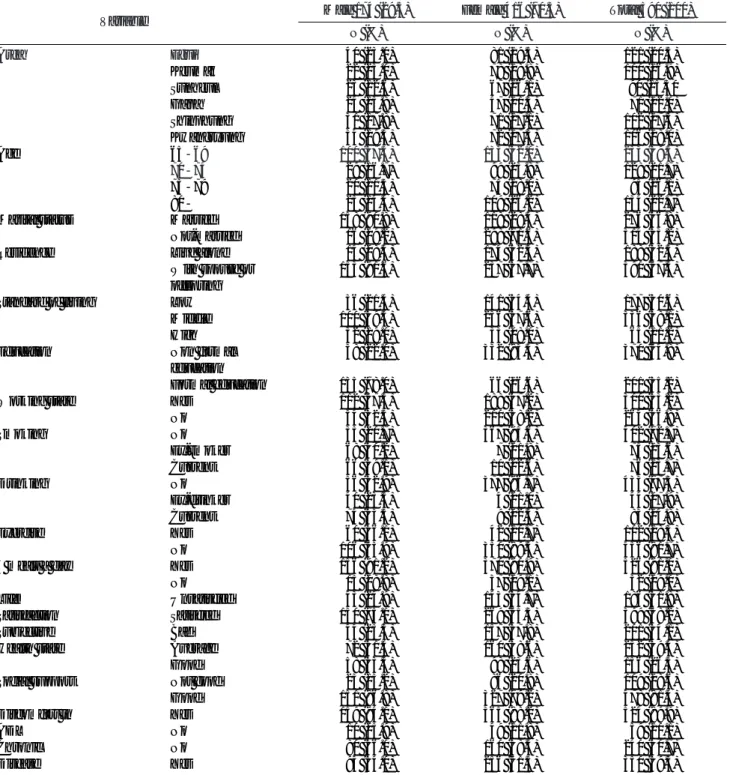
Table 1. General characteristics of subjects
Variable Male 174 (29.5) Female 416 (70.5) Total 590 (100)
N (%) N (%) N (%)
Area Egui 040 (23.0) 081 (19.5) 121 (20.5)
Keumak 022 (23.0) 078 (18.8) 100 (16.9)
Sunheul 023 (12.6) 067 (16.1) 090 (15.30
Gapa 024 (13.8) 047 (11.3) 071 (12.0)
Shinphung 031 (17.8) 071 (17.1) 102 (17.3)
Kwangryung 034 (19.5) 072 (17.3) 106 (18.0)
Age 65-69 100 (57.5) 133 (32.0) 233 (39.5)
70-74 029 (16.7) 099 (23.8) 128 (21.7)
75-79 020 (11.5) 075 (18.0) 095 (16.1)
80- 025 (14.4) 109 (26.2) 134 (22.7)
Marital status Married 158 (90.8) 118 (28.4) 276 (46.8)
Not-married 016 (09.2) 298 (71.6) 314 (53.2)
Residence Live alone 014 (08.4) 174 (42.3) 188 (32.5)
With spouse or 153 (91.6) 237 (57.7) 390 (67.5)
offspring
Standard of living Low 036 (21.4) 141 (34.4) 177 (30.6)
Middle 100 (59.5) 236 (57.6) 336 (58.1)
High 032 (19.0) 033 (08.0) 065 (11.2)
Education Non formal 038 (22.0) 332 (83.4) 370 (64.8)
education
Formal education 135 (78.0) 066 (16.6) 201 (35.2)
Working state Yes 112 (67.5) 188 (47.2) 300 (53.2)
No 054 (32.5) 210 (58.2) 264 (46.8)
Smoking No 035 (20.7) 367 (95.6) 402 (72.7)
Ex-smoker 068 (40.2) 007 (01.8) 075 (13.6)
Current 066 (39.1) 010 (02.6) 076 (13.7)
Drinking No 056 (32.9) 377 (96.7) 433 (77.3)
Ex-drinker 040 (23.5) 004 (01.0) 044 (07.9)
Current 074 (43.5) 009 (02.3) 083 (14.8)
Exercise Yes 060 (36.1) 042 (10.7) 102 (18.3)
No 106 (63.9) 350 (89.3) 456 (81.7)
3 meals a day Yes 156 (91.2) 370 (90.9) 526 (91.0)
No 015 (08.8) 037 (09.1) 052 (09.0)
Life Unsatisfied 043 (24.9) 143 (34.7) 186 (31.8)
Satisfaction Satisfied 130 (75.1) 269 (65.3) 399 (68.2)
Subjective Bad 044 (25.3) 157 (37.8) 201 (34.1)
Health state Average 072 (41.4) 160 (38.6) 232 (39.4)
Good 058 (33.3) 098 (23.6) 156 (26.5)
Social support Not good 023 (13.2) 086 (20.8) 109 (18.6)
Good 151 (86.8) 327 (79.2) 478 (81.4)
Discomfort in Yes 159 (94.1) 365 (88.2) 524 (89.9)
ADL No 010 (05.9) 049 (11.8) 059 (10.1)
Chronic No 080 (46.0) 160 (38.5) 240 (40.7)
Disease Yes 094 (54.0) 256 (61.5) 350 (59.3)
had formal education (78.0%) than women (16.6%).
The percentage of subjects those who were in working state, even though they were part time or intermittent job, was 53.2% (male 67.5%, female 47.2%). The per- centage of current drinker was 14.8%(male; 43.5%, fe- male; 0.2%). The percentage of current smoker was 13.7% (male; 40.2%, female; 0.26%). 18.3% of the subjects answered that they exercised (male; 36.1%, fe- male; 10.7%). 68.2% of the subjects of this survey re- sponded that they are satisfied with their lives, 81.4% of the subjects showed that they had good social support.
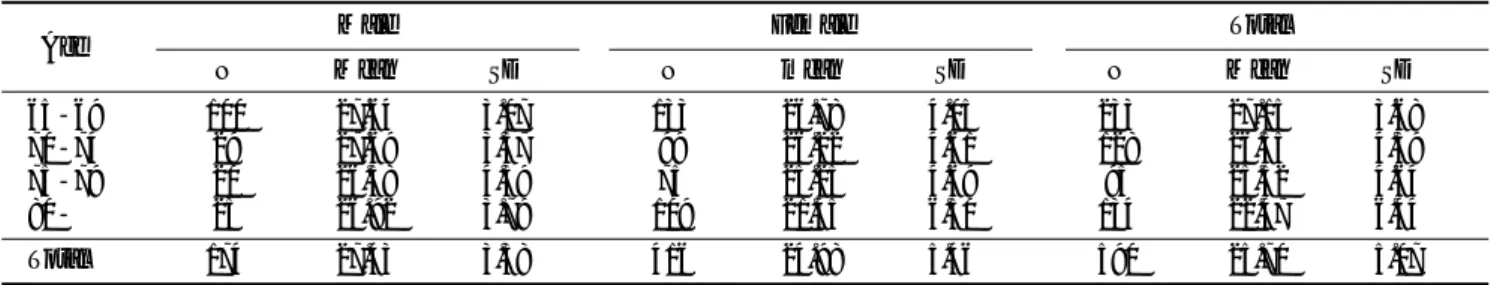
MMSE-K scores of the subjects by sex and age are shown in Table 2. The mean MMSE-K of subjects was 25.77 (SD=5.07). The mean MMSE-K of females (24.98) was lower than that of males (27.43). Especially among women, the older subjects tended to have higher scores.
The prevalence of cognitive impairment according to sex and age is shown in Table 3. The prevalence of cogni- tive impairment was shown as 33.3%, or 195 of 590 subjects, including 16.76% of males and 39.9% of fe- males. The incidence of cognitive impairment measured as MMSE-K 24 according to age group was: 65-69 (21.5%), 70-74 (28.1%), 75-79 (37.1%), and over 80 (55.2%).
The prevalence of dementia according to sex and age is shown in Table 4. The prevalence of dementia defined by MMSE 20 was 12.4% (2.87% of males and 16.3% of females). There is a gender difference in MMSE-K
scores.
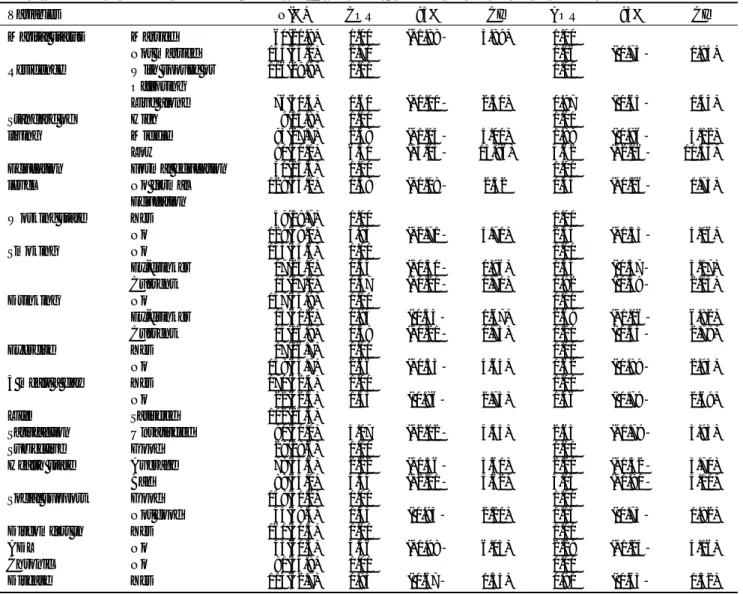
The prevalence of cognitive impairment and crude &
adjusted age and sex odds ratio by general characteristics using Chi-square tests & Logistic regression were shown in Table 5. The higher the standard of living, the less the cognitive impairment rate they had. Those who had for- mal education had higher rate of cognitive impairment rate than that of those who had no formal education.
This result seemed to be caused by the fact that most fe- male subjects (332 out of 398, 83.4%) had no formal education and adjusted by sex and age on this Chi- square test. Those who were in working state had less cognitive impairment rate than that of those who were not. Ex-drinker had higher cognitive impairment rate than current drinker’s. Those who had life satisfaction and no discomfort in ADL showed lower cognitive im- pairment rate than those who hadn’t and discomfort in ADL. The better subjective health state, the less cogni- tive impairment they had.
These significant factors, which had adjusted age and sex, related to prevalence of cognitive impairment, sex, age, and marital status were analyzed by using Multiple Logistic Regression. Table 6 shows Odds Ratio and 95%
confidential intervals for odds ratios for the level of sig- nificant factors: aged over 80=3.469 (95%CI 1.83- 6.57), female=4.070 (95%CI 2.09-7.94), no formal ed- ucation group=2.867 (95%CI 1.57-5.25), low standard of living group 3.484 (95%CI 1.46-8.34), working
Table 2. MMSE-K scores of subjects by sex & age (N=590)
Age Male Female Total
N Mean SD N mean SD N Mean SD
65-69 100 27.64 3.07 133 26.78 4.05 233 27.15 3.68
70-74 29 27.69 3.37 99 26.22 4.61 128 26.55 4.39
75-79 20 26.58 4.39 75 25.25 4.69 95 25.52 4.64
80- 25 26.92 3.79 109 21.45 6.50 134 22.47 6.44
Total 174 27.43 3.38 416 24.98 5.46 590 25.70 5.07
Table 3. Prevalence of Cognitive Impairment(MMSE-K ≤ 24) by sex & age
Age Male Female Total
N (%) N (%) N (%)
65-69 15 (15.00) 035 (26.3) 050 (21.5)
70-74 06 (20.69) 030 (30.3) 036 (28.1)
75-79 04 (21.05) 031 (41.3) 035 (37.2)
80- 04 (16.00) 070 (64.2) 074 (55.2)
Total 29 (16.76) 166 (39.9) 195 (33.1)
Table 4. Prevalence of Dimentia(MMSE-K ≤ 20) by sex & age
Age Male Female Total
N (%) N (%) N (%)
65-69 0 (0.00) 10 (07.5) 10 (04.3)
70-74 0 (0.00) 08 (08.1) 08 (06.3)
75-79 3 (15.00) 10 (13.3) 13 (13.7)
80- 2 (8.00) 40 (36.7) 42 (31.3)
Total 5 (2.87) 68 (16.3) 73 (12.4)
group 2.386 (95%CI 1.45-3.88), and bad subjective health status group 1.970 (95%CI 1.09-3.57).
DISCUSSION
Cognitive function in the aged is often measured against the norms of young or middle-aged people, which may not be appropriate to the distinctive charac- teristics of the aged. The elderly often perform poorly on test items because they are less likely to guess, and also less likely to answer items that seem ambiguous to them.
For this study, the prevalence of cognitive impairment was measured using the MMSE-K instrument. One or two points were added in certain instances to the mea- sured scores in this study, in accordance with the correc-
tion method developed by Kwon & Park(1989).
The prevalence of cognitive impairment in this study (MMSE-K≤24) was 33.1% (17.76% of males and 39.9% of females). This is higher than the 31.2% result of the study by Park et al. (1991) and lower than the 37.1% (18.8% of males and 47% of females) in the study by Cho et al. (1998). Compared with other coun- tries, the result of 33.1% is higher than that of the ECA’s American study (20%) (Landerman et al., 1991) and a Swedish study (21.3%)(Fratiglioni et al., 1991)
The prevalence of cognitive impairment (MMSE-K≤
24) was examined in four age groups. The results were:
21.5% in the 65-69 age group, 28.1% in the 70-75 group, 37.1% among those aged 75-79, and 55.2%
among those over 80. Cognitive function decreased with
Table 5. Prevalence of cognitive impairment(mmse-K ≤ 24) and crude & adjusted age and sex OR by General characteristics
Variables N(%) COR 95% CI AOR 95% CI
Marital status Married 060(21.8) 1.00 (*1.88- 3.89) 1.00
Not married 135(43.0) 2.70 1.16 ( 0.73- 01.84)
Residence With spouse or 116(29.8) 1.00 1.00
Offspring
Live alone 076(40.4) 1.60 (*1.11- 2.30) 0.97 ( 0.65- 01.44)
Standard of High 009(13.8) 1.00 1.00
living Middle 093(27.7) 2.38 (*1.13- 5.00) 1.88 ( 0.86- 04.12)
Low 090(51.1) 6.51 (*3.03- 13.96) 4.62 (*2.06- 10.35)
Education Formal education 051(25.4) 1.00 1.00
level No formal 129(35.0) 1.58 (*1.08- 2.32 0.44 (*0.26- 00.75)
Education
Working state Yes 059(19.7) 1.00 1.00
No 129(49.0) 3.93 (*2.71- 5.71) 2.35 (*1.53- 03.06)
Smoking No 143(35.6) 1.00 1.00
Ex-drinker 017(23.0) 0.54 (*0.30- 0.96) 1.34 ( 0.57- 03.17)
Current 013(17.1) 0.37 (*0.20- 0.70) 0.92 ( 0.39- 02.15)
Drinking No 147(33.9) 1.00 1.00
Ex-drinker 013(30.2) 0.84 ( 0.43- 1.67) 2.69 (*1.06- 06.82)
Current 014(16.9) 0.39 (*0.21- 0.73) 1.21 ( 0.53- 02.78)
Exercise Yes 017(16.7) 1.00 1.00
No 158(34.7) 2.66 (*1.53- 4.63) 1.62 ( 0.89- 02.93)
3 meals a day Yes 170(32.4) 1.00 1.00
No 022(42.3) 1.53 ( 0.86- 2.73) 1.46 ( 0.79- 02.69)
Life Satisfied 102(25.4)
Satisfaction Unsatisfied 090(51.1) 3.07 (*2.12- 4.45) 2.65 (*1.79- 03.93)
Subjective Good 029(18.6) 1.00 1.00
Health state Average 078(33.6) 2.22 (*1.36- 3.61) 2.21 (*1.32- 03.70)
Bad 088(44.0) 3.44 (*2.11- 5.62) 3.03 (*1.80- 05.10)
Social support Good 149(31.2) 1.00 1.00
Not good 043(39.4) 1.43 ( 0.93- 2.21) 1.15 ( 0.73- 01.82)
Discomfort in Yes 160(30.5) 1.00 1.00
ADL No 035(60.3) 3.46 (*1.98- 6.05) 2.28 (*1.24- 04.16)
Chronic No 081(33.8) 1.00 1.00
Disease Yes 114(32.7) 0.95 ( 0.67- 1.35) 0.91 ( 0.63- 01.32)
COR=Crude Odds Ratio, AOR=Adjusted Odds Ratio, CI=Confidence Interval
*p<0.05
age, especially in women. In men, there was no clear dis- tinction in cognitive function according to age groups.
The study by Cho et al.(1998) was divided into 5 age group: 65-69 (19.2% showing cognitive impairment);
70-74 (38.5%); 75-79 (57.8%); 80-84 (60.0%); and over age 85 (72.2%). Comparing those results, the de- cline of cognitive function among the elderly in Jeju pro- ceeded more slowly. Some people appear to further de- teriorate in terms of cognitive function, while others re- main in a long-term respite state. In our study, no reason was found for these differences. However, in order to ap- ply intervention to slow the progression of cognitive im- pairment, it is necessary to explore the reasons for, and underlying biosociological factors affecting differences in cognitive impairment. It is the limitation to our study that we didn’t find them out and we suggest that the fol- lowing study should focus on the reasons for, and factors affecting differences in cognitive impairment of the el- derly to be found out.
In this study, the prevalence of dementia (MMSE-K≤
20) was 12.4% (2.87% of males and 16.3% of females).
This result is higher than Woo et al.’s study(1997), which found dementia in 9.5% of subjects, Park et al (1991) with a result of 11.3% (7.2% of males and 15.4% of fe- males), and Hyun’s 2000 study (11.6% of subjects).
The factors related to cognitive impairment in the aged
differ from study to study. The results of this study showed that the factors influencing cognitive function among the elderly include age, sex, education, marital status, residence status, standard of living, amount of pocket money, smoking, drinking, exercise, social sup- port, life satisfaction, subjective health state, and discom- fort in activities of daily living.
Previous studies reported that the prevalence of cogni- tive impairment among the elderly, measured using the MMSE-K instrument, was influenced by many factors such as: education (Cho et al., 1998; Hyun, 2000; Kim, Ahn, Lee, & Kil, 2001; Park, 1989; Park et al., 1997;
Shim et al., 1999), age (Cho et al., 1998; Hyun, 2000;
Kim et al., 2001; Park et al., 1997; Park & Kim, 1997;
Shim et al., 1999) and sex difference (Cho et al., 1998; ; Hyun, 2000; Park et al., 1997; Shim et al., 1999). The relative risk of death among the elderly might be related to severe cognitive decline, male sex, and old age (Park, 1999). To preserve the cognitive function was to lessen the risk of death among the elderly and furthermore, to help maintain the well-being of the aged.
Dementia is a problem that occurs with aging. There is a gender difference in cognitive function because the av- erage life span of women is longer than that of men.
And as manifested in general characteristics, women fared worse than men in factors related to socioeconom- Table 6. Multiple Logistic regression analysis of the effects of general characteristics on caseness of cognitive impairment (MMSE-K ≤ 24)
Variables Parameter Standard Wald p-value Odds 95%
Estimate Error ChiSquare Ratio Confidence Interval
Age(years) 65-69
70-74 -0.091 0.305 0.089 0.765 0.913 0.502 1.660
75-79 0.406 0.331 1.504 0.220 1.501 0.784 2.874
80- 1.244 0.326 14.558 0.000** 3.469 1.831 6.572
Sex Male
Female 1.404 0.341 16.990 0.000** 4.070 2.088 7.935
Education Formal education
No formal edu. 1.053 0.308 11.657 0.001* 2.867 1.566 5.247
Standard of living High
Middle 0.572 0.425 1.806 0.179 1.771 0.769 4.077
Low 1.248 0.445 7.851 0.005** 3.484 1.455 8.342
Working state Yes
No 0.862 0.251 11.748 0.001** 2.368 1.446 3.876
Subjective health Good
status Average 0.462 0.288 2.568 0.109 1.587 0.902 2.793
Bad 0.678 0.302 5.050 0.025* 1.970 1.091 3.560
Marital status Married
Not married 0.112 0.275 0.167 0.683 1.119 0.653 1.916
Discomfort in No
ADL Yes 0.228 0.350 0.424 0.515 1.256 0.632 2.496
Intercept -7.883 1.134 48.346 0.000 0.000
* p<0.05, ** p<0.005
ic state, such as standard of living, marital status, resi- dence status, education etc.
A framework for intervention in the care of the elderly must be determined by particular conditions and indi- vidual needs. When planning community health care for the elderly, priority must be given to those who are vul- nerable to impaired cognitive function. In this study, those who are very old, lacking social support, with a low standard of living, or living along and in need of care have higher rate of cognitive impairment than that of those who are not. And those who think their health is not good, or whose satisfaction with life is low have higher rate of cognitive impairment than those who think their health is good, or whose satisfaction with life is high.
References
Cho, M. J., Hahm, B. J., Jhoo. J. H, Bae, J. N., & Kwon. J. S.
(1998). Prevalence of Cognitive Impairment and Depressive Symptoms among the Elderly in an Urban Community, J of Korean Neuropsychiatr Association, 37(2), 352-362.
Ebersole, P., & Hess, P. (1998). Toward Healthy Aging(5th ed). ST Louis: Mosby-Year Book, Inc.
Fratiglioni, L., Gurt, M., Forsell, Y., Viitanen, M., Grafstrom, M, Hohmen, K., Ericsson, K., Backman, L., Ahlbom, A., &
Winblad, B. (1991). Prevalence of Alzheimer’s disease and other dementias in an elderly urban population: Relationship with age, sex and education, Neurology, 41, 1886-1892.
Hyun, I. S. (2000). A study on the level of cognitive function by Minimental State Scale, J of the Korea Gerontological Society, 20(3), 51-59.
Kim, K. W., Ahn, S.Y., Lee, D.Y., & Kil, Y.N. (2001). The Influences of Education, Age, and Gender on the Korean ver- sion of Hasegawa Dementia Scale Scores, Yong-In Psychiatr Bull. 8(2), 152-158
Kang, H. S., Go, K. J., Kim, W.O., Kim, E. S., Khim, S. Y., Kim, H.
L., Shin, S. O., Oh, S. E., Won, J. S., Li, C. Y., Jung, M., &
Choe, N. H. (1999). The Lives of Daughters-in-Law Who Care for Parents with Dementia, J of Korean Acad of Nur, 29(6), 1233-1243
Kwon, Y. C., & Park, J. H. (1989). Korean Version of Mini-Mental State Examination(MMSE-K). part 1: Development of the Test for the Elderly, J of Korean Neuropsychiatr Association, 28(1), 125-135
Landerman, R., Blazer, D.G., & Anthony, J. G. (1991). Cognitive Impairment. In L. N. Robins & D. A. Regier(Eds), Psychiatric disorders in America: The epidemiologic Catchment Area Study(pp.291-327). New York : The Free Press.
Oh, J. J. (1995). A Study on Development of Health Care Services for the Demented Elderly in Korean,. Unpublished doctoral dissertation. Seoul National University
Park, E. H., Kim, S. K., Lee, W. K., Suh, Y.S., Kim, D. H., Shin, D., H., Shin., D., H., & Suh, S., K. (1997). Cognitive function, fam- ily function and depression in rural elderly, J of the Korean acad of family medicine, 18(8), 814-823.
Park, J. (1999). Cognitive function and Survival among The Elderly in a Rural Korean Community, Korean Neuropsychiatc Association, 38(1), 166-172.
Park, J., & Kim, H. C. (1997). Aging-Related Cognitive Decline, Keimyung University School of Medicine, 16(3), 382-389.
Park, J., Kim, J. C., Cho, S. W., & Shon, H. S. (1997). Factors Influencing on Physical Activities of Daily Living in Elderly People with Cognitive Impairment, J of Korean Neuropsychiatr Association, 36(4), 683-687.
Park, J., Ko, H. J., Ha, J. C., Park, Y. N., & Jung, C. H. (1991).
Prevalence of Dementia in the Elderly in a Myun Area of Yungil County, Kyungpook Province, J of Korean Neuropsychiatr Assoc. 30(6), 1121-1126.
Park, J. H., Park, Y. N., & Ko, H. J. (1991). Modification of the mi- ni-mental state examination for use with the elderly in a non- Western society. Part II. Cutoff points and their diagnostic va- lidities. Int J Geriatr Psychiatry 6(2), 875-882.
Shim, H. S., Kim, S. M., Cho, K., W., Hong, M. H., Chang, J., A., &
Park, Y. K. (1999). One year follow up Study of the MMSE-K in the Elderly, The Korean J of Geriatr Society, 3(2), 37-45.
Woo, J. I., Lee, J. H., Yoo, K. Y., Hong, J. P., Kim, C. Y., Kim, Y. I.,
& Lee, J. W.(1997). The Prevalence of dementia among the el- derly in a rural area of Korea, J Korean Neuropsychiatr Assoc 36(1), 92-101.