INTRODUCTION
Since the early 1960s, rapid industrialization and urbanization in Korea have led to the in- crease of population in urban areas, resulting in a variety of environmental pollution. In parti- cular, runoff from the urban areas directly impo- ses pollution on the receiving waters. The occur- rence of pollution generated from urban areas can be largely divided into two sources, point and non-point. Although the pollution originating from point sources is very large, it is controlled relatively well by advanced environmental facil- ities. Non-point sources, however, are very diffi- cult to be controlled because occurrence routes of
them are very diverse and extensive (Bedient et
al., 1978; Hunter et al., 1979; Novotny, 1995).Tonderski et al. (1996) reported that the non- point sources had been the dominant case of water pollution in developing countries but they were not managed as properly as point sources with less public awareness of the environment.
Therefore, importance of control for non-point sources has been increased and runoff charac- teristics of them must be correctly estimated to prevent the pollution of stream water quality.
Excessive development of satellite towns near a large city has been essentially accompanied with the massive pavement of natural soil surfaces and with the conversion of the natural sewer system into man-made channel networks.
─
─ 67 ──
* Corresponding Author: Tel: ±82-31-201-2461, E-mail: [email protected]
Assessment of Non- -point Pollutants and Runoff Characteristics in Urban Area, Korea
Park, Jae Young, I-
-Song Choi and Jong- -Min Oh*
(Center for Environmental Studies & Department of Environmental Science and Engineering, Kyung Hee University, Korea 449-701)
The objectives of this study were to understand the runoff characteristics of the non-point sources originating from impervious surfaces and to assess their effect on the aquatic environment in the urban areas. The concentration of pollutants (SS, BOD, COD and T-P) except for T-N showed the highest value in runoff from road, and event mean concentration (EMC) also showed high value from road. The pollutants discharged from road showed a higher concentration in the beginning stage (0~30%) of progressive percentage of rainfall. The contribution percentages of non-point sources by load were 44.9% for SS, 11.2% for BOD, 21.4% for COD, 11.4%
for T-N and 8.1% for T-P in the total load of pollutant discharged through sewer.
From our results, the road was a significant potential source that deteriorated water quality of the streams and lakes in the vicinity of the urban area during the rain period. Therefore, counter plan is required to reduce pollutant concentration on the road from non-point sources in the urban area. Also, since pollutant concentration in the beginning stage of rainfall was quite high, road cleaning seems to be one of the very useful methods to prevent inflowing of pollutants to the aquatic environ- ment.
Key words : point source, non-point source, road and roof, impervious surface, runoff, event mean concentration (EMC)
Therefore the pollutants accumulated on imper- vious surfaces of urban areas such as roads and roofs could not only be leached out but also can- not be reduced by adsorption reaction of the soil surface and, after all, they would be transported to the neighboring rivers and lakes through man -made channel networks.
At the end of 1970s, the U.S. set up a plan to decrease the load of pollutants from non-point sources, categorized them in details, and there- after has strictly managed them (Schmidt, 1986).
Since the environmental ministration of Japan founded the association of investigation upon the non-point source in 1978, they have closely exa- mined the domestic non-point sources (Yamada, 1991). While many advanced countries have made efforts to define the non-point sources and to develop the optimum management technique of them (Lynch and Corbett, 1990), few studies have been attempted in Korea (Bang et al., 1997), nevertheless the influence by non-point sources on the hydrosphere is growing in urban areas.
The objectives of this study are to understand the runoff characteristics of the non-point sour- ces originating from impervious surfaces such as roads and roofs and to estimate contribution of them to aquatic environments (especially, urban stream).
MATERIALS AND METHODS
Site description
Shingal is a small town (26,445 residents on 2001) in Yongin located to the south of the capi-
tal city, Seoul, Korea. The local stream of Shin- gal (called Shingalcheon) flows from the east to the west across Shingal town, and ultimately to Shingal Lake. Shingal Lake is a very important (2.29 km
2) irrigation water source for local agri- culture.
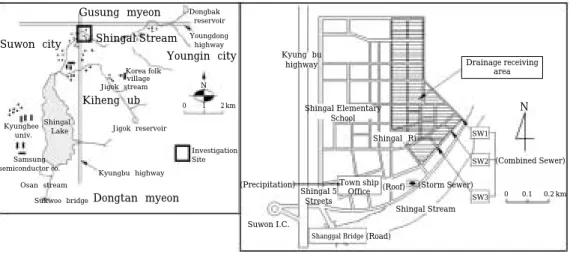
Figure 1 shows the detailed sampling sites. A road and roof were selected as sampling sites of non-point sources in this study. Sampling sites of precipitation and storm sewer were selected for using as a comparison data. Total area of the roads including parking lots was 131,561 m
2(29%) in the study area, and the other area of 324,659 m
2was investigated as the roofs. The sampling site of a road paved with asphalt was on the bridge Sangal that spans the Shingal- cheon. This site was selected as one of the repre- sentative points to investigate the effect of hu- man activities and vehicles and was 30 meter away from the heavy traffic zone of the town center. Precipitation and runoff from roof was collected on the Shingal city office located in the center of commercial and residential areas.
Since the sewer system of Shingal is consisted of the combined sewer system, all of the sewage and industrial wastewater comes up to Shingal- cheon regardless of precipitation. Effluent of three different combined sewers in the middle of Shingalcheon, specified as SW1, SW2 and SW3 in Figure 1, was sampled. Their sites were great- ly influenced by domestic waste and industrial waste originating from Shingal town. The storm sewer does not flow out to Shingalcheon on sunny days. During the heavy rain the flow rate tremendously increases. After all, precipitation
Fig. 1. Map of the experimental watersheds and location of sampling sites.
Gusung-myeon
Drainage receiving area
Town ship Office Investigation
Site Kyungbu-highway
Dongbak -reservoir Youngdong -highway
Jigok-reservoir Kyunghee
-univ.
Osan-stream Samsung semiconductor co.
Sukwoo-bridge
Korea folk village Jigok-stream
Shingal -Lake
Suwon-city
Youngin-city Kyung-bu
highway
Shingal Elementary School
Shingal-Ri
(Storm Sewer) Shingal Stream (Precipitation)
Suwon I.C.
(Road) (Roof) Shingal 5
Streets
Shanggal Bridge
(Combined Sewer)
0 0.1 0.2 km
0 1 2 km N
N
SW1
SW2
SW3
Shingal Stream
Kiheng-ub
Dongtan-myeon
including large amounts of pollutants from non- point sources flow out through the storm sewer.
Therefore, the storm sewer flow must be estimat- ed and distinguished from the other flow to eval- uate the combined sewer flow and to understand influence of non-point sources on receiving wa- ter. Combined sewers carry a mixture of sewage /wastewater (dry weather flow) and storm/rain- fall runoff.
Sampling methodology
Precipitation during each test day was collect- ed by using a clean 20 L polyethylene bottle with a 30 cm diameter funnel set up on the rooftop of the town office. In order to exclude the influence of other non-point sources, the runoff sample from the road was collected from a drain-outlet located under the Sangal bridge. Runoff from the roof was sampled from the downspout of Shingal town office. The roof was coated with paint, gently sloped and rugged.
Sampling of runoff from the road, the roof and the sewers was initiated as soon as the runoff from them appeared. During the precipitation, the runoff for the first few hours was sampled with a short interval, 20 minutes in this study, because a large amount of contaminants should be discharged into Shingalcheon at the beginn- ing of the rainfall. The sampling interval was then extended to about 1~2 hours until the rain stopped. Sampling of sewage has been continued until the flow rate was recovered to water level of the dry weather.
Physicochemical analysis
The flow rate was determined in-situ. Samples brought to the laboratory were preserved at 4� C in a refrigerator until analyzed. The volumetric flow rate from the sewer was evaluated by mea- surement of flow velocity and the cross sectional area of the drainpipe, and the volumes of runoff from other sampling sites were directly deter- mined by using a vessel. The collected samples were analyzed according to the Standard Me- thods (APHA et al., 1995). Analysis was perform- ed by appropriate methods such as;
�Suspended solids (SS): Filtration, drying at 103~105� C and weighing (Section 2540 C).
�5-day biochemical oxygen demand (BOD
5):
Dilution water not seeded technique using membrane electrode method, DO meter (YSI
58, USA) (Section 4500-O G, 5210 B).
�Chemical oxygen demand (COD): Closed re- flux, titrimetric method using dichromate for oxidation (Section 5220 C).
�Total nitrogen (T-N): Summation method (T- N = TKN±NO
3-N±NO
2-N).
�Total Kjeldahl nitrogen (TKN): Digestion, dis- tillation using Kjeldahl flask (Section 4500- N
orgC).
�Nitrate-nitrogen (NO
3-N): Ultraviolet spectro- photometeric method (Section 4500-NO
3B).
�Nitrite-nitrogen (NO
2-N): Ion chromatogra- phic method (Section 4500-NO
2C).
�Total phosphorus (T-P): Persulfate digestion and ascorbic acid method (Section 4500-P B).
RESULTS AND DISCUSSION
Concentration of pollutants in runoff with land uses
The range and mean concentration of pollu- tants in the runoff from the road, roof, sewers and precipitation during the investigation period were summarized in Table 1. The values of com- bined sewers in Table 1 were obtained from the total data of SW 1, SW 2 and SW 3. In land uses, the road showed the wide range and high concen- trations for all items except for T-N. Especially, SS and COD of road samples showed much high- er concentration than those of other samples, as 1,076 mg∙L
-1and 375 mg∙L
-1in mean concen- tration, respectively. The range and mean con- centration of BOD in road samples was 1.6~285 mg∙L
-1and 37.5 mg∙L
-1, respectively. In gen- eral, the roads are likely to be impacted by en- vironments such as pavement wear, vehicles, atmosphere and various maintenance require- ments. Sartor et al. (1974) and Novotny (1995) reported that deposit matters from atmosphere generated by vehicles and urban area action significantly influenced the roads.
The range and mean concentration of each pol-
lutant from the roof were lower than those from
other sites. The mean concentration of BOD and
COD in roof samples were 4.9 mg∙L
-1and 45
mg∙L
-1and that of T-N and T-P were 2.43
mg∙L
-1and 0.28 mg∙L
-1, respectively. Judging
from the data that mean concentrations of each
pollutant in the roof sample showed similar valu-
es with them in precipitation (Table 1), the con-
centrations of each pollutant in the roof sample
were mainly affected by precipitation. As samp- ling area of roof was located at a height of 3.5 meter from ground, comparatively heavy weight deposit matter was difficult to accumulate on that site and, even though deposited matter was accumulated on the roof, it is possible to be redi- spersed by wind. It was verified that mean con- centration of SS in roof sample was 20 mg∙L
-1and this value was little more than that of pre- cipitation (15 mg∙L
-1). Simply calculating, just 5 mg∙L
-1was accumulated with deposited matter on roof, and therefore potentiality of pollution by runoff from roofs was not much in this study (Duncan, 1999; Chiew and McMahon, 1999).
The concentrations of all pollutants originated from the storm sewer were lower than those from the combined sewer. The region for the present study consists mostly of the combined sewer system, and the whole length of the storm sewer is relatively short, so that collecting of runoff through the storm sewer is very limited. In addi- tion, all deposits on the roads could not be added to the runoff of the storm sewers because of re- moval of them by periodic cleaning and/or move- ment away by violent winds. In other words, it required tedious attempts to achieve an accurate sampling from storm sewers during the first flushing. The mean concentration of T-N was the highest in the combined sewer as 8.37 mg∙
L
-1. Accumulated deposits on the roofs and roads would be introduced to the combined sewer, accompanying with domestic sewage.
The SS concentration of precipitation was in the range of 2.8~25 mg∙L
-1. The high concen- tration for SS in precipitation seems because frequent construction works in the vicinity of the study site led to a great increase of falling dust for survey period. A similar tendency was found in Japan, located closely from Korea with a similar climate. Wada (1985) reported that SS concentration of precipitation was in the range of
1~42 mg∙L
-1in urban areas.
Assessment by event mean concentration (EMC) in runoff with land uses
Because the concentration of pollutants during the storm event changes with a wide range by amount of precipitation, evaluation by selected concentrations of pollutants has a significant de- fectiveness. A single index known as Event Mean Concentration (EMC) can be used to correctly evaluate characteristics of runoff from each non- point and point source considering amount of rainfall (USEPA, 1983; Novotny and Olem, 1994;
Sansalone and Buchberger, 1997; Smullen et al., 1999). The EMC indicates a flow-weighted aver- age of constituent concentrations. The EMC for an individual storm event is defined as the total pollutant load divided by total runoff volume, as follow equation.
EMC =
∑Q
iC
i/
∑Q
iWhere, Q
iis the time variable flow, C
iis the time variable concentration and i is the rainfall duration (time). The EMC values for each storm event are summarized in Table 2.
Comparing at 66 mm of rainfall, EMC value of pollutants from the road investigated in this study was higher than that from roof and sew- ers. This tendency was similar to the result of
“Concentration of pollutants in runoff with
land uses”. The highest rainfall intensity (9.5mm∙hr
-1), the value of rainfall amount divided by rainfall time, among the road samples, which was 21 mm of rainfall for 2.2 hr, resulted in much higher values of EMC than other rainfall intensity. Also, the EMC values at 21 mm of rainfall for 2.9 hr were relatively high. EMC val- ue was not influenced by only rainfall amount.
EMC values at 66 mm of rainfall that is the larg- est rainfall amount were not higher than those
Table 1. Concentration of pollutants for rainy days de-pending on land use in urban area.
Land use SS BOD COD T-N T-P
(mg∙L-1)
Road 15~5,960 (1,076)a 1.6~285 (37.5) 26~1,645 (375) 1.89~25.86 (6.61) 0.15~7.93 (1.79) Roof 2~101 (20) 1.1~14.2 (4.9) 16~140 (45) 1.40~5.19 (2.43) 0.04~0.88 (0.28) Combined sewer 6~629 (149) 2.4~159 (29.0) 16~346 (144) 1.59~26.47 (8.37) 0.15~3.16 (0.87) Storm sewer 22~224 (100) 4.3~6.5 (5.2) 72~80 (77) 3.37~5.69 (4.20) 0.08~0.53 (0.27) Precipitation 2.8~25 (15) 3.0~3.8 (3.5) 17~48 (31) 1.50~4.44 (2.22) 0.05~0.25 (0.16)
aMean concentration
at 21 mm of rainfall. This reason seemed why rainfall time for 66 mm of rainfall was about 5 times longer than that for 21 mm of rainfall.
From this result, we know that a large quantity of precipitation for a short time causes high EMC values of runoff. Therefore, rainfall intensity is a more significant factor to EMC value. This ten- dency was the same for roof and road.
Evaluation by EMC showed the actual concen- tration of each pollutant in runoff with land use.
EMC values from sewers increased compared with concentrations (see Table 1) because the effect of the flow rate was excluded. While BOD concentration of road (37.5 mg∙L
-1) was higher than that of combined sewer (29 mg∙L
-1) in mean (Table 1), combined sewer had higher EMC value for BOD (26.0 mg∙L
-1) than road (9.0 mg∙
L
-1) at 66 mm of rainfall (Table 2). EMC value of T-N was the highest in runoff from sewers as 4.3 mg∙L
-1at 66 mm of rainfall.
All pollutants except SS investigated from sewers showed higher EMC values for dry weather than for rainy weather (dilution effect).
In general, runoff from combined sewer includes mainly domestic waste for dry weather. There- fore high EMC values of sewer seemed to be influenced by domestic waste for dry weather.
Roof also showed the least value for EMC.
Variation of concentration in runoff from road with progression of rainfall
From the previous study, we could know that the road was the most important pollution source (Novotny, 1995). Also many other studies report- ed that road in urban areas had discharged the highest non-point pollutants among the land
uses (Sartor et al., 1974; Rimer et al., 1978;
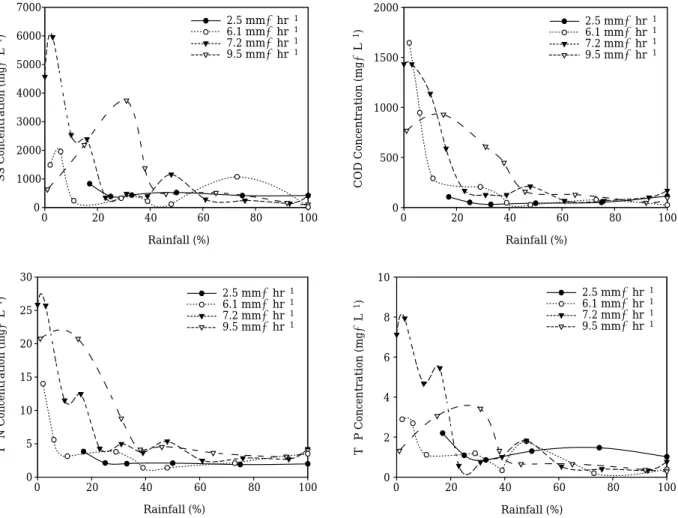
Novotny, 1995). Thus, characteristics of runoff from road with progression of rainfall need to set up the effective strategy for control of non-point sources. Figure 2 shows the variation of concen- tration for SS, COD, T-N and T-P in runoff from roads with progression of rainfall. Rainfall intensities of each storm event were 2.5, 6.1, 7.2 and 9.5 mm∙hr
-1.
In Figure 2, among the results of the average rainfall intensities, the intensity of 2.5 mm∙hr
-1showed the least variation of concentration for all pollutants presented with progression of rain- fall. Since deposited matters accumulated on roads are transported by rainfall, rainfall inten- sity greatly influences on the concentration of each pollutant. Therefore low concentration of each pollutant in runoff at low rainfall intensity (2.5 mm∙hr
-1) was due to not transporting all of the accumulated matters on roads. On the other hand, the concentrations of all pollutants at high rainfall intensities of 7.2 and 6.1 mm∙hr
-1were high. More detailed data for rainfall intensity is required to understand the range of rainfall in- tensity influencing on the concentration of pollu- tants in runoff from roads.
The first flush (less than 30% of progression of rainfall in this study) greatly contributed to the concentration of each pollutant in runoff from roads. The high concentration of pollutants in runoff by first flush would be often seen at the impervious surface such as an asphalt street (Rimer et al., 1978; Delleur, 1982). The concen- trations of all pollutants were extremely high at the beginning stage (in the range of 0~30%) in progression of rainfall (Fig. 2). The concentra-
Table 2. EMCs for individual storm event with land use in urban area.
Land use Rainfall Rainfall time SS BOD COD T-N T-P
(mm) (hr) (mg∙L-1)
5 2.0 574 - 98 2.67 1.43
Road 66 10.8 242 9.0 113 2.42 1.04
21 2.9 895 16.3 270 5.78 1.57
21 2.2 1,688 15.8 366 5.42 1.64
Roof 5 2.0 10 - 27 2.26 0.50
66 10.8 25 3.5 43 2.06 0.11
8 2.5 169 14.3 169 8.64 0.43
Sewer 66 10.8 157 26.0 96 4.30 0.89
Dry weather period 64 31.5 189 18.40 1.50
- : No data
tions of SS, T-N and T-P at 7.2 mm∙hr
-1of rainfall intensity especially showed the highest value at 3% of progression of rainfall, as about 5,960 mg∙hr
-1, 25.8 mg∙hr
-1and 7.9 mg∙hr
-1, respectively. The concentration of COD at 6.1 mm∙hr
-1of rainfall intensity was the highest value at 2% of progression of rainfall, as about 1,645 mm∙hr
-1. Therefore, the beginning stage (0~30%) of progression of rainfall must be focus- ed to reduce pollutants in runoff from roads.
Estimation of load by rainfall intensity with land uses
It is not simple to quantitatively estimate load of pollutants discharged from non-point sources during rainy days because of significant factors such as the amount of rainfall, the antecedent of dry periods and the effect of on-going construc- tion works. In this study, we tried to estimate
total load by rainfall intensity with land use.
Table 3 shows the load of pollutants with land uses during each rainy day. The mean load of SS for rainfall intensities from the road was 3,713 mg∙m
-2∙hr
-1, and for BOD, COD, T-N and T- P were 68, 981, 20 and 6.9 mg∙m
-2∙hr
-1, res- pectively. The road had much higher values of load for pollutants than roof. The SS load especi- ally discharged from the road surface during the rainy day was 28 times greater than that from the roof.
The COD load of precipitation for 6.1 mm∙
hr
-1of rainfall intensity was higher than that of roof. This result was quite far from the prelimi- nary expectation that the pollutant load of pre- cipitation would be lower than that of roof. The sampling site of the roof was a plane with a wide area and the surface of it was very rough. There- fore, it seems that some of the organic matters in runoff were occluded or adsorbed onto the rough
Rainfall (%)
0 20 40 60 80 100
COD Concentration (mg∙L-1) 0 500 1000 1500 2000
Rainfall (%)
0 20 40 60 80 100
SS Concentration (mg∙L-1) 0 1000 2000 3000 4000 5000 6000 7000
2.5 mm∙hr-1 6.1 mm∙hr-1 7.2 mm∙hr-1 9.5 mm∙hr-1
Rainfall (%)
0 20 40 60 80 100
T-N Concentration (mg∙L-1) 0 5 10 15 20 25 30
Rainfall (%)
0 20 40 60 80 100
T-P Concentration (mg∙L-1) 0 2 4 6 8 10
2.5 mm∙hr-1 6.1 mm∙hr-1 7.2 mm∙hr-1 9.5 mm∙hr-1
2.5 mm∙hr-1 6.1 mm∙hr-1 7.2 mm∙hr-1 9.5 mm∙hr-1 2.5 mm∙hr-1
6.1 mm∙hr-1 7.2 mm∙hr-1 9.5 mm∙hr-1
Fig. 2. Pollutographs for each average rainfall intensity on the road as a function of rainfall.
surface of the roof during their moving to outlet.
Oh et al. (1996) reported that waste concrete was a good treatment media for removal of SS, BOD, COD and T-P. More detail data is required to understand moving dynamics of organic matters on roof surface.
In the sewer, the load of pollutants was larger for 6.1 mm∙hr
-1of rainfall intensity than for 3.2 mm∙hr
-1. In particular, the loads of BOD (259 mg∙m
-2∙hr
-1) and T-P (8.8 mg∙m
-2∙hr
-1) at 6.1 mm∙hr
-1of the rainfall intensity were about 4 times of those for 3.2 mm∙hr
-1. However, the load of COD (756 mg∙m
-2∙h
r-1) at 3.2 mm∙hr
-1was greater than that for 6.1 mm∙hr
-1. This trend was shown in the result of EMC value (Table 2). This reason seemed to be the irregular wastewater originating from neighboring indu- stries including a large amount of hardly dis- solved organic matters. Summing up the results, it was obvious that the high rainfall intensity caused much load of pollutants in runoff from all the sampling sites. However, any particular rela- tionship between rainfall intensity and load of pollutants was not found in this study.
Estimation of annual load from non-point sources
Annual contribution of non-point sources to the total pollution was estimated, and summariz- ed in Table 4. While the point sources consis- tently discharge various pollutants, non-point sources intermittently do. In accordance, annual evaluation should be more desirable to verify the contribution percentages of the non-point sour- ce. Precipitation in Korea is usually intensive in the summer season, June to September, but rare precipitation occurs throughout the rest of the year.
The point source load was calculated by the data of the Table 2 which presented the sewer discharge amounts for one day obtained by con- tinuous monitoring during the dry weather with the assumption that one day sewer discharge amounts was immutable for all year round. Fol- lowing the calculation, the annual load of point sources for SS, BOD, COD, T-N and T-P were 180.4 ton∙yr
-1, 93.38 ton∙yr
-1, 531.6 ton∙yr
-1, 57.0 ton∙yr
-1and 4.34 ton∙yr
-1, respectively.
In order to analyze the load of non-point sou- rces, two methods were attempted, one on the basis of discharge load and the other of outflow
load in this study. In the former approach, the load was evaluated for the roads and roofs, whereas the latter considered only the outflow of sewers.
In the former case, we divided pollutants loads of road and roof in Table 3 with the precipitation of that rainfall event and obtained unit loads (weight per mm) of road and roof. Then unit loads were converted into annual non-point source loads by multiplied annual precipitation (1,373 mm∙yr
-1). Total loads of annual pollutants were determined by added the annual non-point sour- ce loads of roads and roofs during the rainy days and the point source loads of sewer during the dry days.
The latter approach was concerned only with the outflow of the sewers. The loads of non-point sources were obtained by subtracting discharge amounts from sewer during the dry days from those during the wet weather, and unit loads (weight per mm) of non-point sources were de- termined by dividing the loads of non-point sources with the rainfall. The annual loads of non-point sources were determined by multi- plying the annual rainfall (1,373 mm∙yr
-1) by unit loads of each non-point source. Total an- nual pollutants loads at the sewers were deter- mined by adding the annual non-point source load at the sewers and the annual point source at the sewers during the dry weather.
In Table 4, the annual loads of SS, BOD, COD, T-N and T-P in runoff from road and roof were
Table 3. Individual load of pollutants with land use for the rainy days in urban area.
Rainfall SS BOD COD T-N T-P Land use Intensity
(mm∙hr-1) (mg∙m-2∙hr-1)
2.5 2,486 - 425 12 6.2
Road 6.1 1,609 60 749 16 6.9
7.2 5,016 89 1,505 33 8.9 9.5 5,741 54 1,245 18 5.6
Roof 2.5 22 - 62 5 1.2
6.1 58 8 101 5 0.3
Sewer 3.2 757 64 756 39 2.0
6.1 1,559 259 385 43 8.8
2.5 - - 12 5 0.6
3.2 56 - 153 5 0.5
Precipitation 6.1 17 19 136 9 0.6
7.2 - 23 103 4 0.3
9.5 139 19 265 25 1.3
- : No data
116.7 ton∙yr
-1, 1.33 ton∙yr
-1, 31.85 ton∙yr
-1, 0.86 ton∙yr
-1and 0.29 ton∙yr
-1, respectively.
The percentages of loads from non-point sources to total loads of pollutants occupy 39.3%, 1.4%, 5.7%, 1.4% and 6.3%, respectively. However, calculating the non-point pollutants load from the sewer as the equivalent amount of total local precipitation (1,373 mm∙yr
-1), the values of SS, BOD, COD, T-N and T-P become 146.8 ton∙
yr
-1, 11.74 ton∙yr
-1, 144.6 ton∙yr
-1, 7.30 ton∙
yr
-1and 0.38 ton∙yr
-1, respectively. The percen- tage of non-point source load to total pollutants load at sewer occupies 44.9%, 11.2%, 21.4%, 11.4%, and 8.1%.
This assessment for load of pollutants through the monitoring of runoff from roof and road and of combined sewer when the rainy and the sunny day is very rare until now, although it shows the characteristics of regional data. The difference between the two different approaches seems to be due that the build-up of fine sediment parti- cles in the drainpipes was re-suspended by rain- fall and discharged with the runoff. Therefore, the contribution of the non-point source loads from the sewers was higher than the sum of the road and roof.
CONCLUSIONS
Having rarely studied for non-point sources including sewers and roofs and impervious sur- faces of roads in urban areas, accumulated data for them is insufficient and it is very difficult to appropriately manage pollution matter discharg- ed from them. Therefore the concentration and load in runoff from different non-point sources during the storm events were carefully inves- tigated in order to control non-point sources in the urban area.
The accumulated matters on the roads signifi- cantly influenced on the water quality of urban stream with their high concentrations and loads of pollutants. SS concentration from road especi- ally was 1,076 mg∙L
-1in average and this value reached 7 times the amount of that from the sewers. Also, runoff of pollutant matter from the road was concentrated in the beginning stage (0~30%) of progression of rainfall. Nevertheless the area of the roads occupied in the urban area (131,561 m
2) was much smaller than that of roofs (324,659 m
2), the total load of pollutant matter from the roads was extremely higher than that from the roofs. Thus, first flushed pollutants from the roads among the non-point sources need to be systematically managed with an advanced technique and methodology. According to our result (unpublished data), the removal amount of organic and inorganic matters by just cleaning on the road was up to about 54%. In addition, backward sewage disposal facilities must be urgently rearranged and up-graded in order to prevent the further contamination of streams and lakes. As a further study, a simula- tion model to estimate runoff of non-point sour- ces must be developed with reliable factors such as population, land use, sewer system, and the season.
ACKNOWLEDGEMENTS
This research was funded by the KyungHee University (2004).
LITERATURE CITED
APHA, AWWA and WPCF. 1995. Standard method for the examination of water and wastewater, 19th ed. American Public Health Association, Table 4. The individual unit load and pollutants load with land use in urban area.
Land use Unit SS BOD COD T-N T-P
Road 83.9 0.91 20.75 0.46 0.18
Roof kg∙mm-1 1.04 0.06 2.45 0.17 0.03
Sewer (non-point source) 106.9 8.55 105.2 5.32 0.28
Road±Roof 116.7 1.33 31.85 0.86 0.29
Sewer (non-point source) ton∙yr-1 146.8 11.74 144.6 7.30 0.38
Sewer (point source)a 180.4 93.38 531.6 57.0 4.34
aDry weather period
Washington, D. C.
Bang, K.W., J.H. Lee and M.J. Yu. 1997. A study on the runoff characteristics of non-point sources in small urban watersheds. Korean Society On water Quality 13: 79-99.
Bedient, P.B., D.A. Harned and W.G. Characklis.
1978. Stormwater analysis and prediction in Houston. J. Envir. Eng., ASCE 104: 1087-1100.
Chiew, F.H.S. and T.A. McMahon. 1999. Modelling runoff and diffuse pollution loads in urban areas.
Wat. Sci. Tech. 39: 241-248.
Delleur, J.W. 1982. Urban stormwater hydrology (David F.K. ed). Proceedings of American Geophy- sical Union, p.1-34.
Duncan, H.P. 1999. Urban stormwater Quality: A statistical Overview. Cooperative Research Cen- tre for Catchment Hydrology, In press.
Hunter, J.V., T. Sabatino, R. Gomerts and M.J.
Mackenzie. 1979. Contribution of urban runoff to hydrocarbon pollution. J. WPCF 51: 2129-2038.
Lynch, J.A. and E.S. Corbett. 1990. Evaluation of best management practices for controlling non- point pollution from silvicultural operations.
Water Res. Bull. 26: 41-52.
Novotny, V. and H. Olem. 1994. Water Quality Pre- vention, Identification and Management of Dif- fuse Pollution. Van Nostrand Reinhold, New York.
Novotny, V. 1995. Nonpoint pollution and urban stormwater management. Technomic Pub. Co., p.
7-27, 193-205.
Oh, J.M., I.S. Choi and T.G. Lee. 1996. The compari- son of treatment efficiency of contact oxidation with media. J. Korea Technological Society of
Water and Waste Water Treatment 4: 17-24.
Rimer, A.E., J.A. Nissen and D.E. Reynolds. 1978.
Characterization and impact of storm water run- off from various land cover types. J. WPCF 50:
252-264.
Sansalone, J.J. and S.G. Buchberger. 1997. Partition- ing and first flush of metals in urban roadway storm water. J. Environ. Eng. 123: 134-143.
Sartor, J.D., G.B. Boyd and F.J. Agrady. 1974. Water pollution aspects of street surface contaminants.
J. WPCF 46: 458-467.
Schmidt, S.D. and D.R. Spencer. 1986. The magni- tude of improper waste discharge in an urban stormwater system. J. WPCF 58: 744-748.
Smullen, J.T., A.L. Shallcross and K.A. Cave. 1999.
Updating the U.S. nationwide urban runoff quali- ty data base. Wat. Sci. Tech. 39: 9-16.
Tonderski, A. 1996. Landuse-based nonpoint source pollution. A threat to water resources in devel- oping countries. Wat. Sci. Tech. 33: 53-61.
Yamada, K. 1991. Transition of pollute-runoff from small river basin in urban area on sewering. In- ternational Conference on Integrated Stormwater Management. Singapore, p.56-65.
USEPA. 1983. National urban runoff program. Vol.
1. NTIS PB84-185552, U.S. EPA, Washington D.C.
Wada, Y. 1985. The characteristics of non-point sources and its Runoff Load. J. Environmental Conservation Engineering of Japan 14: 97-101.
(Manuscript received 15 December 2004, Revision accepted 25 February 2005)