° 2012. The Korean Astronomical Society. All Rights Reserved. c
AKARI-FIS POINT SOURCE CATALOGUE: CURRENT STATUS AND FUTURE PLAN
Issei Yamamura
1, Sin’itirou Makiuti
1, Norio Ikeda
1, Tatsuya Koga
1, Akira Yoshino
1, and Chisato Yamauchi
21
Institute of Space and Astronautical Science, JAXA, Yoshino-dai 3-1-1, Chuo-ku, Sagamihara, Kanagawa 252-52010, Japan
2
Naitional Astronomical Observatory, NINS, Osawa 2-11-1, Mitaka, Tokyo 181-8588, Japan E-mail: [email protected]
(Received July 03, 2012; Accepted August 09, 2012)
ABSTRACT
The current status of the AKARI-FIS Point Source Catalogue is reported. The first version of the Bright Source Catalogue has been in public since March 2010 and used extensively in the various fields in astronomy. The second version of the Bright Source Catalogue and the first version of the Faint Source Catalogue are currently under development. The revised Bright Source Catalogue is expected to have improved completeness, reliability, and accuracy compared to the current version. The Faint Source Catalogue will have a scan-density dependent detection limit and will enable much deeper exploration of the sky especially in the high-ecliptic latitude regions.
Both catalogues will be available in a year time scale.
Key words: infrared: survey; infrared: catalogues
1. INTRODUCTION
The infrared astronomical satellite AKARI has car- ried out an all-sky survey in the mid- and far-infrared wavelengths in 2006–2007 with two on-board instru- ments; the Far-Infrared Surveyor (FIS; Kawada et al., 2007) and the Infrared Camera (IRC; Onaka et al., 2007). The survey successfully covered more than 96 per cent of the entire sky. The first products from the AKARI All-Sky Survey data were two point source catalogues, namely the FIS Bright Source Cata- logue Version 1 (hereafter FIS BSC V1; Yamamura et al., 2010) and the IRC Point Source Catalogue Version 1 (IRC PSC V1; Ishihara et al., 2010). These cata- logues were produced and released simultaneously but individually, mainly because the large difference in the spatial resolution made the cross-identification ambigu- ous.
The FIS BSC V1 contains 427,071 sources and pro- vides fluxes in the four FIS bands centered at 65, 90, 140, and 160 µm. The number of confirmed sources is different in the different bands, corresponding to the
sensitivities of the bands. The most sensitive band at 90 µm has detected 373,553 source with the detection limit of 0.55 Jy, while the number was 28,779 in the 65 µm band. The positional accuracy of the detected sources in the FIS BSC V1 is 6 arcsec, limited mainly by the internal pixel size of the source detection and measurement processing.
The details of processing and performance of the FIS BSC V1 are found in the Release Note (Yama- mura et al., 2010; this is the proper reference for the FIS BSC V1).
2. DATA DISTRIBUTION AND USAGE STATIS- TICS
Several channels are provided to access the FIS BSC V1 (and IRC PSC V1) data. One is to download the entire catalogue file.
1The release note is also available from this URL. The FITS formatted catalogue file (uncompressed) is 51 MB, small enough
1
http://www.ir.isas.jaxa.jp/AKARI/Observation/PSC/Public/.
http://pkas.kas.org 105
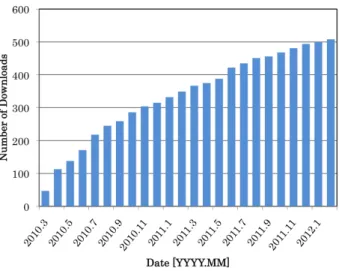
Fig. 1. Accumulated number of FIS BSC V1 catalogue file downloads from the ISAS server since the release. The number has just exceeded 500 in February 2012 and is still increasing.
to handle in one’s PC for simple analysis. More than 500 downloads of the catalogue file have been made from the ISAS server since the public release in March 2010 until February 2012 (Figure 1). The number is still increasing.
The file is also distributed from CDS so the actual number of downloads is more than that.
The second way is to access via AKARI Cata- logue Archive Server (CAS; Yamauchi et al., 2011).
2AKARI /CAS can be used not only for searching sources but also matching the FIS & IRC cata- logue and/or other major astronomical catalogues and databases such as IRAS, 2MASS, RC3, Simbad and NED that are currently implemented. The CAS ac- cepts direct input of SQL queries so that the user can make complicated data mining. The uniqueness of the CAS also becomes apparent in the data Explore page that is linked from the search result list. The Ex- plore presents multi-wavelength images around the tar- get source retrieved from external image data servers.
Note that Herschel’s observer support tool (HSPOT) refers to AKARI catalogues via CAS.
Figure 2 presents statistics of CAS access. The number of access (does not mean number of retrieved sources) is constantly several thousands per week. Very high rate access from a few users in a short period
2
http://darts.isas.jaxa.jp/astro/akari/cas.html.
100 1000 10000 100000
4 12 20 28 36 44 52 60 68 76 84 92
N um be r of a c c e s s
Week since the Release
Fig. 2. Access statistics of AKARI Catalogue Archive Server (CAS) from data release on March 2010 until Febru- ary 2012. Number of access does not mean number of re- trieved sources. Two peaks at week 12 and 64 are due to limited number of heavy users.
Fig. 3. Number of publications using FIS BSC V1.
makes two peaks in the plot.
The AKARI catalogues are also implemented in the general catalogue search systems such as Visier at CDS and IRSA at IPAC. Approximately 10
5access per month is recorded in CDS. The data are also accessi- ble via the Virtual Observatory interface from NAOJ, CDS, and HEASARC.
Researches based on the FIS BSC V1 have started
immediately after the release. Figure 3 shows the num-
ber of scientific papers referring FIS BSC V1. We see
that the number increased rapidly in the first year since
the release. We expect that number will further in-
crease in the future.
3. FUTURE PRODUCTS
Two catalogues are under construction; the Bright Source Catalogue Version 2 (FIS BSC V2) and the Faint Source Catalogue Version 1 (FIS FSC V1). Both are processed by the same software system with differ- ent confirmation strategies so that almost simultaneous release will be possible.
3.1. The Bright Source Catalogue Version 2
Same as the FIS BSC V1, the catalogue will have a uni- form sensitivity over the sky corresponding to a single scan. Multiple scans are used to improve the reliability of the detection.
Three major improvements of the FIS BSC V2 over V1 are expected; (1) completeness, (2) reliability, and (3) accuracy. Following efforts are ongoing / considered to realize the improvements.
[GreenBox]
GreenBox is a part of the FIS survey data processing system and consists of many procedures for masking in- valid data, correcting detector non-linearity, dark sub- traction, and responsivity correction in the time series data (TSD). We have made two essential improvements in the GreenBox:
• The responsivity correction and dark subtraction procedures have been re-considered. A better way of interpolating calibration measurements to apply to the data has been developed, and more stable data correction has been possible. Also swapping the order of processing of the dark sub- traction and responsivity correction would pro- vide more stable time series signals.
• In the previous processing, signal from bright sources (of some tens of Jy) might have been flagged unexpectedly as glitches. This disturbs the source confirmation or prevents precise mea- surements in the later stage. We have added a procedure to withdraw the glitch flag at the bright source positions to recover the signal as much as possible. This shall restore certain num- ber of bright sources back on the catalogue. How- ever, it does not help the far brighter sources (more than a hundred Jy) that cause detector saturation.
[SUSSEXtractor]
Source extraction and photometry are carried out
by the dedicated software SUSSEXtractor (Savage &
Oliver, 2007). We have been working for the following revisions.
• Optimization of the operational parameters has been continued to improve the confirmation pro- cess. Most efforts have been put on the definition of ‘valid’ data area to be used for the source ex- traction.
• There is room to adjust detection threshold that possibly enables to detect fainter sources.
• Position and flux of a source are currently mea- sured at the peak pixel on the processing image on an 8 arcsec grid. Using the information of the surrounding pixels, for instance by fitting the Point Response Function (PRF), we expect to improve the accuracy of the measurements sig- nificantly. The pointing reconstruction by the ESAC/ESA team concluded that the position of the AKARI survey is better than two arcsec (Ya- mamura et al., 2010)
• Detector response depends on the total incom- ing flux while we measure only the flux from the point sources (Jeong et al., 2007). By accounting for the background flux level in the calibration procedure we expect to improve the accuracy of the source flux.
Figure 4 demonstrates the improvement in the source detection. Red-squares without black-crosses are the sources newly nominated in the revised ver- sion. Although it is the result of a test processing, the improvement is significant. As the basic strategy of the source detection and confirmation stays the same, no significant improvement in the number of detected sources or detection limits is expected. Figure 4 also shows that some sources in the FIS BSC V1 disappear in the new processing, due to the change in the condi- tion of source confirmation. A test processing in Febru- ary 2012 reported about 10 per cent net increase of the number of sources over FIS BSC V1.
3.2. The Faint Source Catalogue Version 1
In our definition, the FIS FSC V1 is only different from
the FIS BSC V1 on the confirmation strategy. Both
catalogues are produced by the same software, SUS-
SEXTractor. The source extraction can be divided into
Fig. 4. A comparison of FIS BSC V1 (black crosses) and the test processing (red squares) in a relatively high- visibility region. Further tuning of the data extraction and confirmation process enables the detection of more sources in the revised version.
two major steps. First, we add up all available scan data of a certain region of the sky and pick up the bright signals beyond the given threshold. Flux is also measured on this step. In the second step, the position of each candidate is tested on each single scan data, checking whether the source is detected or not. The criteria that a source is ‘confirmed’ in the FISBSC are n
c≥ 2 and n
c/n
p≥ 0.75 where n
pand n
care the num- ber of observed and detected scans at the position. In the processing of FIS FSC, the scan data are divided into three groups each of which has 1/3 of the total number of scans, and confirmation is carried out on the three sets of co-added data. The same criteria are (currently) applied for the confirmation. This would improve the detection sensitivity by factor of p
n
p/3.
Immediately after the release of the FIS BSC V1 we did the first trial processing of the FIS FSC. Figure 5 shows the number count at 90 µm band in the region near the ecliptic poles (|β| ≥ 80 deg). The peak fluxes of the two data sets are 0.8 Jy (FIS BSC V1) and 0.2 Jy (FIS FSC test). A typical scan density at |β| = 85 deg is 40, thus the expected sensitivity improvement is p
40/3 ∼ 3.7, proving that our strategy works as expected.
Figure 6 plots the detected sources near the ecliptic poles. Black dots are the sources in the FIS BSC V1
FIS_FSC_test
FIS_FSC_test only FIS_BSC_V1