천연 대나무로부터 합성된 활성 탄소의 미세구조 및 전기화학적 특성
양동철⋅김수원⋅M.G. CHOURASHIYA⋅박충년†⋅박찬진†
전남대학교 신소재공학과
Micro-Structural and Electrochemical Properties of Activated Carbon Synthesized from Natural Bamboo
DONG-CHEOL YANG, SU-WON KIM, M.G. CHOURASHIYA, CHOONG-NYEON PARK
†, CHAN-JIN PARK
†Department of Materials Science and Engineering, Chonnam National University, 77 Yongbong-ro, Buk-gu, Gwangju 61186, Korea
†Corresponding authors : [email protected] [email protected] Received 2 August, 2019 Revised 9 September, 2019 Accepted 31 October, 2019
Abstract >> Activated carbon was synthesized from bamboo charcoal by KOH ac- tivation at various temperatures for electrochemical double layer capacitor applications. The micro-structural and surface properties of all the samples were characterized by X-ray diffraction, scanning electron microscopy and N2 ad- sorption/desorption isotherm method. The electrochemical properties of the ac- tivated bamboo charcoal were examined by cyclic voltammetry in the potential window of -1.0 to 0.2 V in 6 M KOH electrolyte at different scan rates. An elec- trode made from the sample activated with 7.5 M KOH and heat treated at 750℃
for 3 h gave a maximum capacitance of 553 F/g at 1 mV/s and 450 F/g at 10mV/s.
Key words : Activated carbon(활성탄소), Bamboo charcoal(대나무 숯), Electrochemical characterization(전기화학분석), Porosity(기공도), EDLC(전기이중층 커 패시터)
1. Introduction
Electric double-layer capacitors (EDLCs) have a larger electrical energy capacity than the conventional capacitors due to their large interfacial area and atomic range of charge separation between the elec- trode and electrolyte interfaces
1-4). Carbon based ma- terials such as activated carbon (AC), carbon nano-
tubes (CNT), carbon aerogel, graphene and its com- posites are used as electrodes for EDLCs applications.
Among these, activated carbon has been widely used as a good adsorbent
5)due its excellent properties, such as easy processability, higher abundance, lower cost, inertness to corrosion and higher endurance at high operating temperatures
6). Typically, agricultural by-products or wastes such as olive cake
7), bagasse
8),
DOI: https://doi.org/10.7316/KHNES.2019.30.5.418 pISSN 1738-7264•eISSN 2288-7407
coconut husk
9), and palm shell
10)are used as starting materials for preparing activated carbon. In this study, bamboo was used as the starting material to prepare activated carbon because of its extraordinary micro-structure
11,12), high absorptive capacity after carbonization
12-14)and it is known as one of the fast- est-growing plants on Earth, with reported growth rates of 100 cm in 24 h
15). Converting bamboo to ac- tivated carbon will add more value to the product.
Moreover, because the bamboo-activated carbon con- version is a renewable biomass process, ultimately it is an environmentally friendly process.
Activated carbon can be synthesized by a physical activation or chemical activation process, consisting of two steps. First, a carbonaceous material is carbon- ized under oxygen-free atmosphere (carbonization process) and then activated with an activator (activation process). In the physical activation process, CO
2and H
2O are used as the activator, and in the chemical ac- tivation process, different types of chemicals can be used as the activation agent, such as KOH, NaOH, ZnCl
2and K
2CO
3. Chemical activation produces acti- vated carbon with a higher specific surface area and better porosity than physical activation
16,17). Hayashi et al.
18)found that their activated carbons had max- imum surface areas at carbonization temperature of 600℃ with ZnCl
2and H
3PO
4activation, and at 800℃
with alkali metal (KOH, NaOH, K
2CO
3and Na
2CO
3) activation.
This paper reports the synthesis of activated car- bon from bamboo and investigates their properties for EDLCs. Bamboo-derived activated carbons were pre- pared by the chemical activation method using KOH as the activating agent.
2. Experimental Procedure
2.1 Synthesis of bamboo charcoal – carbonization
The 2-3 years grown bamboos (phyllostachys bam- busoides) from Dam-yang, Jeollanam-do province, Republic of Korea were used for experiments. These bamboos were cut into small square pieces (approximately 3 cm
2) for carbonization. They were washed with distilled water and dried at 60℃ for 12 h.
The morphological properties of the dried bamboo samples were obtained at different cut-sections by scanning electron microscopy (SEM, JSM-6390).
Moreover, to interpret their thermal behavior, bam- boo samples were analyzed by Thermo-gravimetric analysis (TGA, SDT Q600 V8.3 Build101) at a heat- ing rate of 20℃/min under Argon atmosphere. The TGA revealed different steps of thermal behavior (discussed later) and therefore to understand the prod- ucts at those steps, the bamboo (dried) samples were pyrolyzed at respective temperatures, as 200, 300, 400 and 600℃, in Argon for 0.5, 1 and 1.5 h, and their structural properties were characterized by using the X-ray diffraction (XRD, CuK
α; λ=0.1541 nm ra- diation: D/MAX Ultima-III) technique. Based on these thermal and structural analyses, the optimized pyrolysis temperature for the bamboo samples was selected and used to obtain precursor samples for the activation step.
2.2 Synthesis of activated carbon – activation
A bamboo carbonized at the optimized temperature
was crushed into powder, which was then added to
KOH solution. This powder that had been added to
the KOH solution was dehydrated in an oven over-
Table 1. Activation conditions and specific surface areas (SSA) of activated bamboo samples
Sample no.
KOH mole (M)
Time (h)
Temp.
(℃)
SSA (m2/g) ID
1 0 3 750 348
2 1 1 500 234
3 1 1 1000 684
4 1 5 500 321 Act.C-1
5 1 5 1000 641 Act.C-2
6 3.5 0 750 724
7 3.5 3 340 1.33
8 3.5 3 750 991
9 3.5 3 1160 1312
10 3.5 6 750 1042
11 6 1 500 433
12 6 1 1000 1670 Act.C-3
13 6 5 500 484
14 7.5 3 750 966 Act.C-4
15 60 5 1000 1306
night at 60℃. The dried mixture was then heat treat- ed in a vertical tubular electric furnace, to which the Argon gas was continuously fed through a mass flow controller at 100 mL/min. The heating rate was 5℃/min.
The activated carbon product was cooled down to room temperature under Argon gas atmosphere. To remove impurities, such as ash, the synthesized acti- vated carbon product was washed by distill water and the least amount of hydrochloric acid (HCl) until the pH reached approximately 7. The washed activated carbon then dried at 60℃ for 12 h.
To optimize the activation process, parameters af- fecting the activation process e.g. KOH concentration, heat treatment temperature and heating time was var- ied and effect on quality of product were studied.
The design of variation of these activation process parameters was obtained from MINITAB statistical software (Ver. 14.1; Feature: Design of experiments
> Response surface design) and is mentioned in Table 1.
The BET (Brunauer-Emmett-Teller) specific sur- face areas (SSA) of all the samples were obtained by using the adsorption/desorption isotherms of N
2at 77 K (ASAP 2020), and the respective SSAs are mentioned in Table 1. Among these 15 samples, four samples covering a range of surface areas were selected for EDLC study and were labeled as Act.C-1 (1 M KOH;
heating at 500℃ for 5 h), Act.C-2 (1 M KOH; heat- ing at 1000℃ for 5 h), Act.C-3 (6 M KOH; heating at 1000℃ for 1 h) and Act.C-4 (7.5 M KOH; heating at 750℃ for 3 h).
2.3 Electrochemical analysis of activated carbon for EDLC
The electrodes for EDLC were fabricated using the selected (four) activated carbon powder samples.
Electrode slurry was made from the mixture of acti- vated carbon, Hydroxyl-propyl-methyl-cellulose (HPMC) and carbon black in the weight percent ratio of 80:10:10 and coated on Ni-foam (size 4 cm
2). The coated electrode was dried at 60℃ for 6 h and tested by cyclic voltammetry (CV). CV was performed us- ing (Potentiostats-GAMRY) with the activated carbon electrode as the working electrode, Hg/HgO electrode as the reference and coil type Pt wire as the counter electrode in 6 M KOH electrolyte. The performances of the electrodes were tested in the potential range from 0.2 to -1.0 V at different scan rates (1, 2, 5 and 10 mV/s). The specific capacitance of the activated carbon electrode was calculated using Eq. 1 as fol- lows
C = i / (s × m) (1)
where, C is the specific capacitance in F/g, i is the
average current in mA, s is the scan rate in mV/s and
m is the weight of the active material in grams.
Fig. 2. Thermal analysis (TGA) of as-received bamboo sam- ple
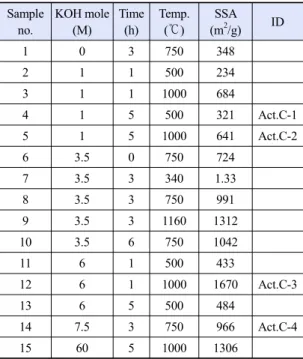
Fig. 1. SEM of (a-c) cross and (e-f) longitudinal sections of as-received bamboo samples. (f) Photographs of bamboo samples indicating the locations where the SEM images (a-e) were taken
3. Results and Discussion
3.1 Morphological and thermal properties of as-received and carbonized bamboo
As-received bamboos were washed and dried be- fore SEM characterization, which will be referred as as-received bamboo, hereinafter. Fig. 1 shows the SEM of as-received bamboo at different cut-sections.
Fig. 1(f) shows the locations of the SEM observation points. In the cross-sectional views (Fig. 1[a-c]), the bamboo exhibits porous morphology with pore-sizes varying from 0.2 to 100 ㎛. This porous morphology was concentrated around the larger pores. Moreover, the density of the smaller pores was higher at the in- ner edge than at the outer surface of the as-received bamboo. The SEM of the longitudinal section of the as-received bamboo revealed that the pores that were
observed in the cross-sectional views were the open- ings of the tubular structures in the bamboo, running across the nodes. Similar to the variations of num- ber-density and pore size in the cross-sectional views, the number-density and breadth/diameter of the tubu- lar structures also varied.
The pyrolysis characteristic (TGA; thermal behav- ior) of the as-received bamboo is shown in Fig. 2.
TGA clearly depicts three distinct weight loss re- gions, of which the second region showed the steep- est decrease in weight. Pyrolysis of bamboo can be directly associated with the degradation of its three main components, namely, hemicellulose, cellulose and lignin of biomass
19)with temperature. Relatively minor weight loss, approximately 10%, observed up to 100℃ can be attributed to the evaporation of mois- ture and/or volatile materials from the bamboo.
Relatively major weight loss, approximately 55%, be-
tween 250℃ to 350℃ (0.55%/min) was attributed to
the evaporation of the volatile components that ex-
isted from the dehydration of hemicellulose and
cellulose. According to Yang et al
19), hemicellulose
easily degrades between 220-315℃, while the py-
rolysis of cellulose is observed at the temperatures
between 315 to 400℃. The third weight loss region
showed continuous weight loss, starting at 350℃, at-
Fig. 3. XRD patterns of bamboo samples carbonized at different temperatures and times
tributed to the pyrolysis of lignin and the gasification of carbonized bamboo charcoal.
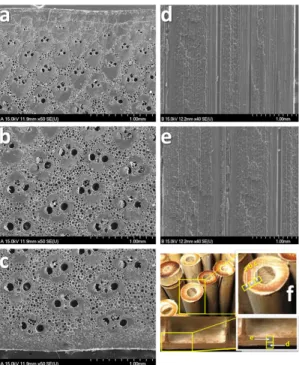
The phase transitions during the carbonization process at various stages observed in TGA were stud- ied by preparing a batch of samples at different car- bonization temperatures and dwelling times. The samples were carbonized at 200, 300, 400 and 600℃, in Argon for 0.5, 1 and 1.5 h. Fig. 3 presents the XRD patterns of the bamboo samples that were car- bonized at different temperatures for various times.
The XRD pattern of the samples carbonized at 200℃
indicated amorphousness as well as various strong impurity and unknown peaks, but the samples car- bonized at 300℃ showed fewer unknown/impurity peaks. Apart from this unidentified phases of the samples carbonized at the lower temperatures, the samples treated at higher temperatures, 400 and 600℃,
showed a strong and broad peak between 20 to 30°, a (002) diffraction peak, indicating amorphousness and low graphitization. A broad peak observed around 43° can be assigned to the (10) bi-dimensional planes
20). According to Zhang et al
21)and Viswanathan et al
22), the broad peak around 43° may be due to the turbo-static or convoluted stacking of the hexagonal layers of carbon that results in disordered structure and lower crystallinity.
Fig. 4 shows the typical SEM images of the cross
and longitudinal sections of carbonized bamboo char-
coal (carbonized at 300℃ for 1 h) at different
magnifications. The overall morphology of the as-re-
ceived bamboo remained unchanged even after the
carbonization; however, relatively increased number
of smaller pores appeared at the cross-sectional
surfaces. The appearance of these smaller pores can
Fig. 4. SEM images of carbonized samples at 300°C; (a, b) cross and (c, d) longitudinal sections
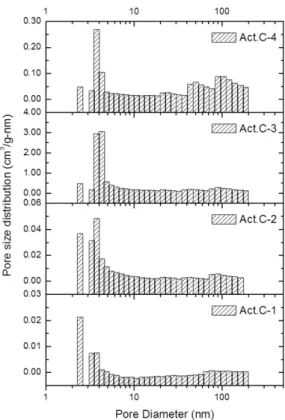
Fig. 5. Pore size distributions of Act.C-1, Act.C-2, Act.C-3 and Act.C-4, obtained from BJH analysis
be attributed to the gasification of the bamboo char- coal during the carbonization process. Besides the surface pore-size modifications in the longitudinal section of the carbonized bamboo charcoal, the tubular structure of the as-received bamboo was improved.
A closer look at longitudinal section of the carbon- ized bamboo charcoal further clarified that the ob- served tubular morphology extraordinarily consisted of cell-like structures having dimensions in range of few tens of microns, which are advantageous for ach- ieving a greater surface area in the activation step.
These cell-like structures leading to greater surface area could be exploited to realize higher capacities in EDLC applications.
The structural, thermal and morphological analyses of the as-received bamboo samples, which were pre- pared for carbonization, showed that the samples car- bonized at 300℃ for 1 h were the optimum. The op- timization was based on the removal of impurities be- fore activation as well as forming the higher yield at the carbonization process. The samples carbonized at the lower temperatures, e.g. 200℃, showed many im- purity/unknown (XRD) peaks, while the samples car- bonized at the higher temperatures such 400 or 600℃
led to lower yield (TGA) of the carbonized product
due to carbon gasification.
3.2 Morphological and surface properties of activated bamboo charcoal
The bamboo samples carbonized at the optimum
temperature (300℃) for 1 h were activated by KOH
soaking and then, thermal treatment. The activation
conditions were varied, as given in Table 1. Then,
BET (Brunauer-Emmett-Teller) specific surface areas
(SSA) of the samples were obtained by using the ad-
sorption/desorption isotherms of N
2at –196℃. Based
on the estimated BET surface areas, four samples
covering a specific range of surface area values were
selected for further characterization having SSA val-
ues as 321, 641, 1670 and 966 m
2/g and were identi-
fied as Act.C-1, Act.C-2, Act.C-3 and Act.C-4, re-
Fig. 6. SEM images of Act.C-1, Act.C-2, Act.C-3 and Act.C-4
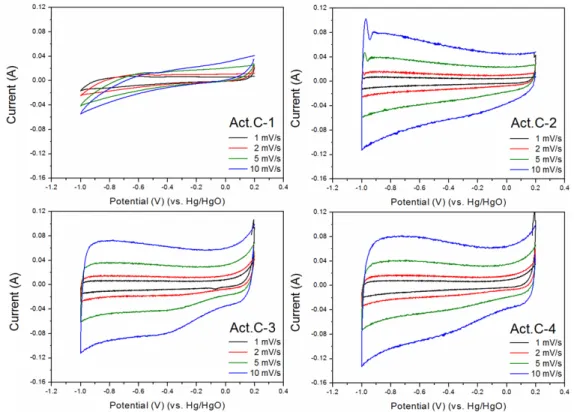
Fig. 7. Cyclic voltammetry (CV) curves of Act.C-1, Act.C-2, Act.C-3 and Act.C-4 electrodes in 6M KOH at different scan rates (1, 2, 5 and 10 mV/s)
spectively (Table 1). The pore size distributions of the selected samples are shown in Fig. 5: all of dis- tributions show the similar characteristic of having higher micro pore volume than macro pore volume.
Estimated micro pore volumes for Act.C-1, Act.C-2,
Act.C-3 and Act.C-4 samples were 0.0213, 0.048, 3.056 and 0.2686 cm
3/g, respectively, which is in agreement with their respective SSA values, confirm- ing the proportionality between surface area and mi- cro pore volume. These samples were further charac- terized by SEM and the results are shown in Fig. 6.
Carbonized samples showed improved porosity
upon activation with KOH solution and were affected
by the activation conditions. Act.C-1 and Act.C-2
samples showed small pores under 1 ㎛ sparsely dis-
tributed on their surfaces. Act.C-3 sample’s pore
morphology mainly consisted of macro-pores, which
may be attributed to the destruction of the micro-pore
structure during activation. Compared to the other
three samples, the Act.C-4 sample showed the highest
porosity. Surface morphology is known to influence
the electrochemical performance of activated carbon,
Fig. 9. Comparison between reported specific capacitances and those of this study as a function of surface area for acti- vated carbon samples. Specific capacitance of (a) this study at 1 mV/s, (b) this study at 10 mV/s, (c) Lipka et al27), (d) Zhao et al28) and (e) Senthilkumar et al23)
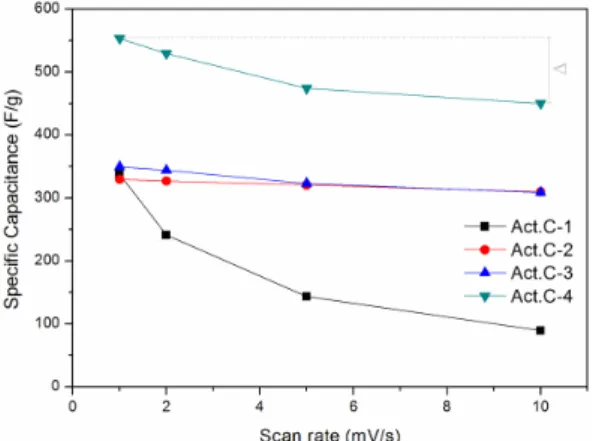
Fig. 8. Variations of specific capacitances of Act.C-1, Act.C-2, Act.C-3 and Act.C-4 electrodes for different scan rates
and thus, the capacitance of the electrodes prepared from it.
3.3 Electrochemical Characterization of activated bamboo charcoal
The capacitance behavior of activated bamboo charcoal was analyzed by cyclic voltammetry (CV) in 6 M KOH electrolytes with the potential range from 0.2 to -1.0V against that of Hg/HgO. Fig. 7 shows the cyclic voltammetry curves of Act.C-1, Act.C-2, Act.C-3 and Act.C-4 electrodes for different scan rates. The shapes of all the CV curves were qua- si-rectangular within the measured potential window.
Among the calculated (Eq. 1) specific capacitances of the four electrodes, the Act.C-4 electrode showed the highest value for the different scan rates. Fig. 8 pres- ents the variation of specific capacitance according to scan rate, which indicates the inverse proportionality between specific capacitance and scan rate.
The reduction amounts of the specific capacitances of the each sample were varied with the scan rate.
The amount of reduction of the specific capacitance was the highest for the Act.C-1 electrode (337 F/g at 1 mV/s to 89 F/g at 10 mV/s; Δ = 248 F/g), followed
by those of Act.C-4 (Δ = 103 F/g), Act.C-3 (Δ = 40 F/g) and Act.C-2 (Δ = 20 F/g) electrodes. Even though the Act.C-4 electrode showed high sensitivity to scan rate, it maintained its relatively higher specific capacitance among the other studied electrodes. Additionally, based on the CV curves, the observed specific capacitance values for the Act.C-3 electrode (450 F/g at 10 mV/s) were higher than the reported values of activated car- bon prepared from other raw materials viz., the ca- pacitance of 320.6 F/g at 10 mV/s for sorghum pith
23), 180 F/g at 2 mV/s for waste paper
24), 86 F/g at 5 mV/s for banana fibers
25)and 156 F/g at 1 mV/s for coffee shells
26).
In general, the surface area is considered an im- portant parameter of high specific capacitance.
However, some researchers have found, based on ex-
perimental data, that carbon materials having lower
specific surface areas can also give higher specific
capacitances. This finding is presented graphically in
Fig. 9, which present the data from literatures
23,27,28)and this work, which correlate surface area and spe-
cific capacitance. These results show that the specific
capacitance not only depends upon the surface area,
but also upon other parameters. The effect of pore
size and disorder may be more dominant than the ef- fect of specific surface area on specific capacitance.
In our case, although the Act.C-3 sample had the highest surface area, Act.C-4 showed the highest spe- cific capacitance. This observed higher specific ca- pacitance can be attributed to the higher ratio of mi- cro and macro pore volumes of Act.C-4 than that of Act.C-3 (Fig. 5).
4. Conclusions
Activated carbon for EDLC applications was fab- ricated by the physicochemical method by using bamboo samples with KOH activation. The opti- mization of carbonization temperature for higher product yield and the variation of activation con- ditions such as KOH concentration and heat treatment temperature and time; produced activated carbon samples with a range of surface areas. The results confirmed that specific capacitance not only depends upon surface area, but also upon other parameters such pore-structure and its amount. In our case, the Act.C-3 sample having the highest surface area of 1670 m
2/g showed 349 F/g at 1 mV/s, while the Act.C-4 sample with surface area of 966 m
2/g showed the highest specific capacitance of 553 F/g at 1 mV/s. This result may be due to the effect of pore size and disorder being more dominant than the effect of specific surface area on specific capacitance. The Act.C-4 sample had a higher ratio of micro and mac- ro pore volume than the Act.C-3 sample. When the electrochemical performances of activated carbon pre- pared from bamboo and from various other agricul- tural products from literature were compared, the ac- tivated carbon prepared from bamboo showed better specific capacitances of 553 F/g at 1mV/s and 450 F/g at 10mV/s.
A detailed study about the correlations between the
activation conditions for synthesis of activated carbon and pore size distribution, surface area, surface chem- istry, etc., respectively, which we believe are respon- sible for higher specific capacitance, is necessary and currently under consideration.
Acknowledgement
This work was supported by Chonnam National University.
References
1. L.L. Zhang and X.S. Zhao, “Carbon-Based Materials as Supercapacitor Electrodes”, Chem. Soc. Rev., Vol. 38, 2009, pp. 2520-2531, doi: https://doi.org/10.1039/b813846j.
2. Y. Zhang, H. Feng, X. Wu, L. Wang, A. Zhang, T. Xia, H. Dong, X. Li, and L. Zhang, “Progress of Electrochemical Capacitor Electrode Materials: A Review”, Int. J. Hydrog. Energy, Vol. 34, 2009, pp. 4889-4899, doi: https://doi.org/10.1016/j.ijhydene.
2009.04.005.
3. S. Kim, B. Gil, G. Hwang, and C. Ryu, “Electrochemical Characteristics of Hybrid Cell Consisting of Li Secondary B atter y and Sup ercapacitor”, Trans. of the Korean Hydrogen and New Energy Society, Vol. 30, 2019, pp. 43-48, doi: https://doi.org/10.7316/KHNES.2019.30.1.43.
4. J.-H . Kim and H .-J. Koo, “An Electric Double-Layer Capacitor Based on Eutectic Gallium-Indium Liquid Metal Electrodes”, Trans. of the Korean Hydrogen and New Energy Society, Vol. 29, pp. 627-634, doi: https://doi.org/10.7316/
KHNES.2018.29.6.627.
5. P. Simon and Y. Gogotsi, “Materials for Electrochemical Capacitors”, Nat. Mater., Vol. 7, 2008, pp. 845-854, doi:
https://doi.org/10.1038/nmat2297.
6. E. Frackowiak and F. Béguin, “Carbon Materials for the Electrochemical Storage of Energy in Capacitors”, Carbon, Vol. 39, 2001, pp. 937-950, doi: https://doi.org/10.1016/
S0008-6223(00)00183-4.
7. R. Baccar, J. Bouzid, M. Feki, and A. Montiel, “Preparation of Activated Carbon from Tunisian Olive-Waste Cakes and Its Application for Adsorption of Heavy Metal Ions”, J. Hazard. Mater., Vol. 162, 2009, pp. 1522-1529, doi:
https://doi.org/10.1016/j.jhazmat.2008.06.041.
8. D. Kalderis, S. Bethanis, P. Paraskeva, and E. Diamadopoulos,
“Production of Activated Carbon from Bagasse and Rice Husk by a Single-Stage Chemical Activation Method at Low
Retention Times”, Bioresour. Technol., Vol. 99, 2008, pp.
6809-6816, doi: https://doi.org/10.1016/j.biortech.2008.01.041.
9. I.A.W. Tan, A.L. Ahmad, and B.H. Hameed, “Optimization of Preparation Conditions for Activated Carbons from Coconut Husk Using Response Surface Methodology”, Chem. Eng. J., Vol. 137, 2008, pp. 462-470, doi: https://doi.
org/10.1016/j.cej.2007.04.031.
10. D. Adinata, W.M.A. Wan Daud, and M.K. Aroua,
“Preparation and Characterization of Activated Carbon from Palm Shell by Chemical Activation with K2CO3”, Bioresour. Technol., Vol. 98, 2007, pp. 145-149, doi:
https://doi.org/10.1016/j.biortech.2005.11.006.
11. T.Y. Lo, H.Z. Cui, P.W.C. Tang, and H.C. Leung, “Strength Analysis of Bamboo by Microscopic Investigation of Bamboo Fibre”, Constr. Build. Mater., Vol. 22, 2008, pp. 1532-1535, doi: https://doi.org/10.1016/j.conbuildmat.2007.03.031.
12. H. Chen, M. Miao, and X. Ding, “Influence of Moisture Absorption on the Interfacial Strength of Bamboo/Vinyl Ester Composites”, Compos. Pt. A-Appl. Sci. Manuf., Vol. 40, 2009, pp. 2013-2019, doi: https://doi.org/10.1016/
j.compositesa.2009.09.003.
13. M. Wang, Z.-H. Huang, G. Liu, and F. Kang, “Adsorption of Dimethyl Sulfide from Aqueous Solution by a Cost-Effective Bamboo Charcoal”, J. Hazard. Mater., Vol. 190, 2011, pp.
1009-1015, doi: https://doi.org/10.1016/j.jhazmat.2011.04.041.
14. C .A. Fuentes, L.Q .N . Tran, C. D upont-G illain, W.
Vanderlinden, S. De Feyter, A.W. Van Vuure, and I. Verpoest,
“Wetting Behaviour and Surface Properties of Technical Bamboo Fibres”, Colloid Surf. A-Physicochem. Eng. Asp., Vol. 380, 2011, pp. 89-99, doi: https://doi.org/10.1016/j.col
surfa.2011.02.032.
15. P. Ruetschi, F. Meli, and J. Desilvestro, “Nickel-Metal Hydride Batteries. The Preferred Batteries of the Future?”, J. Power Sources, Vol. 57, 1995, pp. 85-91, doi: https://doi.org/10.10
16/0378-7753(95)02248-1.
16. C. Moreno-Castilla, F. Carrasco-Marı́n, M.V. López-Ramón, and M.A. Alvarez-Merino, “Chemical and Physical Activation of Olive-Mill Waste Water to Produce Activated Carbons”, Carbon, Vol. 39, 2001, pp. 1415-1420, doi:
https://doi.org/10.1016/S0008-6223(00)00268-2.
17. F.-C. Wu, R.-L. Tseng, and C.-C. Hu, “Comparisons of Pore Properties and Adsorption Performance of KOH-Activated and Steam-Activated Carbons”, Microporous Mesoporous Mat., Vol. 80, 2005, pp. 95-106, doi: https://doi.org/10.1016/
j.micromeso.2004.12.005.
18. J.i. Hayashi, A. Kazehaya, K. Muroyama, and A.P. Watkinson,
“Preparation of Activated Carbon from Lignin by Chemical Activation”, Carbon, Vol. 38, 2000, pp. 1873-1878, doi:
https://doi.org/10.1016/S0008-6223(00)00027-0.
19. H. Yang, R. Yan, H. Chen, D.H. Lee, and C. Zheng,
“Characteristics of Hemicellulose, Cellulose and Lignin Pyrolysis”, Fuel, Vol. 86, 2007, pp. 1781-1788, doi:
https://doi.org/10.1016/j.fuel.2006.12.013.
20. M. Inagaki, Y. Hishiyama, and Y. Kaburagi, “Effect of Heating Rate During Carbonization on Graphitization of Carbon Films Derived from Aromatic Polyimides”, Carbon, Vol. 32, 1994, pp. 637-639, doi: https://doi.org/10.1016/0008-6223
(94)90083-3.
21. G.-Q. Zhang and S.-T. Zhang, “Characterization and Electrochemical Applications of a Carbon with High Density of Surface Functional Groups Produced from Beer Yeast”, J. Solid State Electrochem., Vol. 13, 2009, pp.
887-893, doi: https://doi.org/10.1007/s10008-008-0623-2.
22. B. Viswanathan, P.I. Neel, and T.K. Varadarajan, “Methods of Activation and Specific Applications of Carbon Materials”, National Centre for Catalysis Research, 2009, pp. 160.
23. S.T. Senthilkumar, B. Senthilkumar, S. Balaji, C. Sanjeeviraja, and R. Kalai Selvan, “Preparation of Activated Carbon from Sorghum Pith and Its Structural and Electrochemical Properties”, Mater. Res. Bull., Vol. 46, 2011, pp. 413-419, doi: https://doi.org/10.1016/j.materresbull.2010.12.002.
24. D. Kalpana, S.H. Cho, S.B. Lee, Y.S. Lee, R. Misra, and N.G.
Renganathan, “Recycled Waste Paper—A New Source of Raw Material for Electric Double-Layer Capacitors”, J. Power Sources, Vol. 190, 2009, pp. 587-591, doi: https://doi.org/
10.1016/j.jpowsour.2009.01.058.
25. V. Subramanian, C. Luo, A.M. Stephan, K.S. Nahm, S. Thomas, and B. Wei, “Supercapacitors from Activated Carbon Derived from Banana Fibers”, J. Phys. Chem. C, Vol. 111, 2007, pp. 7527-7531, doi: https://doi.org/10.1021/jp067009t.
26. M.R. Jisha, Y.J. Hwang, J.S. Shin, K.S. Nahm, T. Prem Kumar, K. Karthikeyan, N. Dhanikaivelu, D. Kalpana, N.G. Renganathan, and A.M. Stephan,“Electrochemical Characterization of Supercapacitors Based on Carbons Derived from Coffee Shells”, Mater. Chem. Phys., Vol. 115, 2009, pp. 33-39, doi: https://doi.org/10.1016/j.matchemphys.
2008.11.010.
27. S.M. Lipka, “Electrochemical Capacitors Utilizing Low Surface Area Carbon Fiber”, IEEE Aerosp. Electron. Syst.
Mag., Vol. 12, 1997, pp. 27-30, doi: https://doi.org/10.1109/
62.596653.
28. X.-Y. Zhao, J.-P. Cao, K. Morishita, J.-i. Ozaki, T. Takarada,
“Electric Double-Layer Capacitors from Activated Carbon Derived from Black Liquor”, Energy Fuels, Vol. 24, 2010, pp. 1889-1893, doi: https://doi.org/10.1021/ef901299c.