• 검색 결과가 없습니다.

QTL Analysis of Teat Number Traits in an F<sub>2</sub> Intercross between Landrace And Korean Native Pigs

N/A
N/A
Protected

Academic year: 2021

Share "QTL Analysis of Teat Number Traits in an F<sub>2</sub> Intercross between Landrace And Korean Native Pigs"

Copied!
6
0
0

로드 중.... (전체 텍스트 보기)

전체 글

(1)

http://dx.doi.org/10.12750/JET.2016.31.4.313

QTL Analysis of Teat Number Traits in an F 2 Intercross between Landrace And Korean Native Pigs

Hee-Bok Park

1*

, Sang-Hyun Han

2*

, Chae-Kyoung Yoo

3

, Jae-Bong Lee

4

, Sang-Rae Cho

5

, and In-Cheol Cho

1†

1

Subtropical Livestock Research Institute, National Institute of Animal Science, RDA, 63242 Jeju, Republic of Korea.

2

Educational Science Research Institute, Jeju National University, Jeju, Republic of Korea.

3

Institute of Agriculture and Life Sciences, Gyeongsang National University, 52828 Jinju, Republic of Korea.

4

Korea Zoonosis Research Institute, Chonbuk National University, 54531 Iksan, Republic of Korea.

5

Hanwoo Research Institute, National Institute

of Animal Science, RDA, 25340.

ABSTRACT

The aim of this study was to identify quantitative trait loci (QTLs) influencing teat number traits in an F

2

intercross between Landrace and Korean native pigs (KNP). Three teat number traits (left, right, and total) were measured in 1105 F
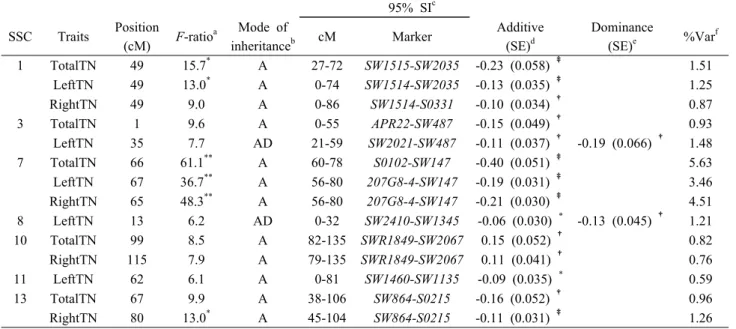
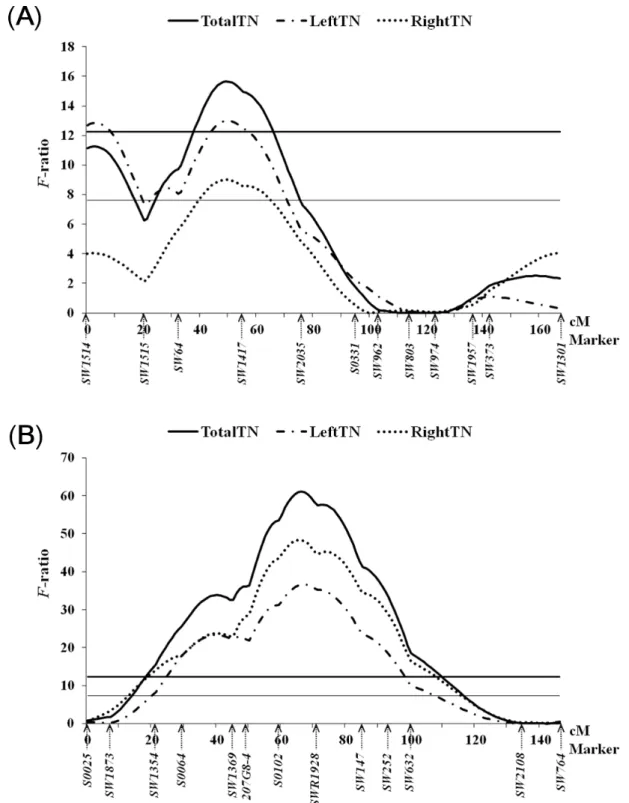
2

progeny. All experimental animals were genotyped with 173 informative microsatellite markers located throughout the pig genome. We detect that seven chromosomes harbored QTLs for teat number traits: genome regions on SSC1, 3, 7, 8, 10, 11, and 13. Six of fourteen identified QTL reached genome-wide significance. In SSC7, we identified a major QTL affecting total teat number that accounted for 5.6 % of the phenotypic variance, which was the highest test statistic (F-ratio = 61.1 under the additive model, nominal P = 1.3×10

-14

) observed in this study. In this region, QTL for left and right teat number were also detected with genome-wide significance. With exception of the QTL in SSC10, the allele from KNP in all 6 identified QTLs was associated with decreased phenotypic values.

In conclusion, our study identified both previously reported and novel QTL affecting teat number traits. These results can play an important role in determining the genetic structure underlying the variation of teat number in pigs.

(Key words: teat number, quantitative trait locus, genome-wide linkage analysis, Landrace and Korean native pigs)

* Hee-Bok Park and Sang-Hyun Han contributed equally to this study.

†Correspondence: In-Cheol Cho Tel: +82-64-754-5710

E-mail address: [email protected]

INTRODUCTION

There are two kinds of Korean native pigs: the indigenous pig raised on the Korean Peninsula and the Jeju native pig inhabited on Jeju Island. Owing to being raised on an island that has been isolated for more than 1,000 years, the Jeju native pig (hereafter, the Jeju native pig is referred to as KNP) has exclusive genetic properties that are different from those of the pigs raised on the Korea Peninsula (Cho et al., 2009).

The coat color of KNP is black, and its feed efficiency and growth rate are low, as with most native breeds. However, KNP is famous for their meat quality features, such as reddish meat color and a high degree of marbling.

The teat number traits are important in swine industry due to the fact that it is a part of lactation organs and is related with the mothering ability and live litter size. Teat numbers vary between-breed and also within-breed. When the teat

numbers of Duroc, Large White and Landrace pig breeds were measured, the average values were 13.6, 14.3, and 14.4, respectively. Compared to the Western breeds, the teat number of KNP is lower; it is on average 13.2 for KNP (I-.C. Cho, Unpublished data). The teat number traits show low (0.20) to medium (0.50) heritabilities (Ding et al., 2009). Thus, it is important to elucidate the genetic foundation of this trait to improve genetic potentials of postnatal care of piglet. Several genome scanning analyses have been conducted to delineate the genome-wide map of QTL for teat number traits (left, right, and total) in pigs with the exception of SSC9, 13, 14, 18, and Y-chromosome (summarized in PigQTLdb: http://www.

animalgenome.org/cgi-bin/QTLdb/SS/index). In this study, we identified QTL affecting teat number traits using an F2 intercross between Landrace and Korean native pigs (KNP).

We also present the identification of previously reported and

novel QTL for teat number traits in pigs.

(2)

Table 1. Summary of identified QTL for teat number traits

95% SI

c

SSC Traits Position

(cM) F-ratio

a

Mode of

inheritance

b

cM Marker Additive

(SE)

d

Dominance

(SE)

e

%Var

f

1 TotalTN 49 15.7

*

A 27-72 SW1515-SW2035 -0.23 (0.058)

1.51

LeftTN 49 13.0

*

A 0-74 SW1514-SW2035 -0.13 (0.035)

1.25

RightTN 49 9.0 A 0-86 SW1514-S0331 -0.10 (0.034)

0.87

3 TotalTN 1 9.6 A 0-55 APR22-SW487 -0.15 (0.049)

0.93

LeftTN 35 7.7 AD 21-59 SW2021-SW487 -0.11 (0.037)

-0.19 (0.066)

1.48

7 TotalTN 66 61.1

**

A 60-78 S0102-SW147 -0.40 (0.051)

5.63

LeftTN 67 36.7

**

A 56-80 207G8-4-SW147 -0.19 (0.031)

3.46

RightTN 65 48.3

**

A 56-80 207G8-4-SW147 -0.21 (0.030)

4.51

8 LeftTN 13 6.2 AD 0-32 SW2410-SW1345 -0.06 (0.030)

*

-0.13 (0.045)

1.21

10 TotalTN 99 8.5 A 82-135 SWR1849-SW2067 0.15 (0.052)

0.82

RightTN 115 7.9 A 79-135 SWR1849-SW2067 0.11 (0.041)

0.76

11 LeftTN 62 6.1 A 0-81 SW1460-SW1135 -0.09 (0.035)

*

0.59

13 TotalTN 67 9.9 A 38-106 SW864-S0215 -0.16 (0.052)

0.96

RightTN 80 13.0

*

A 45-104 SW864-S0215 -0.11 (0.031)

1.26

a

Test statistic and level of significance genome-wide significance (**1%, *5%) thresholds.

b

A represents additive effect; AD represents additive and dominance effects.

c

95% support intervals estimated by the 1.5-LOD drop method. Flanking markers for the QTL support intervals.

d

Additive effect and standard error. A positive value means the Jeju native pig allele has an increase effect on a trait, and a negative value indicates that the Landrace allele has an increase effect on a trait.

e

Dominant effect and standard error.

f

Var % is the reduction in residual variance of the F2 population obtained by inclusion of a QTL at the given position.

*

P<0.05,

P<0.01,

P<0.001

MATERIALS and METHODS

1. Experimental animals and phenotypes

A three-generation resource population was generated and managed as described by Cho et al. (2011). Nineteen purebred KNP were crossed with 17 purebred Landrace. From these crosses, 91 F1 progeny and 1105 F2 progeny from 79 full-sib families were produced. Each of the F2 progeny, teat numbers at the left- (LeftTN) and the right- (RightTN) hand side were recorded by simple counting. The total teat number (TotalTN) was the sum of the teat number at both sides.

2. Genotypes and genetic map

A total of 173 informative microsatellite markers covering the autosomes and X chromosome were PCR-amplified in 1232 pigs. The map order and genetic distance were determined using the build option in the CRIMAP software version 2.4 (Green et al. 1990). The total map length was 2348.8 cM

3. Statistical analysis.

An interval mapping model based on least squares regression was used for QTL analysis, including the cofactors of sex, full-sib, along with additive and dominance effects (2 d.f.) for a putative QTL. We used a web-based GridQTL program to conduct QTL analysis (Seaton et al., 2006).

Identification of QTL was based on an F-ratio test statistic comparing a full model with a reduced model (with the cofactors only). The F-ratios were calculated at 1-cM intervals across the genome. Selection of the final genetic model for the QTL analysis was according to Cho et al. (2011). To detect a single QTL, genome-wide empirical significant thresholds of the test statistic (i.e., F-ratio) were obtained by 1,000 permutations of data (Churchill and Doerge, 1994).

Genome-wide thresholds for highly significant (a=0.01) and

significant linkage (a=0.05) were employed. Suggestive

linkage was employed using a 5% chromosome-wide

threshold. The 1.5-LOD (logarithm of odds) drop method was

used to estimate support intervals for identified QTL at the

suggestive and significant levels of significance (Dupuis and

(3)

Siegmund, 1999). The verifications of novel QTL were done by comparing the flanking markers of previously reported QTL in the pig QTLdb (http://www.animalgenome.org /QTLdb/pig) with those of newly detected QTL in this study.

RESULTS and DISCUSSION

We identified six significant QTL and eight suggestive QTL in seven chromosomes (SSC1, 3, 7, 8, 10, 11, and 13) (Table 1). In SSC1, we detected two significant QTL for the TotalTN (nominal P = 8.1×10

-5

) and LeftTN (nominal P = 0.0003), and one suggestive QTL for RightTN at the same position (49 cM) (Fig. 1A). These QTL explained up to 1.51% of the phenotypic variance. At these QTL loci, alleles from the KNP were associated with decreased phenotypic values. QTL region affecting TotalTN overlapped with previously reported QTL regions in other studies (Wada et al., 2000; Guo et al., 2008;

Ding et al., 2009), while the previous studies did not report the QTL for LeftTN and RightTN. In SSC3, we identified two suggestive QTL for TotalTN (1 cM) and LeftTN (35 cM). The QTL at 35 cM showed decreased teat number with the estimated additive effect of -0.11±0.037 and the dominance effect of -0.19±0.049. These QTLs accounted up to 1.48% of the phenotypic variance, and overlapped with QTL regions reported in previous studies (Guo et al., 2008; Ding et al., 2009). In SSC7, we identified most of the significant QTL (Fig. 1B). QTL for TotalTN (66 cM, nominal P = 1.3×10

-14

), LeftTN (67 cM, nominal P = 1.9×10

-9

), and RightTN (65 cM, nominal P = 6.4×10

-12

) were detected highly significant QTL and explained up to 5.63% of the phenotypic variance. With only an additive effect, the alleles at these QTL from KNP were associated with decreased phenotypic values. In SSC7, many QTL affecting teat number traits were reported in previous studies (Cassady et al., 2001; Wada et al., 2000; Sato et al., 2006; Zhang et al., 2007; Bidanel et al., 2008; Guo et al., 2008; Ding et al., 2009). In our current study, QTL for TotalTN, LeftTN, and RightTN were overlapped with QTL in previous studies with exception of QTL reported in Cassady et al. (2001) and Sato et al. (2006). Sato et al. (2003), Mikawa et al. (2005), and Ding et al. (2009) were reported co-localization of QTL for vertebra number in a QTL region affecting teat number traits. The KNP alleles at these QTL were associated with decrease phenotypic value likewise QTL

affecting teat number traits. In SSC8, we identified one suggestive QTL for LeftTN at 13 cM. This QTL explained 1.21% of the phenotypic variance, and it was novel. The QTL at this position showed estimated additive effect of -0.06

±0.030 and the dominance effect of -0.13±0.045. In SSC10, we detected two suggestive QTL for TotalTN (99 cM) and RightTN (115 cM). QTL for TotalTN is overlapped with previous reported QTL (Rohrer, 2000; Hirooka et al., 2001;

Dragos-Wendrich et al., 2003; Rodriguez et al., 2005; Guo et al., 2008), but QTL for RightTN was novel. At these loci, allele from KNP was associated with increased phenotypic value unlike other QTL. QTL affecting LeftTN was detected with suggestive level in SSC11 (62 cM), and it was novel. In SSC13, we identified QTL affecting TotalTN (67 cM) and RightTN (80 cM). QTL for RightTN was detected with significant level (F-ratio = 13.0 under the additive model, nominal P = 0.0003), explained 1.26% of the phenotypic variance; this QTL was novel.

No QTL associated with teat number traits was detected in the X chromosome. In all of the identified QTL affecting teat number traits, the KNP allele was always associated with lower teat number, whereas the Landrace allele was associated with higher phenotypic values with the exception of QTL in SSC10. These results are consistent with the observed increase of teat number in Western breeds through selective breeding.

In conclusion, we conducted a genome-wide QTL analysis for teat number traits using an F2 intercross between KNP and Landrace pigs. A total of 14 QTLs were identified for teat number traits. The results from this study not only revealed novel QTLs but also verified previously reported QTLs. The results presented herein can play an important role in investigating the genetic structure of phenotypic variation of teat number traits in pigs.

ACKNOWLEDGMENTS

This work was supported by a grant from the National

Institute of Animal Science (Project title: Study on breed

preservation and applied technology development in Jeju

native domestic animals; Project No.PJ01010502), Rural

Development Administration, Republic of Korea.

(4)

Fig. 1 Test statistic profiles for teat number traits on (A) SSC1 and (B) SSC7 using an F2 intercross between Landrace and Korean native pigs. Marker map with genetic distance between microsatellite markers in Kosambi cM is given on the x-axis. The y-axis represents the F-value testing the hypothesis of a single QTL in a given position on the chromosome. The thick horizontal line indicate the 5%

genome-wide significant threshold and thin horizontal line indicate the 5 % chromosome-wise significant threshold. Trait abbreviations

are listed in Supplementary table 1.

(5)

Supplementary table 1. Statistics of teat number traits in the F2 progeny of an intercross between Landrace and Korean native pigs Correlation coefficients

Trait Abbr. N Mean SD Range TotalTN LeftTN RightTN

Total teat number TotalTN 1105 13.7 1.3 10-18 1

Left teat number LeftTN 1105 6.8 0.7 5-9 0.872

1

Right teat number RightTN 1105 6.9 0.7 5-9 0.875

0.525

1

‡P<0.001

REFERENCES

Bidanel JP, Rosendo A, Iannuccelli N, Riquet J, Gilbert H, Caritez JC, Billon Y, Amigues Y, Prunier A and Milan D.

2008. Detection of quantitative trait loci for teat number and female reproductive traits in Meishan x Large White F2 pigs. Animal 2: 813-820.

Cassady JP, Johnson RK, Pomp D, Rohrer GA, Van Vleck LD, Spiegel EK and Gilson KM. 2001. Identification of quantitative trait loci affecting reproduction in pigs. J.

Anim. Sci. 79: 623-633.

Cho IC, Park HB, Yoo CK, Lee GJ, Lim HT, Lee JB, Jung EJ, Ko MS, Lee JH and Jeon JT. 2011. QTL analysis of white blood cell, platelet and red blood cell-related traits in an F2 intercross between Landrace and Korean native pigs.

Anim. Genet. 42: 621-626.

Cho I.C, Han SH, Fang M, Lee SS, Ko MS, Lee H, Lim HT, Yoo CK, Lee JH and Jeon JT. 2009. The robust phylogeny of Korean wild boar (Sus scrofa coreanus) using partial D-loop sequence of mtDNA. Mol. Cells 28:423–430.

Churchill GA and Doerge RW. 1994. Empirical threshold values for quantitative trait mapping. Genetics 138:

963-971.

Ding N, Guo Y, Knorr C, Ma J, Mao H, Lan L, Xiao S, Ai H, Haley CS, Brenig B and Huang L .2009. Genome-wide QTL mapping for three traits related to teat number in a White Duroc x Erhualian pig resource population. BMC genet. 10: 6-2156-10-6.

Dragos-Wendrich M, Moser G, Bartenschlager H, Reiner G and Geldermann H. 2003. Linkage and QTL mapping for Sus scrofa chromosome 10. J. Anim. Breed. Genet. 120: 82 –88.

Dupuis J and Siegmund D. 1999. Statistical methods for mapping quantitative trait loci from a dense set of markers.

Genetics 151: 373-386.

Green P, Falls K and Crooks S (1990) Documentation for CRIMAP, Version 2.4. Washington Univ. School of

Medicine, St. Louis, MO.

Guo YM, Lee GJ, Archibald AL and Haley CS. 2008.

Quantitative trait loci for production traits in pigs: a combined analysis of two Meishan x Large White populations. Anim. Genet. 39: 486-495.

Hirooka H, de Koning DJ, Harlizius B, van Arendonk JA, Rattink AP, Groenen MA, Brascamp EW and Bovenhuis H. 2001. A whole-genome scan for quantitative trait loci affecting teat number in pigs. J. Anim. Sci. 79: 2320-2326.

Mikawa S, Hayashi T, Nii M, Shimanuki S, Morozumi T and Awata T. 2005. Two quantitative trait loci on Sus scrofa chromosomes 1 and 7 affecting the number of vertebrae. J.

Anim. Sci. 83: 2247-2254.

Rodriguez C, Tomas A, Alves E, Ramirez O, Arque M, Munoz G, Barragan C, Varona L, Silio L, Amills M and Noguera JL. 2005. QTL mapping for teat number in an Iberian-by-Meishan pig intercross. Anim. Genet. 36:

490-496.

Rohrer GA. 2000. Identification of quantitative trait loci affecting birth characters and accumulation of backfat and weight in a Meishan-White Composite resource population.

J. Anim. Sci. 78: 2547-2553.

Sato S, Oyamada Y, Atsuji K, Nade T, Sato S, Kobayashi E, Mitsuhashi T, Nirasawa K, Komatsuda A, Saito Y, Terai S, Hayashi T and Sugimoto Y. 2003. Quantitative trait loci analysis for growth and carcass traits in a Meishan x Duroc F2 resource population. J. Anim. Sci. 81: 2938-2949 Sato S, Atsuji K, Saito N, Okitsu M, Sato S, Komatsuda A,

Mitsuhashi T, Nirasawa K, Hayashi T, Sugimoto Y and Kobayashi E. 2006. Identification of quantitative trait loci affecting corpora lutea and number of teats in a Meishan x Duroc F2 resource population J. Anim. Sci. 84:

2895-2901.

Seaton G, Hernandez J, Grunchec JA, White I, Allen J, De Koning DJ, Wei W, Berry D, Haley C and Knott S. 2006.

GridQTL: A grid portal for QTL mapping of compute

intensive datasets. Proceedings of the 8th World Congress

(6)

on Genetics Applied to Livestock Production.

Wada Y, Akita T, Awata T, Furukawa T, Sugai N, Inage Y, Ishii K, Ito Y, Kobayashi E, Kusumoto H, Matsumoto T, Mikawa S, Miyake M, Murase A, Shimanuki S, Sugiyama T, Uchida Y, Yanai S and Yasue H. 2000. Quantitative trait loci (QTL) analysis in a Meishan x Gottingen cross population. Anim. Genet. 31: 376-384.

Zhang J, Xiong Y, Zuo B, Lei M, Jiang S, Li F, Zheng R, Li J and Xu D. 2007. Detection of quantitative trait loci

associated with several internal organ traits and teat number trait in a pig population. J. Genet. Genomics 34:

307-314.

Received August 23 2016, Revised September 30, 2016,

Accepted September 30, 2016

수치

Table 1. Summary of identified QTL for teat number traits
Fig. 1 Test statistic profiles for teat number traits on (A) SSC1 and (B) SSC7 using an F2 intercross between Landrace and Korean native pigs

참조

관련 문서

This study was conducted to recognize the importance of self - management of dance major students and to understand the relationship between the sub -

This study was to do a comparative analysis on kinematic differences and differences in muscle activity between the skilled and the unskilled in windsurfing

Fourth, for the sub-factors of personality traits according to weight lifters’ education, while there was a high difference in neuroticism and agreeableness

The aim of this study was not only to compare the differences of ego-resilience between students with high experience and students with low experience in

Objectives: The aim of this study was to study the relationship between smoking, alcohol drinking and vitamin D level among Korean adults using data from the

The purpose of this study was to investigate the relationship between vocabulary learning strategies and vocabulary ability of Korean middle school students

In chemistry, Gibbs' phase rule describes the possible number of degrees of freedom (F) in a closed system at equilibrium, in terms of the number of separate phases (P) and

In chemistry, Gibbs' phase rule describes the possible number of degrees of freedom (F) in a closed system at equilibrium, in terms of the number of separate phases (P) and