Journal of the Korean Institute of Industrial Engineers http://dx.doi.org/10.7232/JKIIE.2012.38.4.276
Vol. 38, No. 4, pp. 276-284, December 2012. © 2012 KIIE
ISSN 1225-0988 | EISSN 2234-6457
분류 성능 향상을 위한 지역적 선형 재구축 기반 결측치 대치
강 필 성
서울과학기술대학교 글로벌융합산업공학과
Missing Value Imputation based on Locally Linear Reconstruction for Improving Classification Performance
Pilsung Kang
Industrial and Information Systems Engineering, Seoul National University of Science and Technology (Seoultech)
Classification algorithms generally assume that the data is complete. However, missing values are common in real data sets due to various reasons. In this paper, we propose to use locally linear reconstruction (LLR) for missing value imputation to improve the classification performance when missing values exist. We first investigate how much missing values degenerate the classification performance with regard to various missing ratios. Then, we compare the proposed missing value imputation (LLR) with three well-known single imputation methods over three different classifiers using eight data sets. The experimental results showed that (1) any imputation methods, although some of them are very simple, helped to improve the classification accuracy; (2) among the imputation methods, the proposed LLR imputation was the most effective over all missing ratios, and (3) when the missing ratio is relatively high, LLR was outstanding and its classification accuracy was as high as the classification accuracy derived from the compete data set.
Keywords: Locally Linear Reconstruction (LLR), Missing Value Imputation, Classification.
1. 서 론
(Data Mining) (Machine Learning) (Classification)
(completeness) .
,
( ,
, ) (missing
value)
(Batista and Monard, 2003).
, ,
, (Barnard
and Meng, 1999). Acuna and Rodriguez(2004) 1%
, 1~5%
, 5~15%
, 15%
.
(missing value imputation)
(Jerez et al., 2010; Jerzy and Hu, 2000; Li et al., 2009; Yu et al., 2011; Zhang and Liu, 2009).
(randomness)
(Little and Rubin, 1987).
본 연구는 서울과학기술대학교 교내연구비의 지원을 받아 수행되었습니다.
연락저자 강필성 교수, 139-743 서울시 노원구 공릉길 138 서울과학기술대학교 글로벌융합산업공학과, Tel : 02-970-7286, Fax : 02-974-5388, E-mail : [email protected]
2012년 7월 23일 접수; 2012년 9월 27일 수정본 접수; 2012년 10월 5일 게재 확정.
분류 성능 향상을 위한 지역적 선형 재구축 기반 결측치 대치 277
(missing completely at random; MCAR) : ,
(missing value imputation) .
(missing at random; MAR) : ,
, .
, ‘ ’
‘ ’
(Su et al., 2008).
(not missing at random; NMAR) : ,
. ,
‘ ’ ‘ ’
.
(domain knowledge) .
(Batista and Monard, 2003; Farhangfar et al., 2008; Su et al., 2008).
. , .
,
. (classification and regression tree; CART) (splitting point)
(Breiman et al., 1984).
(Naive Bayesian Classifier) ,
(Sommerfield, 1997). k- (k-
Nearest Neighbor) ,
,
0 ,
(Witten and Frank, 2005). ,
. (single imputation)
(multiple imputation) .
, .
/ (mean/median imputation; MEI) : ,
( ) ( )
(Farhangfar et al., 2008; Jerez et al., 2010).
k- (k-Nearest Neighbor Imputation; k-NN) : k , k = 1 ‘Hot deck’
(Farhangfar et al., 2008; Garcia-Laencina et al., 2009).
(expectation conditional maximization;
ECM) : (multi-variate
Gaussian distribution) .
(Ghahramani and Jordan, 1994; Su et al., 2008).
: ,
. ,
.
(Hron et al., 2010), (Ennett et al., 2008), (Farhangfar et al., 2007) . (Zhang, 2003)
,
.
Multivariate imputation by chained equations(MICE)(van
Buuren, 2011) : ,
chained equation . .
Boosting(Farhangfar et al., 2007) : 3
. MEI
,
t- .
Boosting
.
. ,
,
, .
278 Pilsung Kang
(a) A new instance
(c) Find critical neighbors
(b) Find k-NN(k = 5 in this example)
(d) Assign weights Figure 1. An illustrative example of LLR procedure
,
, ,
.
,
.
(locally linear reconstruction; LLR)
. LLR k-
, k
(Kang and Cho,
2008). LLR
,
1% 50%
. , 3
LLR 3
LLR .
. 2
LLR . 3
LLR
, , ,
. 4 , 5
.
2. 지역적 선형 재구축을 통한 결측치 대치
(Locally linear reconstruction; LLR)(Kang and Cho, 2008) k-
,
(1) . (
) ,
(
) k
(
) .
(1)
Missing Value Imputation based on Locally Linear Reconstruction for Improving Classification Performance 279
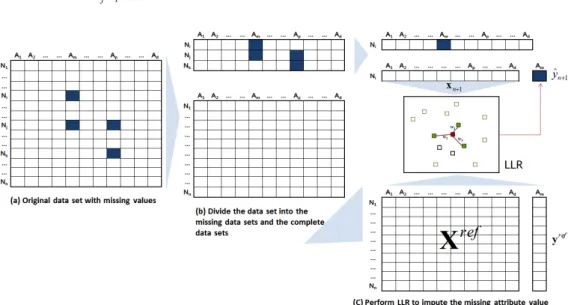
Figure 2. The procedure of LLR-based missing value imputation
LLR <Figure 1> .
(reference set) k
(<Figure 1>(a) ).
(distance) ,
(2) Minkowski distance
.
(2)
p 1 p = 2
(Euclidean distance) . LLR
k
(weights) .
(3)
(reconstruction error; E(w)) .
(3)
j
. (3)
(hyperplane)
,
.
LLR (4)
.
(4)
LLR k (3)
0 . 0
k’ k k’ , (3)
k* LLR k
k* k . k*
,
k , LLR
(Kang and Cho, 2008). , LLR k k-
k .
LLR <Figure 2>
. n d
, i m , j m, p
, k p ( )
. LLR
(missing data set)
(complete data set) (<Figure 2>(b) ). ,
.
. <Figure 3>(c) i m
, (d-1) (1, 2, , m-1, m+1, d) (
) 1 (m) (
)
. , . ,
<Figure 3>(c) (n-3)×(d-1) (
) (n-3)×
1 (
) .
LLR
280 강 필 성
(<Figure 3>(c) ).
.
LLR . ,
. 1
,
, LLR k
. ,
. , LLR
. .
, LLR .
3. 실험 설계
LLR . ,
. , LLR
.
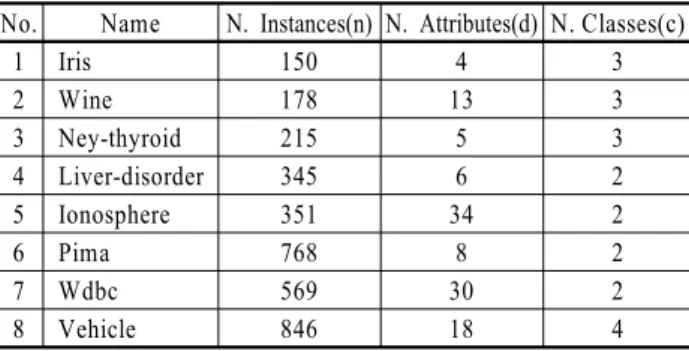
Table 1. The description of the data sets used in this paper No. Name N. Instances(n) N. Attributes(d) N. Classes(c)
1 Iris 150 4 3
2 Wine 178 13 3
3 Ney-thyroid 215 5 3
4 Liver-disorder 345 6 2
5 Ionosphere 351 34 2
6 Pima 768 8 2
7 Wdbc 569 30 2
8 Vehicle 846 18 4
UCI Machine Learning Repository
8 .
, <Table 1> .
8 ,
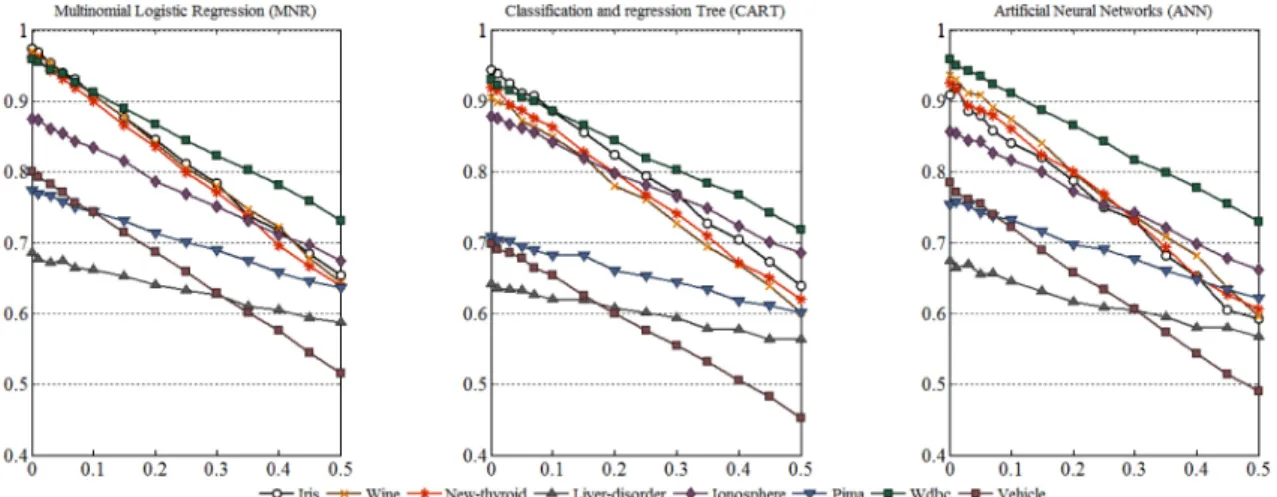
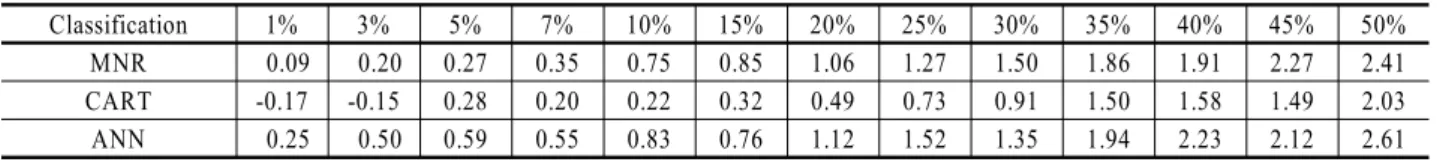
. , 0%, 1%, 3%, 5%, 7%, 10%, 15%, 20%, 25%, 30%, 35%, 40%, 45%, 50% 14
.
, 1 (d/2)
.
30 1
420 (14 × 30 )
. LLR
. / (mean/median imputation; MEI) :
(
) ( )
Hot deck :
(expectation conditional maximization;
ECM) : (multi-variate
Gaussian distribution)
(discard) (complete data)
(discard, complete, MEI, Hot-deck, ECM, LLR)
. , 2
4
(multi-class classification)
(Multimonial logistic regression; MNR, MuCullagh and Nelder 1990), (classification and regression tree; CART, Breiman et al., 1984), (artificial neural network; ANN,
Bishop 2006) .
5-fold (cross-validation) .
, .
(5)
. n
i
, I(·) ,
1 0
.
Classification Accuracy =