• 검색 결과가 없습니다.

Reliability and Validity of the Femorotibial Mechanical Axis Angle in Primary Total Knee Arthroplasty: Navigation versus Weight Bearing or Supine Whole Leg Radiographs

N/A
N/A
Protected

Academic year: 2021

Share "Reliability and Validity of the Femorotibial Mechanical Axis Angle in Primary Total Knee Arthroplasty: Navigation versus Weight Bearing or Supine Whole Leg Radiographs"

Copied!
8
0
0

로드 중.... (전체 텍스트 보기)

전체 글

(1)

Introduction

An effective surgical technique and preoperative planning for

accurate prosthesis positioning along the mechanical axis in pri­

mary total knee arthroplasty (TKA) is crucial to prevention of implant wear and reduction of revision rates

1­3)

.

Many activities of daily living involve weight bearing (WB) knee positions. Therefore, various studies have reported on in vivo WB knee kinematics

4­6)

. However, the effects of WB on the kinematics of TKA are still unknown. The interest in the kinematics of TKA has recently increased because studies have shown that alteration of knee motion patterns can lead to both abnormal wear of prosthetic components and damage to soft tissue

5,7,8)

. Thus, it is important to evaluate the effects of WB on alignment to determine how to optimize stability in the pros­

thetic knee. Among many methods that have been introduced to achieve appropriate postoperative alignment, navigation offers

Reliability and Validity of the Femorotibial Mechanical Axis Angle in Primary Total Knee Arthroplasty:

Navigation versus Weight Bearing or Supine Whole Leg Radiographs

Seong Hwan Kim, MD, Yong­Beom Park, MD, Min­Ku Song, MD, Jung­Won Lim, MD, and Han­Jun Lee, MD, PhD

Department of Orthopedic Surgery, Chung­Ang University College of Medicine, Seoul, Korea

Purpose: To evaluate the reliability and validity of the femorotibial mechanical axis angle from radiographs in the weight bearing (WB) and supine positions compared with navigation­measured values.

Materials and Methods: Sixty­eight cases of navigation­assisted total knee arthroplasty (TKA) were included. The pre­ and postoperative whole leg radiographs (WLRs) in WB and supine positions were compared with the initial and final navigation values.

Results: The mean mechanical axis angle from the preoperative WBWLR and navigation were not statistically different (p=0.079) and were correlated strongly with each other (intraclass correlation [ICC], 0.818). However, on postoperative measurements, although the WBWLR and navigation values were not different (p=0.098), they were not correlated with each other (ICC, 0.093). The standard error of measurement was 1.8°±3.6° for the preoperative WBWLR and 2.5°±4.8° for the postoperative WBWLR. The validity that was determined by the Bland­Altman plot was not acceptable for both pre­ and postoperative measurements.

Conclusions: The preoperative WBWLR could provide accurate but not precise measurement value of the femorotibial mechanical axis angle for navigation­assisted TKA, and postoperative measurements in navigation were not comparable with radiographic measurements. The lack of agreement was found between the radiographic and navigation measurements of the coronal alignment regardless of pre­ or postoperative evaluation although the accuracy was found acceptable.

Level of Evidence : Level 4

Keywords: Knee, Arthroplasty, Computer assisted surgery, Radiograph, Reliability, Validity pISSN 2234-0726 · eISSN 2234-2451

Knee Surgery & Related Research

Received May 2, 2018; Revised June 27, 2018;

Accepted August 9, 2018

Correspondence to: Han­Jun Lee, MD, PhD

Department of Orthopedic Surgery, Chung­Ang University College of Medicine, 84 Heukseok­ro, Dongjak­gu, Seoul 06974, Korea

Tel: +82­2­2072­2368, Fax: +82­2­764­2718 E­mail: [email protected]

326

This is an Open Access article distributed under the terms of the Creative Commons Attribution Non­Commercial License (http://creativecommons.org/licenses/by­nc/4.0/) which permits unrestricted non­commercial use, distribution, and reproduction in any medium, provided the original work is properly cited.

Copyright © 2018 KOREAN KNEE SOCIETY www.jksrr.org

(2)

precise implantation based on anatomical landmarks and kine­

matic analysis, which improves the precision and consistency of component alignment. The use of an intraoperative navigation system, which has a technical accuracy to within 1°

9­12)

, allows for objective assessment of the accuracy and reproducibility of radiographic measurements of the TKA components and align­

ment. However, regardless of the use of navigation, all TKAs in previous studies were performed with the patient in the supine position intraoperatively, whereas evaluation of radiographs of the mechanical axis was usually performed in the WB position.

Moreover, in a recent study by Dahabreh et al.

13)

, there was lack of agreement of the alignment between navigation and radiological evaluation. A navigation system is expected to provide accurate measurements of the limb alignment; therefore, more research on the relationship between the navigation and plain radiographic measurements in WB or supine position is needed to clarify the advantages of navigation in measuring the TKA alignment.

The purpose of this study was to evaluate the reliability and va­

lidity of the femorotibial mechanical axis angle from radiographs in the WB and supine positions compared to the navigation­

measured femorotibial mechanical axis angle. We hypothesized that WB would affect the femorotibial mechanical axis angle in the preoperative whole leg radiographs (WLRs) and that the femorotibial mechanical axis angle in the supine position would correspond with the navigation­measured angle.

Materials and Methods

1. Patients and Methods

This is a retrospective study on 110 TKAs performed from 2010 to 2011 whose data were collected prospectively. The study was approved by the Institutional Review Board (ID: C2014131 [1327]) and conducted in accordance with the Declaration of Helsinki. WLRs were obtained in the supine and WB positions pre­ and postoperatively. To prevent femoral rotation, the ankle was held by an examiner to maintain the patella in a forward po­

sition in the supine radiograph and confirmed by the radiograph to ensure the desired position. Navigation­assisted TKAs were performed using a standard medial parapatellar approach and the OrthoPilot (Aesculap, Tuttlingen, Germany) navigation system.

The inclusion criteria were varus osteoarthritis patients who un­

derwent TKA using the navigation system. The exclusion criteria were rheumatoid arthritis, severe deformity over 20° of varus, fixed flexion contracture of more than 30°, valgus knees, revi­

sion surgery, inappropriate radiographs, bilateral cases, and body mass index over 30 kg/cm

2

because these criteria could influence

the initial setting of the navigation system. After applying the ex­

clusion criteria, 68 TKA patients (11 males and 57 females) were included with a mean age of 68.9 years (range, 64 to 77 years).

After establishing the tracker pin for navigation, the femoro­

tibial mechanical axis angle was measured and recorded by the navigation system as an initial navigation value. Then, medial release was performed to correct the varus deformity, and the posterior cruciate ligament was sacrificed in all patients. An ac­

ceptable coronal alignment was determined as within 0° to 2° of varus/valgus in the navigation­measured angle after release

14)

. The femoral component rotational angle was defined as the angle of the anteroposterior axis relative to the posterior condylar

axis

15,16)

. Then, the femoral cut was made with a femoral cutting

block and the tibial cut was made perpendicular to the tibial me­

chanical axis. After the bone cutting was completed, femoral and tibial trials were inserted, and the varus/valgus angles were re­

verified with real­time navigation feedback to evaluate collateral ligament balancing. Subsequently, the prostheses were implanted with cement. The measured values were recorded as postopera­

tive navigation values obtained with the knee in neutral position without any stress.

All radiographic measurements were performed on a PACS (General Electric, Chicago, IL, USA) monitor using a mouse­

point cursor and an automated computer calculation. Radiologi­

cal evaluation was based on the pre­ and postoperative supine­

positioned WLRs (SPWLRs) and WBWLRs (Fig. 1). During surgery, we compared the femorotibial mechanical axis angle of the SPWLR and WBWLR with the navigation­measured femo­

rotibial mechanical axis angle (Fig. 2). After the final component implantation, the navigation­measured femorotibial mechani­

cal axis angle was recorded. At six months after surgery, we compared the angles from the SPWLR and WBWLR with those obtained by navigation. Pre­ and postoperative clinical scores, Knee Society Score and Hospital for Special Surgery score were obtained from all patients.

2. Statistical Analysis

Statistical analysis was conducted using SPSS ver. 19.0 (IBM

Corp., Armonk, NY, USA) and G*power ver. 3.1.5. The primary

outcome measure was the difference of three mean values in

the preoperative femorotibial mechanical axis angle–the supine,

the WB and navigation values. The post hoc power analysis was

calculated based on the preoperative mean values and standard

deviations for each measurement method. The eta­ squared value

for three methods was 0.0489, and the effect size was calculated

as 0.2267469 using this eta­squared value with an α error set at 5%.

(3)

Based on these calculations, the post hoc power was calculated as 0.9649628 with a β error over 80%. The secondary outcome mea­

sure was the intraclass correlations (ICCs) for reliability

17)

. With a two­sided α error of 5% and β error of 20%, sample size calcu­

lation was performed. The acceptable ICC value for reliability between radiography and navigation was set as 0.9, and the ex­

pected ICC value was set as 0.95 to evaluate the ICC values con­

servatively. Based on these calculations, the required sample size was 49 for each method; therefore, appropriate power of study was achieved. Two orthopedic surgeons independently measured

the pre­ and postoperative radiographs with an interval of two weeks between measurements. Test­retest for intra­observer reliability was performed for each surgeon’s measurements two weeks after the first measurement. The inter­ and intra­observer reliability was calculated with the ICC for consistency.

For comparison of mean values, the data were assessed for normality with the Shapiro­Wilk test. One­way analysis of vari­

ance (ANOVA) test with post hoc analysis using Tukey’s honestly significant difference test was used to determine the mean dif­

ferences in the femorotibial mechanical axis angle between the

A B C D

Fig. 1. Preoperative whole leg radiographs (WLRs) in the supine position (A) and weight bearing position (B). Postoperative WLRs in the supine po­

sition (C) and weight bearing position (D).

10

1 0

Varus 0

Flexion

Mechanical axis A Mechanical axis B

Fig. 2. Navigation values of the mechanical axis during operation (A) and after pros­

thesis implantation (B).

(4)

supine radiographs, WB radiographs, and navigation values. The correlations between the femorotibial mechanical axis angles in radiographs (supine and WB) and navigation were analysed

using Pearson correlation coefficient (PCC). The strength of cor­

relation was indicated by the correlation coefficient (r) as strong (>0.75), moderate (0.40–0.75), or weak (<0.40). Reliability and validity between the navigation and radiographic values were established using ICCs (two way random effect model, absolute agreement), the standard error of measurement (SEM), and 95%

confident interval (CI; 95% CI of SEM, 1.96×SEM) using the PCC value

18)

. Additionally, Bland­Altman plots and its 95% limits of agreement (LOA) were used to assess the relationship between the differences and the magnitude between the navigation and radiographic values

19)

. The mean difference in Bland­Altman plot was calculated to evaluate the bias of paired measurements, and the 95% LOA was calculated to evaluate the degree of agree­

ment of paired measurements. The Shapiro­Wilks test was used to confirm that the measured data followed a normal distribution at 0.05 level of significance, and ICC of 0.70 was selected as the minimally acceptable value for reliability. A chi­square test was used to determine the differences in rates of angles over outliers in postoperative values. Statistical significance was set at p≤0.05.

Results

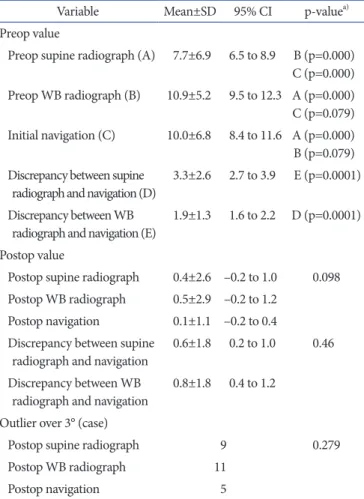
1. Differences in Preoperative Radiological Measurements The preoperative SPWLR and navigation values were statisti­

cally different (p<0.001), but the preoperative WBWLR and navigation values were not statistically different in the one­way ANOVA test with post hoc analysis (p=0.079) (Table 1). The pre­

operative SPWLR and navigation measurements for the femo­

rotibial mechanical axis angle were correlated (ICC, 0.743), and the preoperative WBWLR and navigation measurements were more strongly correlated (ICC, 0.818) (Table 2). There was less discrepancy between measurements from the navigation system and those from the preoperative WBWLR than those from the Table 1. Analysis of Radiographic and Navigation Measurements of the

Lower Limb Alignment

Variable Mean±SD 95% CI p­value

a)

Preop value

Preop supine radiograph (A) 7.7±6.9 6.5 to 8.9 B (p=0.000) C (p=0.000) Preop WB radiograph (B) 10.9±5.2 9.5 to 12.3 A (p=0.000) C (p=0.079) Initial navigation (C) 10.0±6.8 8.4 to 11.6 A (p=0.000) B (p=0.079) Discrepancy between supine

radiograph and navigation (D) 3.3±2.6 2.7 to 3.9 E (p=0.0001) Discrepancy between WB

radiograph and navigation (E) 1.9±1.3 1.6 to 2.2 D (p=0.0001) Postop value

Postop supine radiograph 0.4±2.6 –0.2 to 1.0 0.098 Postop WB radiograph 0.5±2.9 –0.2 to 1.2

Postop navigation 0.1±1.1 –0.2 to 0.4 Discrepancy between supine

radiograph and navigation 0.6±1.8 0.2 to 1.0 0.46 Discrepancy between WB

radiograph and navigation 0.8±1.8 0.4 to 1.2 Outlier over 3° (case)

Postop supine radiograph 9 0.279

Postop WB radiograph 11

Postop navigation 5

SD: standard deviation, CI: confidence interval, Preop: preoperative, WB: weight bearing, Postop: postoperative.

a)

p<0.05 was shown between pre­ and postoperative values.

Table 2. Analysis of the Radiograph­to­Navigation Correlation for Lower Limb Alignment Measurement

Variable Mean±SD (°)

Femorotibial mechanical axis on radiograph: navigation One­way ANOVA

(p­value) PCC (p­value) ICC (95% CI)

Initial navigation value 10.0±6.8 ­

Preop supine radiograph 7.7±6.9 0.000 0.852 (0.000) 0.743 (0.513–0.845)

Preop WB radiograph 10.9±5.2 0.079 0.876 (0.000) 0.818 (0.712–0.898)

Postop navigation value 0.1±1.1

Postop supine radiograph 0.4±2.6 0.098 0.251 (0.04) 0.093 (0.034–0.135)

Postop WB radiograph 0.5±2.9 0.283 (0.02) 0.182 (0.054–0.246)

SD: standard deviation, ANOVA: analysis of variance, PCC: Pearson correlation coefficient, ICC: intraclass correlation coefficient, CI: confidence

interval, Preop: preoperative, WB: weight bearing, Postop: postoperative.

(5)

preoperative SPWLR. The magnitude of discrepancy between the preoperative radiographs and the navigation system was signifi­

cantly different between the SPWER and the WBWER (p<0.001) (Table 1).

Reliability and validity, which was determined by the 95% LOA and SEM, to detect true differences among the navigation and ra­

diographic values are summarized in Table 3. The SEM and 95%

CI of SEM were found ranging from 2.6° to 12.8° for the SPWER and 7.3° to 14.5° for the WBWER (Table 3). The Bland­Altman plots revealed upper and lower LOA (95% LOA) ranging from –4.7° to 9.3° for the SPWER and –7.6° to 5.7° for the WBWER (Fig. 3A and B).

2. Differences in Postoperative Radiological Measurements The mean flexion contracture angle was measured as 2.7°±1.2°

with a goniometer at 1 month after surgery, which means pa­

tients achieved nearly full extension. There were no statistical dif­

ferences in the postoperative SPWLR, WBWLR, and navigation values in one­way ANOVA test (p=0.098). Moreover, the naviga­

tion values were poorly correlated with the SPWLR (ICC, 0.093) and WBWLR (ICC, 0.182) (Table 2). However, the discrepancy between the measurements from the postoperative radiographs and the navigation system did not differ between the SPWLR and WBWLR (p=0.46) (Table 1).

Reliability and validity, which was determined by the 95% LOA and SEM, to detect true differences among the navigation and ra­

diographic values are summarized in Table 3. The SEM and 95%

CI of SEM were found ranging from –4.1° to 4.9° for the SPWLR and –4.3° to 5.3° for the WBWLR (Table 3). The Bland­Altman plots revealed upper and lower LOA (95% LOA) ranging from –4.6° to 5.7° for the SPWLR and –5.9° to 5.1° for the WBWLR (Fig. 4).

A chi­square test did not reveal any differences in the number of outliers over 3° for coronal plane alignment among the three measurement methods (p>0.05) (Table 1). The measured intra­

and inter­observer correlation using ICC ranged from 0.893 to 0.978 for all measurements, indicating good to excellent reliabil­

ity.

Discussion

The most important finding of this study is that the preopera­

tive femorotibial mechanical axis angle in the WB radiograph correlated more closely with the navigation value than with that in the supine radiograph; thus, we rejected our first hypothesis Table 3. Standard Error of Measurement (SEM), 95% confidence interval

(CI) for SEM for Precision, and 95% Limits of Agreement (LOA)

Variable Mean±SD

Overall radiograph:

navigation value SEM 95% CI for SEM 95%

LOA Preop supine radiograph (°) 7.7±6.9 2.6 2.6 to 12.8 –4.7 to 9.3 Preop WB radiograph (°) 10.9±5.2 1.8 7.3 to 14.5 –7.6 to 5.7 Postop supine radiograph (°) 0.4±2.6 2.3 –4.1 to 4.9 –4.6 to 5.7 Postop WB radiograph (°) 0.5±2.9 2.5 –4.3 to 5.3 –5.9 to 5.1 SD: standard deviation, Preop: preoperative, WB: weight bearing, Postop: postoperative.

5 15

10

5

0

5

10

Prenavigation-Supine

Mean

30 25 20 15 10 5 0

9.3

Mean 2.3

1.96 SD 4.7

10 8 6 4 2 0 2 4 6 8 10

Prenavigation-Standin g

Mean

40 30

20 10

0

1.96 SD 7.6 Mean 1.0 +1.96 SD 5.7

A B

+1.96 SD

Fig. 3. Bland­Altman plots for agreement of navigation and preoperative measurements. (A) Plot for preoperative supine radiographic and navigation values. (B) Plot for preoperative standing radiographic and navigation values. The Bland­Altman plot showed less discrepancy between weight bear­

ing whole leg radiographs (WLRs) and navigation values, but the range of 95% limits of agreement was not acceptable for both the supine­positioned

WLRs and weight bearing WLRs. SD: standard deviation.

(6)

that the navigation value could be more correlated with the su­

pine angle. There was no correlation between the postoperative alignment measured by navigation and radiographic evaluations although postoperative mean values and outliers were not statis­

tically different between the two methods. Moreover, the validity between the radiographic evaluations and the navigation values were found very low in both preoperative and postoperative evaluations.

Precise perioperative measurements of limb alignment are nec­

essary to plan, perform, and evaluate TKA. Under ideal circum­

stances, standard radiographs are accurate in normal patients with minimal deformity

20)

. However, these conditions are difficult to meet in practice and do not apply to patients with extremity­

deforming osteoarthritis. Moreover, deformity can give rise to soft tissue imbalance that can cause changes in the overall align­

ment under WB.

Most previous studies on TKA have not examined whether WB or non­WB radiographic measurements more strongly correlated with navigation values. The femorotibial mechanical axis angle in navigation is generally recorded in the supine position. Thus, we hypothesized that the navigation values would more likely corre­

late with the preoperative non­WB radiographic measurements.

However, the preoperative WB radiographic measurements more closely correlated with the navigation values. When recording the navigation values, we adjusted the patient’s limb manually to detect the probes. During this manipulation, application of axial forces was unavoidable. This lower extremity position may have an influence on deforming force of the knee. Moreover, arthrot­

omy to locate the navigation probe and to expose the anatomic

references was performed before recording the femorotibial mechanical axis angle in navigation, so the true supine condition of preoperative evaluation could not be achieved after soft tis­

sue release. Nevertheless, the femorotibial mechanical axis angle in the WB radiographs strongly correlated with the navigation values preoperatively. Previous studies reported that a trend of greater discrepancy was found between radiography and naviga­

tion in patients with larger lower limb deformities

11,21)

. Because we excluded severe deformities and severe fixed flexion contracture patients, the correlations between navigation and radiological measurement showed good ICC values (Table 2) regardless of WB or non­WB position, although statistical difference was found be­

tween navigation and supine values (p=0.000)

9­12,22)

. Among them, the correlation between the preoperative radiographic measure­

ments and navigation values was found to be 0.885 by Yaffe et al.

11)

. This is consistent with the strong correlations we found for the preoperative radiographic and navigation measurements of the femorotibial mechanical axis angle in the present study.

Another important finding of this study is that there was no correlation between the navigation and radiographic measure­

ments of the postoperative femorotibial mechanical axis angle.

The ICC values for correlation in postoperative measurements were very low (Table 2) regardless of WB. However, the changes of less than 1° in radiographic measurement would exist in the range of precision limits of the navigation measurements

9,10,12)

; the evidence to confirm whether the postoperative correlation analy­

sis is significant or not would be insufficient due to the measured values are all in the measurement error range. Moreover, since the ligamentous imbalance and the deformity were corrected

6 12 10 8 6 4 2 0 2 4 6

Postnavigation-Supine

Mean

4 2

0 2

4 4

12 10 8 6 4 2 0 2 4 6 8

Postnavigation-Standing

Mean

6 4

2 0

+1.96 SD

A B

2 5.7

Mean 0.5

1.96 SD 4.6

5.1 +1.96 SD

Mean 0.4

1.96 SD 5.9

Fig. 4. Bland­Altman plots for agreement between navigation and postoperative measurements. (A) Plot for postoperative supine radiographic values and navigation values. (B) Plot for postoperative standing radiographic values and navigation values. The Bland­Altman plot showed similar discrep­

ancy between the supine/standing radiographic values and navigation values, and the range of 95% limits of agreement was not acceptable. Moreover,

the radiographic values and navigation values showed the proportional error of measurements. SD: standard deviation.

(7)

after surgery, the effect of WB on alignment would be limited postoperatively. Despite this, the postoperative mean values and outliers were not significantly different between different mea­

surement methods. In brief, if the postoperative navigation values were within the outlier range, then the postoperative femorotibial mechanical axis angle would also be considered within the out­

lier range. This finding is consistent with the results reported by Yaffe et al.

11)

, Willcox et al.

21)

, and Choi et al.

23)

but not with those of Hauschild et al.

22)

. Hauschild et al.

22)

suggested that the radio­

graphic and navigation measurements for TKA would correlate well in both the pre­ and postoperative period when the radio­

graphs are delayed. Our results showed worse correlation in post­

operative values despite delayed measurement. Thus, controversy still exists about whether postoperative navigation measurements correlate with radiographic values.

Navigation­assisted TKA is known as a highly reliable system with a mean error of less than 1°

9)

. However, in this study, the lack of agreement between the navigation value and radiographic values was found. This low reliability was also found in the study of Dahabreh et al.

13)

: 20% of mismatch in coronal alignment was found between the navigation values and radiographic values by CT. According to the Bland­Altman plot for the results of Da­

habreh et al.

13)

, the LOA was found to range from –5.4° to 4.7°, similar to our result of postoperative standing value. Although the mean differences in Bland­Altman plot were –0.4° in our study and –0.32° in Dahabreh’s results

13)

, the ranges of LOA were not acceptable in both studies. However, the values of coronal alignment in navigation and radiography were not statistically different, the frequency of outliers was also not different, and the repeatability or reproducibility of the navigation measurement was shown acceptable.

An appreciation of the limitations and potential sources of error inherent to each of the discussed measurement modalities is war­

ranted. First, human error during the process of alignment evalu­

ation or operation is a potential source of measurement variabil­

ity. For the radiographic measurement, the position of the knee joint could affect the alignment. Second, there were fundamental errors in detecting the navigation probe, such that the true supine femorotibial mechanical axis angle was hard to obtain, especially in patients with deformity. Nevertheless, severe deformities were excluded from this study; further study would be needed in pa­

tients with severe deformities to confirm the correlation. Third, the relatively large number of female patients could have affected the measurements. However, due to the exclusion criteria of this study, the study population consisted of patients commonly en­

countered in clinics, and thus we thought the results are worth

to be analysed and reported. Finally, the potential for measure­

ment errors exists because the decimals in radiographic values and navigation values were different. The navigation values were recorded with no decimal point, but the radiographic values were recorded with two decimal values which were rounded to one decimal place for analysis; further studies that address these dif­

ferences are needed. In spite of these limitations, our study is one of the few comprehensive studies to compare WB and supine ra­

diographs and navigation and it provides a guide to surgeons on the limitations of the navigation system for TKA.

Conclusions

The preoperative WBWLR could provide accurate but not precise measurement of the femorotibial mechanical angle for navigation­assisted TKA, and the postoperative measurement with navigation could not be comparable with the radiographic measurements. The lack of agreement was found between the radiographic and navigation measurements in coronal alignment regardless of pre­ and postoperative evaluation, although the ac­

curacy was found acceptable.

Conflict of Interest

No potential conflict of interest relevant to this article was re­

ported.

References

1. Figgie HE 3rd, Goldberg VM, Figgie MP, Inglis AE, Kelly M, Sobel M. The effect of alignment of the implant on fractures of the patella after condylar total knee arthroplasty. J Bone Joint Surg Am. 1989;71:1031­9.

2. Laskin RS. The classic: total condylar knee replacement in patients who have rheumatoid arthritis: a ten­year follow­up study: 1990. Clin Orthop Relat Res. 2008;466:2589­96.

3. Weng YJ, Hsu RW, Hsu WH. Comparison of computer­

assisted navigation and conventional instrumentation for bilateral total knee arthroplasty. J Arthroplasty. 2009;24:668­

73.

4. Stiehl JB, Komistek RD, Dennis DA, Paxson RD, Hoff WA.

Fluoroscopic analysis of kinematics after posterior­cruciate­

retaining knee arthroplasty. J Bone Joint Surg Br. 1995;77:

884­9.

5. Dennis DA, Komistek RD, Mahfouz MR. In vivo fluoro­

scopic analysis of fixed­bearing total knee replacements.

(8)

Clin Orthop Relat Res. 2003;(410):114­30.

6. Suggs JF, Hanson GR, Park SE, Moynihan AL, Li G. Patient function after a posterior stabilizing total knee arthroplasty:

cam­post engagement and knee kinematics. Knee Surg Sports Traumatol Arthrosc. 2008;16:290­6.

7. Moschella D, Blasi A, Leardini A, Ensini A, Catani F. Wear patterns on tibial plateau from varus osteoarthritic knees.

Clin Biomech (Bristol, Avon). 2006;21:152­8.

8. Ho FY, Ma HM, Liau JJ, Yeh CR, Huang CH. Mobile­bearing knees reduce rotational asymmetric wear. Clin Orthop Relat Res. 2007;462:143­9.

9. Pitto RP, Graydon AJ, Bradley L, Malak SF, Walker CG, An­

derson IA. Accuracy of a computer­assisted navigation sys­

tem for total knee replacement. J Bone Joint Surg Br. 2006;

88:601­5.

10. Rauh MA, Boyle J, Mihalko WM, Phillips MJ, Bayers­Ther­

ing M, Krackow KA. Reliability of measuring long­standing lower extremity radiographs. Orthopedics. 2007;30:299­303.

11. Yaffe MA, Koo SS, Stulberg SD. Radiographic and naviga­

tion measurements of TKA limb alignment do not correlate.

Clin Orthop Relat Res. 2008;466:2736­44.

12. Lutzner J, Gross AF, Gunther KP, Kirschner S. Reliability of limb alignment measurement for high tibial osteotomy with a navigation system. Eur J Med Res. 2009;14:447­50.

13. Dahabreh Z, Scholes CJ, Giuffre B, Coolican MR, Parker DA. Lack of agreement between computer navigation and post­operative 2­dimensional computed tomography (CT) measurements for component and limb alignment in total knee arthroplasty (TKA). Knee. 2016;23:137­43.

14. Kim SH, Lim JW, Ko YB, Song MG, Lee HJ. Comparison of ultra­congruent mobile­ and fixed­bearing navigation­as­

sisted total knee arthroplasty with minimum 5­year follow­

up. Knee Surg Sports Traumatol Arthrosc. 2016;24:3466­

3473.

15. Matsuda S, Miura H, Nagamine R, Mawatari T, Tokunaga M, Nabeyama R, Iwamoto Y. Anatomical analysis of the femoral condyle in normal and osteoarthritic knees. J Orthop Res.

2004;22:104­9.

16. Lustig S, Lavoie F, Selmi TA, Servien E, Neyret P. Relation­

ship between the surgical epicondylar axis and the articular surface of the distal femur: an anatomic study. Knee Surg Sports Traumatol Arthrosc. 2008;16:674­82.

17. Walter SD, Eliasziw M, Donner A. Sample size and optimal designs for reliability studies. Stat Med. 1998;17:101­10.

18. Harvill LM. Standard error of measurement. Educ Meas­

Issues Pract. 1991;10:33­41.

19. Bland JM, Altman DG. Statistical methods for assessing agreement between two methods of clinical measurement.

Lancet. 1986;1:307­10.

20. Cooke TD, Scudamore RA, Bryant JT, Sorbie C, Siu D, Fish­

er B. A quantitative approach to radiography of the lower limb: principles and applications. J Bone Joint Surg Br. 1991;

73:715­20.

21. Willcox NM, Clarke JV, Smith BR, Deakin AH, Deep K. A comparison of radiological and computer navigation mea­

surements of lower limb coronal alignment before and after total knee replacement. J Bone Joint Surg Br. 2012;94:1234­

40.

22. Hauschild O, Konstantinidis L, Baumann T, Niemeyer P, Suedkamp NP, Helwig P. Correlation of radiographic and navigated measurements of TKA limb alignment: a matter of time? Knee Surg Sports Traumatol Arthrosc. 2010;18:1317­

22.

23. Choi WC, Lee S, An JH, Kim D, Seong SC, Lee MC. Plain radiograph fails to reflect the alignment and advantages of navigation in total knee arthroplasty. J Arthroplasty. 2011;

26:756­64.

수치

Fig. 1. Preoperative whole leg radiographs (WLRs) in the supine position (A) and weight bearing position (B)
Table 2. Analysis of the Radiograph­to­Navigation Correlation for Lower Limb Alignment Measurement
Fig. 3. Bland­Altman plots for agreement of navigation and preoperative measurements. (A) Plot for preoperative supine radiographic and navigation  values
Fig. 4. Bland­Altman plots for agreement between navigation and postoperative measurements

참조

관련 문서

Intraoperative photograph shows grossly total removal of tumor using the navigation system

But, the adjusted - R 2 of book values and earnings produced through deferred tax accounting has no change, compared with that of book values and earnings

In this thesis, this method choosing the node having reliable RSSI values based on the reliability of the signal is proposed for the... more accurate

High complication rate in locking plate fixation of lower periprosthetic distal femur fractures in patients with total knee arthroplasties.. Management and

7.3.3 Pilot Signals and Spreading Codes..

Mortality and clinical signs in SD rats about single oral administration after 3 weeks with callus extract ..... Hematological values in SD rats administered orally

To get continuous navigation information at low cost, this work demonstrates a position system which is constructed by integrating GPS and 3-axis

The measured values for benzene in DMF were compared with the The measured values for benzene in DMF were compared with the reference data, and