167
Feature Extraction of Disease Region in Stomach Images Based on DCT
Byeoungju Ahn, SangBock Lee Dept. of Radiology, Nambu University
DCT기반 위장영상 질환부위의 특징추출
안병주, 이상복 남부대학교 방사선학과
Abstract
In this paper, we present an algorithm to extract features about disease region in digital stomach images.
For feature extraction, DCT coefficients of gastrointestinal imaging matrix was obtained. DCT coefficent matrix is concentrated energy in low frequency region, we were extracted 128 feature parameters in low frequency region. Extracted feature parameters can using for differential compression of PACS and, can using for input parameter in CAD.
Key Words : Digital Stomach Image, Image plate, Feature Extraction, DCT
요약
본 논문에서는 의용영상의 병소부위 특징을 추출하는 알고리즘을 제시하였다. 특징 추출을 위해 위장영상을 입력하 여 DCT계수 행렬을 구하였다. DCT계수 행렬은 저주파 영역으로 에너지가 집중되기 때문에 저주파 영역에서 128개의 특징 파라미터를 추출하였다. 추출된 특징 파라미터를 이용하여 질환영상과 정상영상을 비교하여 그래프로 나타내었 다. 특징 파라미터는 PACS의 차등압축과 CAD를 위한 입력 파라미터로 활용될 수 있을 것이다.
중심단어: 디지털위장영상, 이미지 플레이트, 특징추출, DCT
I. Introduction
Now, a study about image and multimedia information system is actively progressed. Using these results of a study, many researchers are studying for applying to the medical fields. Many researcher is concerning about PACS which is able to process mass digital medical image data[1]. Especially, success of modern hospitals depends on excellent development and management of PACS. IF
PACS is popularized and ultrahigh speed communication line is equipped, all patients can be supported to excellent doctors using the PACS and ultrahigh speed communication line. And it is able to improve the level of medical diagnosis. If doctor use sample DB(Database) medical image, discrimination about medical image is automatically made possible. So in this paper we present an algorithm to extract features about disease region in digital stomach image. The results of study will be applied
to PACS with automatic discrimination system about medical image.
II. Acquisition of Medical Image
An image plate is used for the generation of digital medical image. An image plate consists of the complex of bariumfuloroharide including uropum in the rare-earth element, over coating protect layer on surface[2][3].
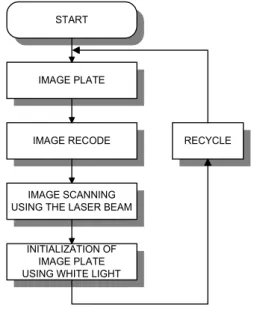
Fig. 1 shows the flowchart of medical image generation on image plate. First, digital medical image is obtained on image plate. Second, medical image on image plate is recoded to memory by scanning an image plate with laser beam. Image plate is initialized by beaming an white light for recycling. A resolution is decided by diameter of laser spot.
RECYCLE IMAGE PLATE
IMAGE RECODE
IMAGE SCANNING USING THE LASER BEAM
INITIALIZATION OF IMAGE PLATE USING WHITE LIGHT
START
Fig. 1. The flowchart of medical image generation on image plate
A resolution of image plate is about 10 times than the method using a film. The acquired medical images are easy transmitted through LAN, WAN, and Internet.
III. Extracting the Feature Parameters using DCT
DCT Process about medical image
Start
Divide DCT coefficients into 64 blocks
Divide DCT coefficients into 64 blocks
Extract freauency, angle and movement features
from block(0,0)
Extract accumulation features
from 64 blocks
End
Fig. 2. The flowchart for extracting features
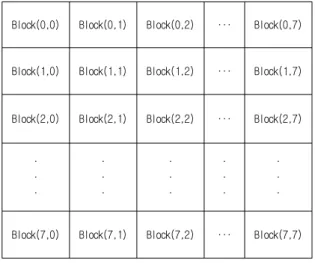
The many kinds of feature parameters from DCT coefficients obtained after DCT with input medical image are extracted in low frequency domain because the energy is concentrated at low frequency domain[4][5][6][7]. We divide the DCT coefficients into 8 × 8 block after performing DCT. One block consists fo 3 2 × 3 2 pixels.
Fig. 2 shows the flowchart for extracting many kinds of feature parameters about disease regions from DCT coefficients after performing DCT.
The detail steps for extracting feature parameters from coefficient after DCT show as follows.
Step 1 : Extracting DCT coefficients obtained from medical image.
Step 2 : Dividing DCT coefficients into 64 blocks
Step 3 : The frequency feature parameters 32 are extracted in block(0,0)
Step 4 : The angle feature parameters 16 are extracted in block(0,0)
Step 5 : The translation feature parameters 16 are extracted in block(0,0).
Step 6 : The amplitude feature parameters 64 of each blocks are extracted in all blocks
Therefore 128 feature parameters is extracted.
The table 1, table 2 and table 3 show the methods of feature extracting in block(0.0)
The table 4 shows the positions of blocks for extraction amplitude feature parameters.
Begin
Define I=0, j=0, k[64]
Start loop I Start loop J If (I+J) < 32
then k[I+J]=abs(Acc_arry[I][J]) End
Table 1. Algorithm for extracting frequency feature parameters
Define I, J, Theta Theta=atan(I/J)
K[Theta/5+32]+=abs(Acc_ary[I][J])
Table 2. Algorithm for extracting angle feature parameters
Define I, J, Move I+, J+
K[Move]+=abs(Acc_ary[I][J])+abs(Acc_ary[J][I])
Table 3. Algorithm for extracting translation feature parameters
Block(0,0) Block(0,1) Block(0,2) ∙∙∙ Block(0,7)
Block(1,0) Block(1,1) Block(1,2) ∙∙∙ Block(1,7)
Block(2,0) Block(2,1) Block(2,2) ∙∙∙ Block(2,7)
∙
∙
∙
∙
∙
∙
∙
∙
∙
∙
∙
∙
∙
∙
∙
Block(7,0) Block(7,1) Block(7,2) ∙∙∙ Block(7,7) Table 4. Extracting amplitude feature parameters in blocks
IV. Experiment and Result
The experimental environment is as follows.
First, we extracted the feature parameters from DCT coefficients of normal image. Second, we extracted the feature parameters form DCT coefficient of image including disease region. Then, we extracted the difference from DCT coefficients of two medical images. The differences of two input image are that the gastric mucous membrane is concentrated in disease region, disease region is projected above, and gastric outline is depressed. Thus The feature parameters of frequency, angle, translation, and amplitude feature extracted from DCT coefficients were changed at disease region.
(a) Barium relief(normal) (b) Double contrast(normal)
(c) Full filling(normal) (d) Barium relief(ulcer)
(e) Double contrast(ulcer) (f) Full filling(Cancer) Fig. 3 Experiment images
We were compared disease image and normal image using extracted feature parameter. And, we were shown of result as following figures.
Fig. 4 Barium relief
Figure 4 shows the results of barium relief a comparison of images.
Fig. 5 Double contrast
Figure 5 shows the results of double contrast a comparison of images.
Fig. 6 Full filling
Figure 6 shows the results of full filling a comparison of images.
V. Conclusion and Discussion
In this paper we proposed the algorithm about feature
1. For feature parameters, we used the images of two types. One type is normal medical image. Another type is medical image including the disease region. We extracted the DCT coefficients from each input images.
2. The total parameters are 128. In block(0,0), we extracted 32 frequency feature parameters, 16 angle feature parameters, 16 translation feature parameters and 64 amplitude feature parameters.
3. We obtained the difference between normal input medical image and input medical image including the disease region.
4. Comparing the extracted features was able to get meaningful results.
The results of this paper will be able to using differential compression in PACS and, using of input parameters of CAD[8][9].
Reference
[1] Guy Parea, Marie-Claude Trudelb, “Knowledge barriers to PACS adoption and implementation in hospitals”, International Journal of Medical Informatics, Volume 76, Issue 1, pp.22–33, 2007.
[2] DDS Eva Borga, , MSc, PhD Atta Attaelmanana, DDS, PhD Hans-Göran Gröndahla, “Imageplate systems differ in physical performance”, Oral Surgery, Oral Medicine, Oral Pathology, Oral Radiology, and Endodontology, Volume 89, Issue 1, pp.118–124, January 2000,
[3] F. Né, D. Gazeau, J. Lambard, P. Lesieur, T. Zemb and A.
Gabriel, “Characterization of an image-plate detector used for quantitative small-angle-scattering studies”, J. Appl. Cryst. Vol.
26, pp.763-773, 1993
[4] H. Kauppinen, T. Seppanen, M. Pietikaien, An experimental comparison of Autoregressive and Fouier-Based Descriptors in 2D shape Classification, IEEE Transaction on PAMI Vol. 17, No. 2, pp.201-207, February. 1995.
[5] O. Ratib, M.D.,Ph.D., From PACS to the World Web, Medical Imageing Unit Center of Medical Informatics Geneva University Hospital
[6] B. M. Mehtre, M. S. Kanhalli and W. F. Lee, Shape Measurements for Content Based Image Retrieval : A Comparison, Technical Report 95-195-0, Institute of Systems Science, National University of Singapore.
[7] D. Mohamad. G. Sulong, A Trademark Identification System Using 2-d Fast Fourier Transform, The Fourth International Conference on Control, Automation, Robotics and Vision(ICARCV96), Singapore, 3-6 December, 1996
[8] K. S. Fu and A. Rosenfeld, pattern Recognition and Computer Vision., IEEE Computer, pp.274-282, October 1994.
[9] Steven K. Rogers, Dennis W. RuckMatthew Kabrisky Gregory L. Tarr, Artificial Networks for Pattern Recognition, Intelligent Robots and Computer Vision VII, pp.410-417, 1989.