Air Circulating Oven-drying Characteristics of Hollowed Round-post for Korean Main Conifer Species
1Part 3: Effects of Water-vapor Dam and Heartwood Coating Treatments
Nam-Ho Lee
2†⋅Xue-Feng Zhao
3⋅Ik-Hyun Shin
2⋅Chang-Jin Lee
2ABSTRACT
In this study the effect of heartwood-coating (HCO), vapor-dam (VD), bark-remaining (BR) and bark-remaining-coating (BRC) treatments on the air circulating oven-drying characteristics of Japanese larch hollowed round-post was evaluated. The drying times of the hollowed round-posts for control, VD, HCO and BR specimens were 72, 168, 204 and 240 hours, respectively, from the initial MC to about 8% MC, which was recommended as the indoor in-use MC.
The temperature in the hole of the VD specimen was lower than that of wood and the difference between air temper- ature in the hole and wood temperature became large during drying period. The vapor pressure of air in the hole was higher than that of inside wood for all specimens except VD specimen. The surface checks on all specimens were ob- served in increasing order of BR, BRC, UC, HCO and VD specimens.
Keywords : Hollowed round-post, Heartwood coating treatment, Vapor-dam treatment, BR treatment, BRC treatment, Drying rate, Checking
1. INTRODUCTION
1)The need of post, as the most necessary ma- terials for wooden buildings, is increasing.
However, it is very difficult to dry the posts without checks and crack in short time.
There were some works on drying of post and poles. Ruddick (1979) reported that a kerfing treatment can reduce the number of severe
checks. A low pressure steam explosion treat- ment (Lee, 2002) and a radio-frequency/vacuum drying (Fang, 2001) were applied for drying of pole and pillars for reduce the surface checks.
High temperature with low humidity drying were also used on drying of heart boxed timber (Yoshida, 2000). Evans (2000) reported that a center boring treatment could prevent checks from increasing in depth and width during air
1 This study was carried out with the support of National Research Foundation of Korea (KRF-2006-521-D00627) Received December 26, 2011; accepted December 18, 2013
2 College of Agriculture & Life Sciences (Institute of Agricultural Science & Technology), Chonbuk National University, Chonju 561-756, Korea
3 Department of Wood, College of Forestry, Beihua University, Jilin 132-013, China
† Corresponding author : Nam-Ho Lee (e-mail: [email protected])
500 30
Φ 27 0 Φ 21 0
Hole Wood
Side view Front view
Fig. 1. Schematic diagram of hollowed round-post (unit : mm).
Table 1. Dimension, evaporating surface area, heartwood percentage and initial moisture content of specimens for each treatment
Treatment D* (mm)
T**
(mm)
Evaporating surface area (cm2) Heartwood
percentage Initial MC
outer inner end sum (%) (%)
UC 270 30 4239 3297 452 7988 100 34.5
VD 270 30 4239 0 0 4239 100 36.5
HCO 270 30 4239 0 4239 100 353
BR 300 30 0 3768 509 4277 41.0 70.2
BRC 300 30 0 3768 0 3768 41.5 79.3
* : Diameter
** : Thickness
drying of Slash pine posts (125 or 150 mm in diameter) except for the number of checks. The maximum ratio (in percentage) between the in- ner surface and outer surface was 30% and 36%
for large and small posts, respectively. Accor- ding to Yeo (2007), a center boring treatment reduced the number and overall length and width of drying checks during kiln drying of larch timbers (150 or 180 mm in diameter).
The maximum ratio between the inner surface and outer surface was 42.9% and 60% for large and small posts, respectively.
Hollowed round-post, because whose center is drilled and but whose left solid body is rela- tively thin, can be dried simultaneously from both the inside and outside in a relatively short
time. Therefore, it is comparatively easy to pre- vent from checking and cracking during the post. This study focused on the effect of heart- wood-coating and vapor-dam treatments on air circulating oven-drying characteristics of Japa- nese larch hollowed round-posts.
2. MATERIALS AND METHODS
2.1. Preparation of Specimens
A 3600 mm-long Japanese larch logs with
about 300 mm in diameter at the top end were
obtained from a sawmill. Two 500 mm-long
bark remained (BR) and bark remained-coating
(BRC) specimens were cut from the log. The
VD treatment
HCO treatment
BR treatment
BRC treatment Fig. 2. Photograph of each specimen.
remainder of logs were processed into a round post with 270 mm in diameter. And three 500 mm-long control(C), heartwood-coated (HCO) and Vapor-dam (VD) specimens were obtained
from the round post. Two 20 mm-long log cross
sections (L) were cut from both ends of each
specimen to measure the percentage of heart-
wood and the initial MC. All specimens were
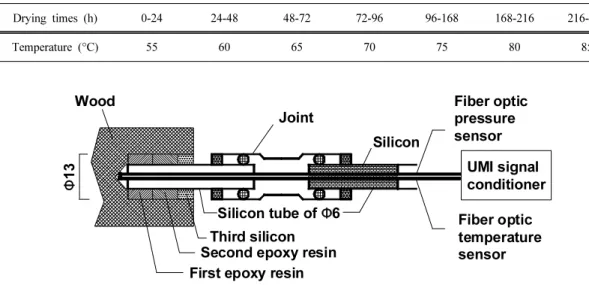
Fiber optic temperature sensor Wood
Second epoxy resin First epoxy resin
Third silicon Silicon tube of Φ6
Joint
Silicon
UMI signal conditioner
Φ13
Fiber optic pressure sensor
Fig. 3. Schematic diagram representing the fixation of fiber optic sensors into specimen (unit : mm).
Drying times (h) 0-24 24-48 48-72 72-96 96-168 168-216 216-240
Temperature (°C) 55 60 65 70 75 80 85
Table 2. Drying schedule
drilled a big hole at the center along axial di- rection leaving 30 mm thick of wood (Fig. 1).
Table1shows the percentage of heartwood and the initial MCs of the specimens.
2.2. Pretreatment
Fifteen folds of vinyl wrap were covered on both ends of the VD specimen and a rubber band, 2 mm in thickness and 15mm in width, was fastened around the circumferential surface of the specimens. The heartwood on the end surface and the inner surface of HCO specimen, and the end surface of BRC specimen were bru- shed twice with epoxy waterproof paint (Fig. 2).
2.3. An Air Circulating Oven-drying
An air circulating-oven, internal dimensions being 500 × 500 × 600 mm, was used in this experiment. The air circulating-oven could be controlled with an accuracy of ± 1°C and fixed
air velocities of 1.5m/s. The specimens were dried individually in each run. The drying sche- dule is shown in Table 2.
2.4. Measurement of Temperature and Vapor Pressure
2.4.1. Insertion of Sensors
A schematic diagram of the methodology for probing the temperatures and vapor pressure of the air inside wood and in the hole of the specimen is shown in Fig. 3. Firstly, a hole in diameter of 13 mm from the outer surface along the radial direction was drilled in the middle of the specimen, and epoxy resin was injected into the hole up to approximately one third of depth.
After the epoxy resin was cured sufficiently,
then a hole in diameter of 6 mm was made
through the center of the epoxy resin section. A
Teflon tube in diameter of 6 mm was then in-
serted into the hole, and the epoxy resin was
injected into the large hole again. After the ep-
250 250 Hole
Wood
T
i; Temperature P
i; Vapor pressure
500
P2,T2 P1,T1
Side view Front view Ф 210 Ф 270
Front view
Fig. 4. Schematic diagram of the Control specimen and the locations of the fiber optic sensors on the specimen (unit : mm).
oxy resin was cured satisfactorily, the entrance of the large hole was sealed. The positions of temperature and vapor pressure measurement are shown in Fig. 4.
2.4.2. Measurement of Temperature and Vapor Pressure
The scope of temperature sensor was in a range of -40 ∼250°C and that of vapor pressure sensor was 0.1% at the level scale ranging from 0 ∼ to 68 KPa. The temperature and vapor pressure of air inside the specimens were meas- ured every 5 minutes during drying test using an optical fiber signal measuring instrument (UMI, FISO Technology, Canada) with a reso- lution of 0.05°C and the vapor pressure sensor.
2.5. Drying Curves and Drying Times Each specimen was weighed every 8 hours until the 72 hours of drying time, and every 12 hours until the end of drying to determine the change in MC during the drying test. The dry- ing time excluded the dead time required for measuring.
2.6. Checks
The number and total length of checks which occurred on both the inner and outer surfaces of specimens were investigated at the same time as measuring the weight.
2.7. Shrinkage
A digital vernier caliper and π tape with an accuracy of 0.01 mm were used to measure the dimensions of thickness and circumference shrinkage of the specimens during drying.
3. RESULTS AND DISCUSSION
3.1. Radial Distribution of Initial MC
Figs. 5 and 6 show the radial distribution of the initial MCs of the Ls cut from both ends of specimens.
The MC near the bark was as low as 27.5 ∼ 31.3% and that of the pith was 41.1 ∼47.8%
for the Ls cut from both ends of UC, HCO and
VD specimens. While the MC near the bark
Fig. 5. Radial MC distribution of Ls for UC, HCO and VD specimens.
Fig. 6. Radial MC distribution of Ls for BR and BRC specimens.
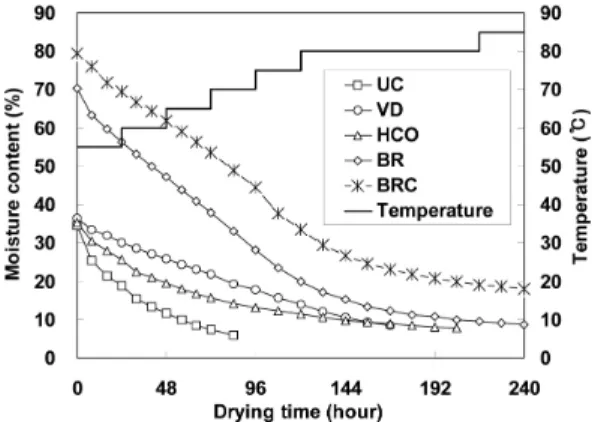
Fig. 7. Drying curve of specimens during air circu- lating-oven drying.
Fig. 8. Drying rates of specimens during air circulat- ing-oven drying.
was as high as 66.4 ∼90.6% and decreased sharply towards the sapwood for the Ls cut from both ends of BR and BRC specimens, showing the minimum value of 33.6 ∼33.9%.
After drilling, the heartwood of specimen was almost removed, which was expected to help decrease the moisture gradient in preventing checks.
3.2. Drying Curves and Drying Rates Fig. 7 shows the distribution of MCs and the drying rates of the specimens during air circu- lating-oven drying as a function of the drying
time, respectively.
It took 72, 204, 168 and 240 hours to dry the Control, HCO, VD and BR specimens, respec- tively, from the initial MC to about 8% MC, which was recommended as the indoor in-use MC. The VD and HCO specimens required lon- ger drying times than the UC specimen did, which might be due to the prevention of mois- ture evaporation from the inner surface of the specimens.
Fig. 8 shows drying rates of specimens. The
average drying rates were 0.149, 0.186, 0.271
and 0.260%/h for the HCO, VD, BR and BRC
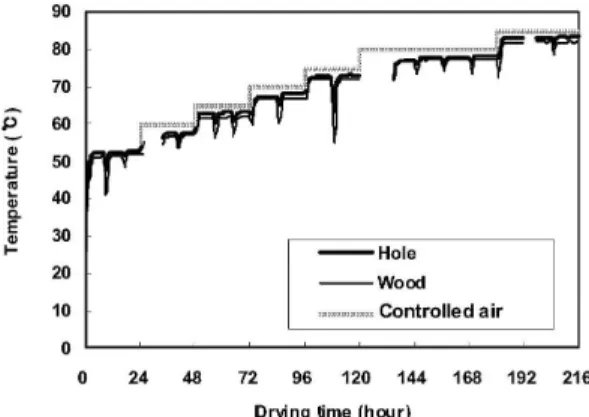
Fig. 9. Temperature distribution of UC specimen during the drying process.
Fig. 10. Temperature distribution of VD specimen during the drying process.
Fig. 11. Temperature distribution of HCO specimen during the drying process.
Fig. 12. Temperature distribution of BR specimen during the drying process.
specimens, respectively. VD specimen was showed higher average drying rates than HCO specimen did in spite of larger area of evaporating surface.
This might be due to the severe surface checks developed around 64 hours. BR and BRC specimens showed higher average drying rates than HCO and VD did, which might be the higher initial MC.
3.3. Distribution of Temperature During Air Circulating Oven-drying
Figs. 9 ∼13 show the temperature distribution inside the hole and wood of specimens.
The temperature in the hole of the VD speci-
men was lower than that of wood, and the dif-
ferences in temperatures became larger during
drying period. In the case of the UC and HCO
specimens, the temperature inside the hole could
be increased easily because the hole was ex-
posed directly to the hot air in the oven, while
Fig. 13. Temperature distribution of BRC specimen during the drying process.
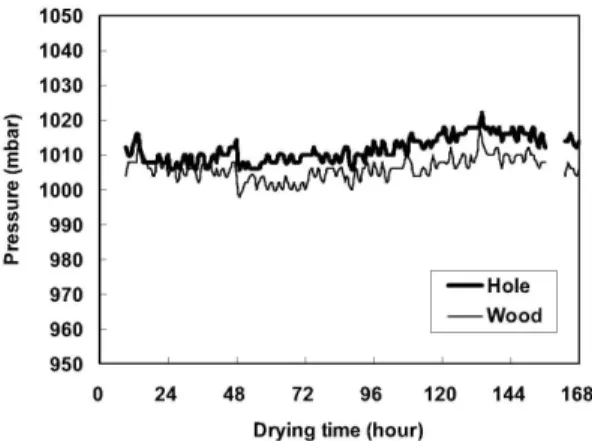
Fig. 14. Vapor pressure distribution of UC specimen during the drying process.
Fig. 15. Vapor pressure distribution of VD specimen during the drying process.
Fig. 16. Vapor pressure distribution of HCO speci- men during the drying process.
the transfer of the heat inside the solid body depended on conduction. However, in the case of VD specimen, the hole was prevented from contacting the atmosphere. Hence, the hot air had to then transfer from outer surface to the inner surface, and finally transfer to the hole, to heat the outer surface of the solid body.
As the drying progressed, there was little dif- ferences in temperatures, between the hole and wood for UC and HCO specimens. For the BR and BRC specimens, the differences between the hole and wood maintained relatively con-
stant. In the case of the UC and HCO speci- mens, moisture evaporated vigorously from the outer surface in the early stages of drying, and the wet line moved inside the solid body. There- fore, the solid body showed no increase in tem- perature due to the loss of heat by latent heat.
On the other hand, in the case of the BR and BRC specimen, moisture evaporation from the inner surface of the specimen was comparable to that of the outer surface covered by bark, and the outer surface reached equilibrium last.
Therefore, latent heat might be present in the
Fig. 17. Vapor pressure distribution of BR specimen during the drying process.
Fig. 18. Vapor pressure distribution of BRC speci- men during the drying process.
hole, during the later stages of drying.
3.4. Distribution of Vapor Pressure During Air Circulating Oven-drying
Figs. 14 ∼18 show the air vapor pressure dis- tribution inside the hole and wood of specimens.
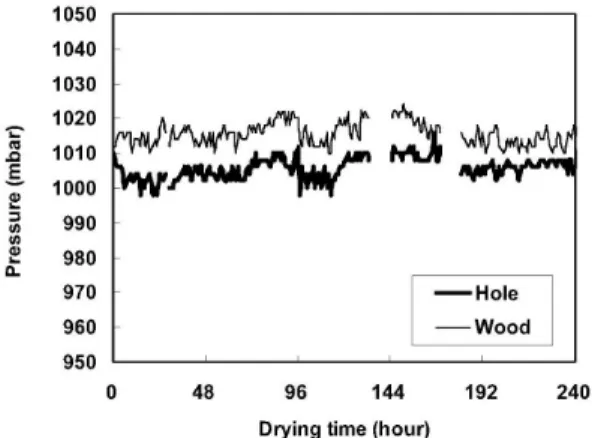
The vapor pressure of air in the hole was higher than that of inside wood for all speci- mens except for VD specimen. The vapor pres- sure of air in the hole was approximately am- bient pressure throughout the entire drying period.
The vapor pressure of air inside wood was higher than that of in the hole from approx- imately 8 hours to 40 hours of drying for HCO specimen, showing a peak of 1,068 mbar at 8 hours, then decreased sharply until 40 hours of drying time. After the 40 hours, the vapor pres- sure of air inside wood remained relatively con- stant until the end of drying. This can be ex- plained by fewer checks formed at the begin- ning of drying and the vapor that could be stor- ed inside the solid body. After the 8 hours, checks began to form and it was difficult to store the vapor evaporated from the inside wood.
As a result, the vapor pressure represented the
saturation vapor pressure corresponding to each position. For the specimen of UC, vapor pres- sure of air was lower than that of the hole at the beginning of 16 hours, showing about 980 mbar. This might be attributed to the fast dry- ing rates within the beginning of 8 hours of drying.
3.5. Surface Checking During Drying Figs. 19 and 20 shows the total length of surface checks occurring on the outer and inner surfaces of specimens during drying process.
The accumulated lengths of surface checks
were 1,870, 3,030 and 4,850 mm for UC, HCO
and VD specimens, respectively. Despite of the
smaller area of evaporating surface, there were
many surface checks on HCO and VD speci-
mens. That is probably because moisture evapo-
rated slowly from inner surface of HCO and
VD specimens, and it leads to the increment of
the moisture movement distance, which may
have eventually resulted in the increment of
moisture gradient. It has appeared that VD
treatment was not effective in preventing checks
for Japanese larch due to showing development
Fig. 19. Accumulated surface checks of UC, VD and HCO specimens during drying.
Fig. 20. Accumulated surface checks of BR and BRC specimens during drying.
Treatment
Shrinkage (%)
Circumfrencea Thicknessb a/b
UC 4.04 2.51 1.61
VD 3.97 1.72 2.31
HCO 5.56 3.08 1.81
Fig. 21. Circumferential and thickness shrinkage of UC, VD and HCO specimens during air circulating oven-drying.
Table 3. Shrinkage after drying of UC, VD and HCO specimens
of two deep checks.
3.6. Shrinkage
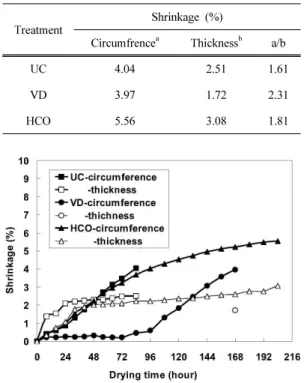
Table 3 and Fig. 21 shows the level of shrin- kage of the circumferential and thickness of specimens during air circulating-oven drying.
The ratio of circumference and thickness shrinkage was 1.29 for HCO specimen, present- ing less value comparing with UC and VD specimens. Thickness shrinkage of UC and HCO specimens was higher than circumferential shrin-
kage from the beginning of drying until 56 and 72 hours of drying time, respectively, and then the situation was reversed. At the beginning of drying, circumferential shrinkage was less eval- uated due to the appearance of surface checks.
Then, some closures of checks leaded to a dras- tic increase in circumferential shrinkage.
The ratio of circumferential shrinkage to thic-
kness shrinkage was 1.61 ∼1.81 for all speci-
mens except for VD specimens. For VD speci-
men, the ratio of circumferential shrinkage to
thickness shrinkage was 2.31, which was quite
higher compared to other specimens. This might
be due to the occurrence of two deep and wide
surface checks.
4. CONCLUSIONS
This study evaluated the effect of HCO and VD treatments on air circulating oven-drying characteristics of Japanese larch hollowed round- post. UC, HCO and VD hollowed round-post could be dried from the green to approximately 6% MC within 84 to 156 hours, and it took 72 to 240 hours to dry them to about 8% MC, which is recommended as the indoor in-use MC. The temperatures in the hole of the Control and HCO specimens showed a higher distri- bution pattern than those inside wood. The va- por pressure of air in the hole of the UC, HCO and BR specimens was higher than that inside wood; and showed differences as the highest value of 20 mbar. The surface checks on all specimens were mild and the average length of checks was observed in increasing order of BRC, BR, VD, HCO and UC specimens.
REFERENCES
1. Evans, P.D., Hill, R.W., Barry, S.C. 2000. The effects of different kerfing and center-boring treatments on the checking of ACQ treated pine
posts exposed to the weather. Forest Products Journal 50(2): 59∼64.
2. Fang, F., Ruddick, J.N.R., Avramidis, S. 2001.
Application of radio-frequency heating to utility poles. Part 1. Radio-frequency/vacuum drying of roundwood. Forest Products Journal 51(7/8): 56
∼60.
3. Lee, N.H., Luo, J.Y. 2002. Effect of steam ex- plosion treatments on drying rates and moisture distributions during radio-frequency/vacuum dry- ing of larch pillar combined with a longitudinal kerf. Journal of Wood Science 48: 270∼276.
4. Ruddick, J.N.R., Ross, N.A. 1979. Effect of kerfing on checking of untreated Douglas fir pole sections. Forest Products Journal 29(9): 27
∼30.
5. Yoshida, T., Hashizume, T., Fujimoto, N. 2000.
High-temperature drying characteristics on boxed- heart square timber of karamatsu and sugi- Influences of high temperature conditions with low humidity on drying properties. Mokuzai Kogyo 55(8): 357∼362 (in Japanese).
6. Yeo, H.M., Shim, K.B., Lee, D.S., Park, J.S., Eom, C.D., Han, Y.J., Lee, H.W., Lee, N.H., Smith, W.B., Park, J.H. Park, M.J. 2007. Effects of center boring and kerf treatment on kiln-dry- ing of larch square and round timbers. Forest Products Journal 57(11): 85∼92.