Evaluation of Carbon Fiber distribution in Unidirectional CF/Al Composites by Two-Dimensional Spatial Distribution Method
8
0
0
전체 글
(2)
(3)
(4)
(5)
(6)
(7)
(8)
수치
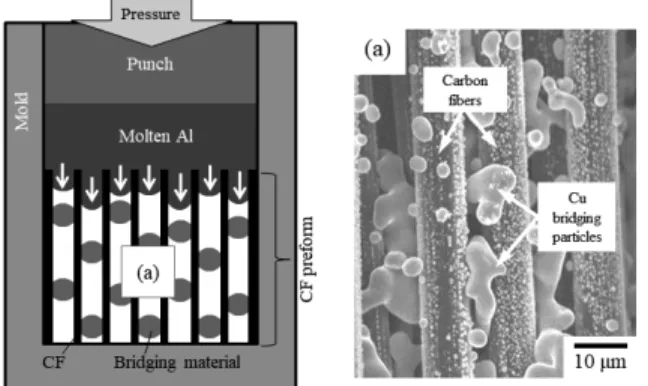
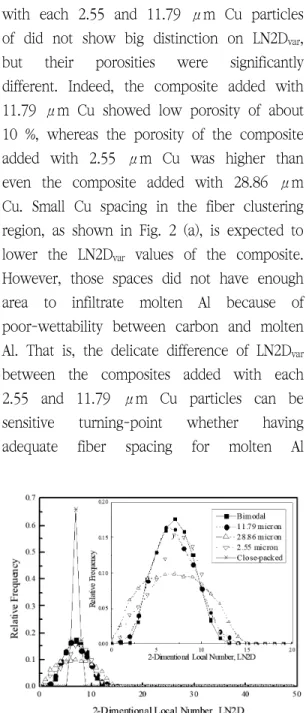
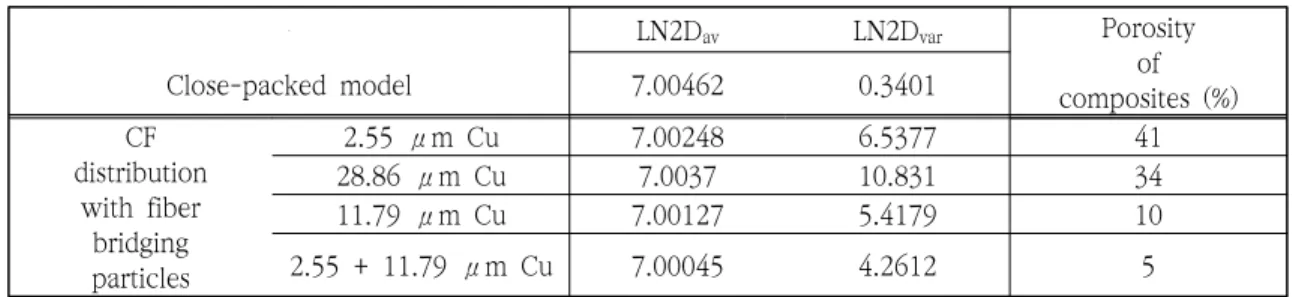
![Fig. 2 Cross-section SEM images of unidirectional CF/Al composites added with Cu bridging particle sizes of (a) 2.55 μm [12], (b) 28.86 μm [12], (c) 11.79 μm and (d) bimodal (mixed with 2.55 and 11.79 μm)](https://thumb-ap.123doks.com/thumbv2/123dokinfo/4858632.529046/4.876.119.424.651.887/cross-section-images-unidirectional-composites-bridging-particle-bimodal.webp)
+2
관련 문서
Effects of vacuum, mold temperature and cooling rate on mechanical properties of press consolidated glass fiber/PET composite , Composites Part A: Applied Science
In this study, paper purposes to evaluate characteristics of machined surface using Atomic Force Microscope in the precision cutting of aluminum( Al 6061 )
However, the short beam strength of the basalt fiber reinforced composites was higher than those of the glass fiber reinforced composites in the case of the Vacuum
Wang et al., Smart Soft Composite Actuator with Shape Retention Capability using Embedded Fusible Alloy Structures, Composites Part B: Engineering (2015).. Shape
A representative material, carbon fiber reinforced composite material, has not only high strength of carbon fiber, high elastic modulus, high thermal conductivity, low
– Short fiber or whisker reinforced composites (e.g. Continuous fiber or sheet reinforced MMCs)..
The hydrogen containing amorphous carbon, which is known as diamond-like carbon (DLC), is deposited by positively charged hydrogenated clusters. 5 Similarly, in the silicon
Summerscales, "An investigation into the effects of fabric architecture on the processing and properties of fibre reinforced composites produced by resin
