y
-1사이로 알려져 있으며 (Kettle and Andreae, 2000), 이렇게 황 (S)을 함유하는 미세먼지는 구름 응결핵으 로 중요하게 작용할 뿐만 아니라 (Meskhidze and Nenes, 2006), 복사 강제력 등 기후변화에 직간접적으 로 영향을 주고 있다 (Liss and Lovelock, 2007). 인위적 연소과정 등에 의한 발생되는 SO
42-과는 달리, MSA 의 주발생원인은 DMS의 산화과정으로부터 기인하기 때문에 , 해양 및 육상기원을 구별하는 지표성분으로 알려져 있다 (Legrand et al., 1991).
1. 배 경
해상 생물종으로부터 발생한 methanesulfonic acid (MSA)는 최종 산물인 비해염입자 황산염 (SO
42-)를 생성하며, 이에 대한 대기 중 미세먼지 정량적 기여량 연구가 오래전부터 연구되고 있다 (Eisele et al., 2008).
MSA는 일반적으로 해양 플랑크톤에 의해 발생된 dimethylsulfide (DMS)가 산화되어 생성된다 (Scarratt et al., 2002). 해양 DMS의 배출 추정치는 15~33 TgS
p-ISSN 1598-7132, e-ISSN 2383-5346
논 문
LC/MSMS를 이용한 광주지역 초미세먼지 MSA 농도 및 육상기원 2차 유기성분과의 관계
Assessment between MSA and Land Originated Secondary Organic Products of PM 2.5 Using LC/MSMS in Gwangju Area
이용민, 김은영, 오세호
1), 박민한
2), 정지효
2), 이해범
2), 송한결
2), 곽노현
2), 이은비
2), 김경주
2), 박기홍
2), 배민석*
국립목포대학교 환경공학과, 1)국립기상과학원 환경기상연구과
2)광주과학기술원 지구환경공학부
Yongmin Lee, Eunyoung Kim, Sea-Ho Oh
1), Minhan Park
2), Jihyo Chong
2), Haebum Lee
2), Hangyul Song
2), Nohhyeon Kwak
2), Eunbi Lee
2),
Kyungjoo Kim
2), Kihong Park
2), Min-Suk Bae *
Department of Environmental Engineering, Mokpo National University, Muan, Republic of Korea
1)Environmental Meteorology Research Division, National Institute of Meteorological Sciences, Jeju, Republic of Korea
2)Gwangju Institute of Science and Technology School of Earth Sciences and Environmental Engineering, Gwangju Institute of Science and Technology, Gwangju, Republic of Korea
Abstract Understanding sources of PM2.5 methanesulfonic acid(MSA) from land originated emissions can provide valuable information for ambient sulfate formation. This study determined the main chemical compositions of PM2.5(i.e., organic carbon (OC), elemental carbon(EC), water soluble organic carbon(WSOC), water-soluble ions, and secondary organic products using liquid chromatography tandem mass spectrometry(LC/MSMS). The sampling sites at the Gwangju Institute of Science and Technology were selected for comprehensive PM investigations in the wintertime of 2017 and 2018. As a result, MSA presents higher correlation coefficient of 0.88 with secondary organic compounds of land originated 2,3-dihydroxy-4-oxopentanoic Acid (DHOPA), 3-hydroxyglutaric Acid(3-HGA). However, lower correlation coefficient of 0.21 with levoglucosan is shown. This study can provide land originated sources into the MSA, which could be a contributor of sulfate in PM2.5.
Key words: Organic Molecular Marker, MSA, SOA, Sulfate
접수일 2019년 9월 22일 수정일 2019년 10월 4일 채택일 2019년 10월 7일 Received 22 September 2019 Revised 4 October 2019 Accepted 7 October 2019
*Corresponding author Tel : +82-(0)61-450-2485 E-mail : [email protected]
하지만 , 최근 연구결과에 따르면, MSA는 해상기원 과 더불어 육지기원 DMS와 관련성이 있고 (Golly et al., 2019), 농업 활동, 산업 배출 및 식생 연소에서 비 롯된 황화합물의 산화과정에서 생성될 수 있으며 (Chen and Finlayson-Pitts, 2017; Kunwar et al., 2016), 교외 지역 육상 생물로부터 기인한 MSA 생성 (Boz- zetti et al., 2017), 아마존 토양기원 DMS로부터 생성 된 MSA (Jardine et al., 2015) 등, 다양한 원인으로부터 발생 가능성이 있다 . 이렇게 다양한 경로로부터 발생 된 MSA는 amine 및 ammonia와 반응하여 새로운 미 세먼지를 생성한다 (Chen et al., 2016). 최근 연구결과 에 의하면, 식생연소 지표성분인 levoglucosan과는 낮 은 상관성을 나타내지만 , 석탄 연소에 따른 2차 유기 생성물인 dicarboxylic acids와 MSA 간에 높은 상관성 (r=0.84)을 보여 MSA에 대한 새로운 배출원인을 보 고하였다 (Kunwar et al., 2016). 선행연구의 MSA농도 를 살펴보면 중국 상하이에서 0.34 μg/m
3(Wang et al., 2006), 이탈리아 Salento 대학교에서 약 0.02 μg/m
3(Perrone et al., 2013), 이탈리아 제노아에 있는 Corso Firenze, Multedo, Bolzaneto 도시에서 측정된 농도는 각각 0.08, 0.06, 0.05 μg/m
3(Bove et al., 2014)의 농도가
보고되었다 .
지금까지 해상기원으로만 알려진 MSA는 육상을 포함한 다양한 원인에 의해 생성되며, ammonia와 함 께 미세먼지를 생성하는 주요 성분이다. 하지만, 국내 육상기원 MSA의 발생 원인 분석은 매우 미진하다. 본 연구에서는 광주지역에서 2017년 12월, 2018년 11월 에 초미세먼지를 포집하여, 유기탄소 (organic carbon, OC), 원소탄소 (elemental carbon, EC), 수용성유기탄 소 (water soluble organic carbon, WSOC), 이온성분, 및 MSA, levoglucosan, 2,3-dihydroxy-4-oxopentanoic Acid (DHOPA), 3-hydroxyglutaric Acid (3-HGA)을 포 함한 수용성 유기지표성분을 liquid chromatography tandem mass spectrometry (LC/MSMS)를 이용하여 분 석하고 , MSA와의 관련성을 분석하였다 (그림 1).
2. 연구 방법
2. 1 포집장소
대기 중 MSA을 포함한 수용성 유기지표성분을 포 집하고자 광주과학기술원 삼성동 (35.23°N, 126.84°E)
CH3
Toluene
CH3
α-pinene (C10H16) 3-hydroxyglutaric acid
(3-HGA) OH
O O
OH OH
CH3 O OH O
OH OH
2,3-Dihydroxy-4-oxopentanoic acid (DHOPA)
Dimethylsulfide (DMS)
? ?
SO42-
S CH3 H3C Methanesulfonic acid
(MSA) OH O O S H3C
Fig. 1. Marine source of methanesulfonic acid(MSA) and its associations with anthropogenic and land sources.
3층에서 2017년 12월 11일부터 15일, 2018년 11월 19 일부터 23일까지 총 10일간 고용량 포집장치를 이용 하여 포집하였다. 본 측정소는 광주광역시의 도심 북 쪽 끝에 위치해 있고, 서쪽 및 남쪽은 산업, 동쪽은 교 외 및 농업지역이 있으며 , 측정소에서 약 2 km 지점 에 호남고속도로가 위치해 있다 .
2. 2 분석방법
2. 2. 1 수용성유기지표성분
수용성유기지표성분을 분석하고자 LC/MSMS (LC;
1200, tandem-MS; 6410, Agilent Technologies, USA)를 이용하여 , 분진 내 존재하는 수용성유기지표성분을 분석하였다 (Lee et al., 2018). 고용량 포집장치에 의해 포집된 석영 시료를 10 mL의 증류수을 이용하여 4℃
로 설정된 유체 순환기 (CA-111, Eyela, Japen)와 초음 파기 (8800, Branson, USA)를 이용해 120분 동안 추출 하였다. 시린지 여과지 (PVDF 0.45 μm)로 여과한 최종 추출액은, 분석 전까지 냉장 보관하였다. LC/MSMS는 atmospheric-pressure chemical ionization (APCI) sour- ce (Nagy et al., 2006)를 이용하여, 수용성 유기성분들 을 이온화한 후, 두 개의 직렬 질량 분석기에 의해 질
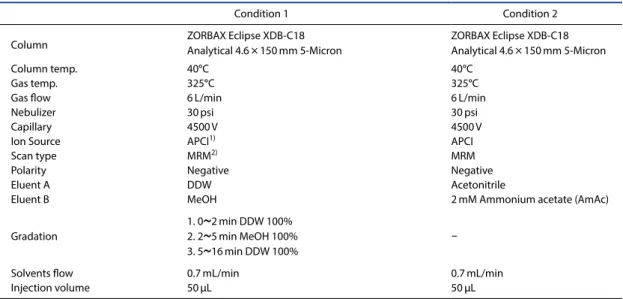
량 파편 (m/z)을 선택적 분리하여, 이온 증폭 검출기에 의해 질량 이온을 최종 분석한다 . 본 연구에서는 컬럼 온도 40℃ 하에 ZORBAX (Eclipse XDB-C18 Analyti- cal 4.6×150 mm 5-Micron) 컬럼을 이용하여, 분석 성 분에 따른 서로 다른 두 용리액 조건 (Condition 1 & 2) 에서 분석하였다 (표 1). 이후, 주입온도 325℃에서 60 PSI 압력 하에, 50 μL 주입 시료와 함께 질량 분석기로 주입된다. 간략히, Condition 1은 DDW 및 methanol (MeOH)의 100% 조건에서 1,2,4-benzene carboxylic acid & 1,3,5-benzene carboxylic acid (124,135-BCA), 1,2-benzene carboxylic acid & 1,4-benzene carboxylic acid (12,14-BCA), sebacic acid, azelaic acid, pinic acid, suberic acid, pimelic acid가 분석되며, Condition 2에 서는 2 mM Ammonium acetate buffer 용액 하에 MSA 를 포함한, levoglucosan, DHOPA, 3-HGA, adipic acid, glutaric acid, succinic acid, malonic acid를 분석하였 다 . 그림 2, 표 2에 검출 질량 이온 및 분석에 사용한 에너지를 나타냈다 . LC/MSMS는 단일 질량 분석기와 다르게 연속 질량 파편 분석에 의해 목적 성분만 분석 하므로, 목적 성분마다 고감도를 나타내는 Fragmen- tor Voltage, 충돌 에너지 그리고 최종 생성이온 (m/z)
Table 1. Operational conditions of LC/MSMS system.
Condition 1 Condition 2
Column ZORBAX Eclipse XDB-C18
Analytical 4.6×150mm 5-Micron
ZORBAX Eclipse XDB-C18 Analytical 4.6×150mm 5-Micron
Column temp. 40°C 40°C
Gas temp. 325°C 325°C
Gas flow 6L/min 6L/min
Nebulizer 30psi 30psi
Capillary 4500V 4500V
Ion Source APCI1) APCI
Scan type MRM2) MRM
Polarity Negative Negative
Eluent A DDW Acetonitrile
Eluent B MeOH 2mM Ammonium acetate (AmAc)
Gradation
1. 0~2min DDW 100%
2. 2~5min MeOH 100%
3. 5~16min DDW 100%
-
Solvents flow 0.7mL/min 0.7mL/min
Injection volume 50μL 50μL
1)atmospheric-pressure chemical ionization
2)Multiple Reaction Monitoring
(Product Ion)에 대한 조건은 매우 중요하다. 본 연구 에서는 MSA 분석을 위해 40 FV에 의해 발생한 전구 이온 96.1 m/z를 이용하여, 4 collision energy에 의한 생성이온 79.9 m/z를 정량 분석에 최종 이용하였다.
2. 2. 2 수용성이온성분
수용성 음이온 (F
-, Cl
-, NO
3-, PO
3-, SO
42-) 및 양이 온 (Na
+, NH
4+, K
+, Ca
2+, Mg
2+)을 분석하고자 두 대 의 이온크로마토그래피를 동시 이용하였다. 간략히, 원 추출액으로부터 20배 희석한 시료를 자동주입기
(Metrohm 858, Switzerland)를 이용하여, 음이온 이온 크로마토그래피 (Metrohm 883 Switzerland, Metrosp A Supp 150/4.0 칼럼, 3.7 mM Na
2CO
3& 1.0 mM NaHCO
3) 및 양이온 이온크로마토그래피 (Metrohm 930 Swizerland, Metrosep C4-250/4.0 칼럼, 5 mM HNO
3)에 동시 주입 (250 μL)하여 각각의 전기전도도 검출기에 의해서 측정되었다 . 최소 5가지의 음이온 표준시료 (0.25~4 ppm), 양이온 표준시료 (0.25~4 ppm)로 정량화했으며, 전체시료의 10% 재차 분석으 로 정밀도를 확인하였다 (Cho et al., 2015).
95 100 80
8060 4020
Counts(%)
0 20 40 60 80 100 120 140 m/z
Methanesulfonic acid Precursor Ion
79.9 94.8
60 10080
6040 Counts(%)20
0 60 70 80 90 100 110 120 m/z
Methanesulfonic acid Product Ion
165.1
59.1 113
0 50 100 150 200 250 10080
6040 200
Counts(%)
m/z
1,2 1,4 Benzene carboxylic acid Precursor Ion
121
100
60 80 120 140
10080 60 4020 Counts(%) 0
m/z
1,2 1,4 Benzene carboxylic acid Product Ion
0 2 4 6 8
x104
4 8 12
Counts(%) 0
Retention time (min) 121 m/z sample = 20171214_W
0 2 4 6 8
x104
0 2 4 6 8
Counts(%)
Retention time (min) 121 m/z standard = 2.67ppm
0 2 4 6 8
1 2 3 4 x1035
Retention time (min) 79.9 m/z sample = 20181120_W
Counts(%)
0 1 2 3 4 5
0 24 68 10 x10123
Retention time (min) 79.9m/z standard = 2.67ppm
Counts(%)
Fig. 2. Mass fragment ions(m/z) of precursor ion and product ion for methanesulfonic acid(MSA) and 12,14-benzene carboxylic acid using LC/MSMS.
Table 2. Mass fragment ions(m/z) for water soluble organic molecular markers using LC/MSMS.
Common name Molecular weight CE(V)1) Product Ion(m/z)
Condition 1
124,135-BCA2) 201.1 5 165
sebacic acid 202.2 10 183.1
azelaic acid 188.2 10 125.3
pinic acid 186.2 7 141.4
suberic acid 174.1 8 112.3
12,14-BCA3) 166.1 1 121
pimelic acid 160.1 7 97.2
Condition 2
levoglucosan 162.1 3 59
2,3-dihydroxy-4-oxopentanoic acid(DHOPA) 148.1 7 73.2
3-hydroxyglutaric acid(3-HGA) 148.1 23 43.2
adipic acid 146.1 7 101.2
glutaric acid 132.1 5 87.2
succinic acid 118 7 73.2
malonic acid 104 26 41.2
methylsulfonic acid(MSA) 96.1 4 79.9
1)Collision Energy
2)1,2,4-benzene carboxylic acid & 1,3,5-benzene carboxylic acid
3)1,2-benzene carboxylic acid & 1,4-benzene carboxylic acid
2. 2. 3 유기탄소 원소탄소
OC 및 EC 분석을 위하여 실험실 탄소분석기 (Lab based OCEC Carbon Aerosol Analyzer, Sunset labor- atoryInc., USA)를 이용하였다. 탄소분석기는 Nation- al Institute of Occupational Safety & Health (NIOSH 5040) 프로토콜 (protocol)을 기초로 한 열광학적 투과 도 법을 이용한 분석법이다 (Lee et al., 2018). 간략히, 최대온도 870도에서 무산소상태 OC 및 산소주입상 태 EC가 분석되어, 레이져 투과율에 의한 OC 및 EC 의 분리점을 확인하였다. 전체시료의 10% 재차 분석 및 단당을 이용한 외부표준물질을 이용하여 , 5% 이내 정확 정밀도를 유지하였다 .
2. 2. 4 수용성유기탄소
이온분석에 사용된 동일 희석시료를 총탄소분석기 (Sievers M9,GE, USA)를 이용하여 대기 중 수용성유 기탄소를 분석하였다. 간략히, Acid (H
3PO
4) & Oxi- dizer ((NH
4)
2S
2O
8) 각각 2.0 μL/min, 0.5 μL/min 유량
하에, UV 체류 반응에 따른 총탄소 (유기탄소 및 무기 탄소) 및 무기탄소의 차에 의해 산출된 수용성유기탄 소를 전기전도도검출기를 이용하여 분석하였다 (Oh et al., 2018).
본 연구에서는 미세먼지 기본성분인 OC, EC, WSOC, 이온성분과 더불어 MSA, DHOPA, 3-HGA 등 을 포함한 수용성 유기지표성분을 통해 육상 발생 MSA의 관련성을 분석하였다.
3. 결 과
2017년 12월 및 2018년 11월 중 총 10일간 광주측 정소에서 분석된 OC, EC, WSOC, WSOC/OC, 그리고 수용성 이온 , MSA 등 전체 평균값을 표 3에 나타냈 다 . OC의 경우 2017년 6.39±3.12 μg/m
3(평균±표준 편차), 2018년 9.18±2.64 μg/m
3로 분석되었으며, WSOC 3.23 μg/m
3, levoglucosan 291 ng/m
3, EC 1.02
Table 3. Analytical results of PM2.5 chemical concentrations.Compounds Unit 2017 2018 Overall
AVG STD AVG STD AVG
OC μg/m3 6.39 3.12 9.18 2.64 7.79
EC μg/m3 0.77 0.39 1.28 0.65 1.02
WSOC μg/m3 2.85 1.15 3.61 0.82 3.23
WSOC/OC - 0.45 0.04 0.39 0.04 0.42
Sulfate μg/m3 2.28 1.14 4.17 1.61 3.23
Nitrate μg/m3 3.87 2.92 12.15 4.83 8.01
Ammonium μg/m3 2.04 1.17 3.69 1.20 2.87
MSA ng/m3 40.44 13.88 60.15 16.23 50.29
DHOPA1) ng/m3 2.23 0.82 3.39 1.43 2.81
3-HGA2) ng/m3 1.66 0.82 2.29 0.60 1.97
levoglucosan ng/m3 270.26 200.09 311.06 83.37 290.66
malonic acid ng/m3 8.46 5.01 18.65 8.35 13.56
succinic acid ng/m3 12.22 5.09 14.20 1.96 13.21
glutaric acid ng/m3 19.24 4.80 9.32 0.67 14.28
adipic acid ng/m3 16.20 3.78 7.88 1.23 12.04
azelaic acid ng/m3 0.72 0.88 2.01 1.26 1.36
sebacic acid ng/m3 0.82 0.45 1.66 0.58 1.24
12,14-BCA3) ng/m3 26.34 14.24 49.03 16.60 37.68
124,135-BCA4) ng/m3 2.10 1.57 3.36 2.12 2.73
1)2,3-dihydroxy-4-oxopentanoic acid
2)3-hydroxyglutaric acid
3)1,2-benzene carboxylic acid & 1,4-benzene carboxylic acid
4)1,2,4-benzene carboxylic acid & 1,3,5-benzene carboxylic acid
μg/m
3로 나타났다 . OC 내 WSOC의 비율 WSOC/OC 은 0.42로 분석되었으며, WSOC와 levoglucosan의 비 율은 9%로 분석되었다. 과거 선행연구와 비교해 볼 때, 남원측정소에서 WSOC/OC가 0.61로 보고되어 본 연구결과보다 높게 나타났다 . 이는 여름철 2차 유 기탄소에 의한 영향이 93%로 높게 나타난 결과이며 (Oh et al., 2018), WSOC와 levoglucosan 비율은 8%로 본 연구결과와 비슷하게 분석되어, 식생 연소에 의한 대기 중 상대 기여량은 비슷한 수준에서 분석되었다 . 이온 성분의 경우 NO
3-이 평균 8.01 μg/m
3로 전체 기 간 중 가장 높게 나타났으며, SO
42-3.23 μg/m
3, NH
4+2.87 μg/m
3로 분석되었다 . 본 측정일이 겨울철임을 감 안할 때 , NO
3-, NH
4+가 초미세먼지를 정량적으로 구 성하는 대표성분으로 분석되었다 .
오존 및 식생 휘발성 유기지표성분인 α-pinene 반 응에 의한 2차 유기성분 형성은 초미세먼지에 대한 정량적 기여량을 이해하는 데 매우 중요하며 , 이에 따른 수많은 연구가 이루어지고 있다 (Witkowski and Gierczak., 2014). 본 연구에서는 α-pinene의 최종 2차
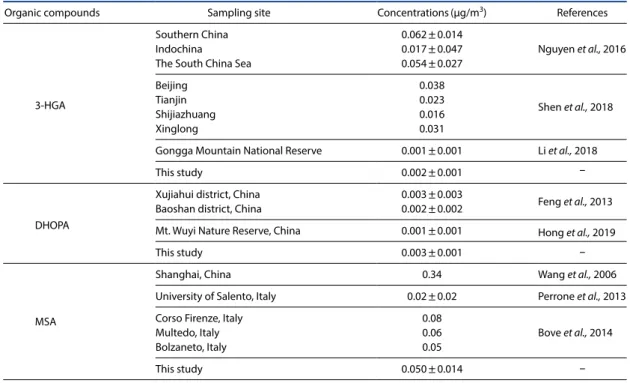
유기성분인 3-hydroxyglutaric acid (3-HGA, CAS Number 638-18-6)를 LC/MSMS로 분석하였다 (Claeys et al., 2007). 과거 분석 연구결과를 살펴보면 (표 4), 중국남부에서 62 ng/m
3로 나타났으며, 인도네시아에 서 17 ng/m
3로 분석되었다 (Nguyen et al., 2016). 또한, 베이징 38 ng/m
3, 텐진 23 ng/m
3으로 분석되었다 (Shen et al., 2018). 본 연구에서는 1.66±0.82 ng/m
3로 나타나 과거 분석된 결과에 비해 매우 낮게 분석되었 다 .
대기 중 인위적 휘발성 유기화합물 중 높은 농도를 나타내는 톨루엔은 OH 라디칼에 의해 빠르게 산화되 어 2차 유기성분을 생성한다. 생성된 강한 극성 성분 은 흡습성을 나타내며 , 복사 강제력 및 광산란을 일으 킴으로써 기후변화에 직간접적인 영향을 미친다 . 따 라서, 톨루엔으로부터 산화된 2차 유기성분의 분석은 매우 중요하다 (Feng et al., 2019). 또한, 본 연구에서는 2,3-dihydroxy-4-oxopentanoic Acid (DHOPA)를 분석 하였다 . DHOPA는 자연 발생 2차 성분인 3-HGA와 다르게, 인위적 발생 방향족 휘발성 유기성분인 톨루
Table 4. Previous results for 3-HGA, DHOPA, and MSA.
Organic compounds Sampling site Concentrations(μg/m3) References
3-HGA
Southern China 0.062±0.014
Nguyen et al., 2016
Indochina 0.017±0.047
The South China Sea 0.054±0.027
Beijing 0.038
Shen et al., 2018
Tianjin 0.023
Shijiazhuang 0.016
Xinglong 0.031
Gongga Mountain National Reserve 0.001±0.001 Li et al., 2018
This study 0.002±0.001 -
DHOPA
Xujiahui district, China 0.003±0.003 Feng et al., 2013
Baoshan district, China 0.002±0.002
Mt. Wuyi Nature Reserve, China 0.001±0.001 Hong et al., 2019
This study 0.003±0.001 -
MSA
Shanghai, China 0.34 Wang et al., 2006
University of Salento, Italy 0.02±0.02 Perrone et al., 2013
Corso Firenze, Italy 0.08
Bove et al., 2014
Multedo, Italy 0.06
Bolzaneto, Italy 0.05
This study 0.050±0.014 -
엔의 대표적인 2차 유기성분으로 알려져 있다 (Al- Naiema et al., 2017). 과거 분석 연구결과를 살펴보면 (표 4), 중국 Xujiahui district에서 3 ng/m
3(Feng et al., 2013), Mt. Wuyi Nature Reserve 1 ng/m
3(Hong et al., 2019)를 보고하였다. 본 연구에서는 2.81 ng/m
3로 나 타나, 다른 지역과 비슷한 농도결과를 나타냈다.
본 연구에서는 DHOPA, 3-HGA 등과 함께 육상 발 생 MSA의 관련성을 분석하였다. LC/MSMS로 분석된 MSA 농도를 살펴보면, 상하이 340 ng/m
3(Wang et al., 2006), 이탈리아 University of Salento 20 ng/m
3(Per- rone et al., 2013), Corso Firenze, Multedo, Bolzaneto에 서 각각 80, 60, 50 ng/m
3로 분석되었다 . 본 연구에서는 50.29 ng/m
3로 나타나, 이탈리아 지역과 비슷한 농도 결과를 나타냈다. 분석된 MSA의 절대농도를 다른 유 기성분 농도와 비교해 볼 때 , levoglucosan 다음으로 높은 농도를 나타냈다 (표 3, 그림 3). 이는, 측정소가 내륙에 위치해 있음을 감안해 볼 때, 해상기원 MSA와 더불어 육상기원 MSA의 발생 원인을 배제할 수 없다.
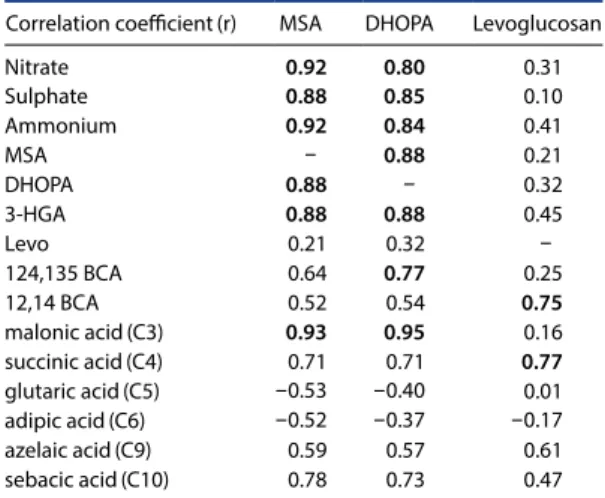
MSA의 기원을 분석하고자 levoglucosan, 3-HGA, DHOPA와의 상관계수 (r)를 분석하여 나타냈다 (표 5 , 그림 4). 먼저, MSA와 높은 상관계수를 나타낸 성분 은 malonic acid, DHOPA, 3-HGA, NO
3-, SO
42-, NH
4+로 나타났다. malonic acid는 대기 중 존재하는 대표적 인 2차 dicarboxylic acid로 자연적, 인위적으로 모두 발생한다 . 또한, DHOPA, 3-HGA의 상관계수가 0.88 로 높게 나타나 , 두 성분에 대한 상관관계 분석으로 식생 유기성분에 의한 자연적 발생 및 인위적 발생과 의 연관성 분석을 명확히 할 수 없다. 하지만, NO
3-, SO
42-, NH
4+의 상관계수가 0.92, 0.88, 0.92로, 평균 91 로 높게 나타난 것을 고려해 볼 때 , 인위적 발생 원인
0 0.05 0.1 0.15
12/11 12/12 12/13 12/14 12/15
123,135 BCA 12,14 BCA Azelaic acid Sebacic acid Malonic acid DHOPA 3-HGA Adipic acid Glutaric acid Succinic acid
2017
µg/m3
0 0.6
0.4
0.2
12/11 12/12 12/13 12/14 12/15 Levoglucosan 2017
MSA
µg/m3
0 0.5 0.4 0.3 0.2 0.1
11/19 11/20 11/21 11/22 11/23 Levoglucosan 2018
MSA
µg/m3
0 0.05 0.1 0.15
11/19 11/20 11/21 11/22 11/23
123,135 BCA 12,14 BCA Azelaic acid Sebacic acid Malonic acid DHOPA 3-HGA Adipic acid Glutaric acid Succinic acid
2018
µg/m3
Fig. 3. Time series of PM2.5 water soluble organic concentrations.
Table 5. Correlation coefficient between MSA, DHOPA, &
levoglucosan and each chemical compound.
Correlation coefficient(r) MSA DHOPA Levoglucosan
Nitrate 0.92 0.80 0.31
Sulphate 0.88 0.85 0.10
Ammonium 0.92 0.84 0.41
MSA - 0.88 0.21
DHOPA 0.88 - 0.32
3-HGA 0.88 0.88 0.45
Levo 0.21 0.32 -
124,135 BCA 0.64 0.77 0.25
12,14 BCA 0.52 0.54 0.75
malonic acid(C3) 0.93 0.95 0.16
succinic acid(C4) 0.71 0.71 0.77 glutaric acid(C5) -0.53 -0.40 0.01 adipic acid(C6) -0.52 -0.37 -0.17
azelaic acid(C9) 0.59 0.57 0.61
sebacic acid(C10) 0.78 0.73 0.47
과 좀 더 높은 상관성이 있는 것으로 분석된다. SO
42-와 높은 상관계수 (r =0.88)은 MSA로부터 산화되어 SO
42-생성과 관련성이 있으며, levoglucosan과의 낮 은 상관계수 (r=0.21)는 식생연소와 관련성이 없음을 의미한다. 더 나아가, 식생 2차유기성분인 DHOPA와 성분들 간의 상관관계를 분석하였다 . 결과, 높은 상관 계수를 나타낸 성분은 세 이온성분과 더불어 MSA, 3-HGA로 나타났다. 또한, 124,135-BCA와의 높은 상 관계수 (r =0.77) 및 NO
3-(r =0.80)를 분석해 볼 때, 차량 배출 톨루엔으로부터 기인한 DHOPA 생성 가능 성이 있다 (Faber et al., 2013). 이와 더불어 levo glu
cosan과 높은 상관계수를 나타낸 성분은 12,14-BCA 와 succinic acid로 나타나, MSA 및 DHOPA와 다른 성 분 간 상관계수를 나타냈다 .
본 연구결과를 종합해 볼 때 , MSA는 해상 기원뿐 만 아니라, 육상기원의 자연적, 인위적 발생을 포괄하 는 다양한 원인에 의해 생성될 수 있다. 특히, SO
42-와 의 높은 상관계수는 대기 중 초미세먼지 육상 생성에 직접적으로 관련되어 있음을 의미한다 . 향후, 추가 연 구를 통해 보다 명확한 MSA 원인규명과 SO
42-에 대 한 정량적 기여량 산정을 진행할 계획이다. 본 연구
는 국내 처음으로 MSA의 육상기원 가능성을 제시함 으로써 , 향후 SO
42-등 2차 분진에 따른 대기오염 모 델 등에 새로운 2차 생성에 대한 원인을 제공한다.
4. 결 론
본 연구에서는 광주 측정소에서 고용량 포집장치 로 포집한 석영 시료를 이용하여 초미세먼지 내 OC, EC, WSOC, 이온성분과 더불어 MSA를 포함한 수용 성 유기지표 성분을 통해 육상발생 MSA의 관련성을 분석하였다. 결과, MSA는 2차 유기지표 성분인 DHOPA, 3-HGA와 높은 상관계수 (r=0.88)를 나타내 고 , 식생연소에서 발생하는 levoglucosan과는 낮은 상 관계수 (r=0.21)로 분석되었다. 또한 SO
42-와 높은 결 정계수 (r=0.88)는 MSA로부터 산화되어 SO
42-생성 과 관련성이 나타났다. MSA는 해상뿐만 아니라, 육 상에서 자연적 , 인위적 발생을 포함한 다양한 원인에 의해 생성될 수 있으며 , SO
42-와 높은 상관계수는 대 기 중 초미세먼지 육상 생성에 직접적 영향이 있다.
본 연구는 우리나라 MSA의 육상기원 가능성과 함께,
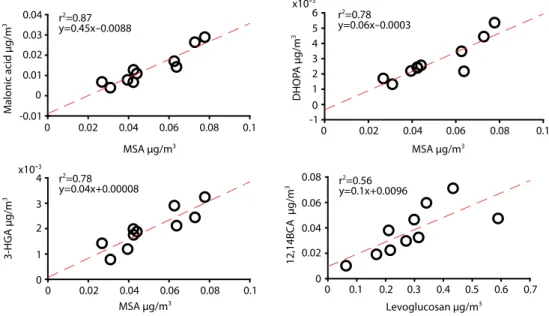
x10-30 0.02 0.04 0.06 0.08 0.1
0 -1 1 2 3 4 5 6
MSA µg/m3
DHOPA µg/m3
00
0.1 0.2 0.3 0.4 0.5 0.6 0.7 0.02
0.04 0.06 0.08
Levoglucosan µg/m3
12,14BCA µg/m3
0 0.02 0.04 0.06 0.08 0.1
0.04 0.03 0.02 0.01 0 -0.01
MSA µg/m3
Malonic acid µg/m3 r2=0.87
y=0.45x-0.0088
r2=0.78 y=0.06x-0.0003
0 0.02 0.04 0.06 0.08 0.1
0 1 2 3 x10-43
MSA µg/m3
3-HGA µg/m3
r2=0.78
y=0.04x+0.00008 r2=0.56
y=0.1x+0.0096
Fig. 4. Pairwise correlation scatterplots between water soluble organic compounds.
초미세먼지 내 높은 함량을 가지는 SO
42-에 대한 원 인제공을 함으로써 , 향후 2차 미세먼지 생성 등을 이 해하는 데 기초적인 자료를 제공한다.
감사의 글
본 논문은 정부 재원으로 한국연구재단 (NRF-2017 R1D1A1B03029517 및 NRF-2017M3D8A1092222)의 지원을 받아 수행하였습니다. 또한, 이 연구는 기상 청 국립기상과학원 「황사·연무 감시 및 예보기술 개발」 (1365003013)의 지원으로 수행되었습니다.
References
Al-Naiema, I.M., Stone, E.A.(2017) Evaluation of anthropogenic secondary organic aerosol tracers from aromatic hydrocarbons, Atmospheric Chemistry and Physics, 17, 2053-2065, https://doi.org/10.5194/acp-17-2053- 2017.
Bove, M.C., Brotto, P., Cassola, F., Cuccia, E., Massabò, D., Mazzino, A., Piazzalunga, A., Prati, P.(2014) An integrated PM2.5 source apportionment study: Positive Matrix Factori- sation vs. the chemical transport model CAMx, Atmospheric Environment, 94, 274-286, https://doi.
org/10.1016/j.atmosenv.2014.05.039.
Bozzetti, C., Sosedova, Y., Xiao, M., Daellenbach, K.R., Ulevicius, V., Dudoitis, V., Mordas, G., Byčenkienė, S., Plauškaitė, K., Vlachou, A., Golly, B., Chazeau, B., Besombes, J.-L., Baltensperger, U., Jaffrezo, J.-L., Slowik, J.G., El Had- dad, I., Prévôt, A.S.H.(2017) Argon offline-AMS source apportionment of organic aerosol over yearly cycles for an urban, rural, and marine site in northern Europe, Atmospheric Chemistry and Physics, 17, 117- 141, https://doi.org/10.5194/acp-17-117-2017.
Chen, H., Finlayson-Pitts, B.J.(2017) New Particle Formation from Methanesulfonic Acid and Amines/Ammonia as a Function of Temperature, Environmental Science &
Technology, 51, 243-252, https://doi.org/10.1021/acs.
est.6b04173.
Chen, H., Varner, M.E., Gerber, R.B., Finlayson-Pitts, B.J.(2016) Reactions of Methanesulfonic Acid with Amines and Ammonia as a Source of New Particles in Air, The Journal of Physical Chemistry B, 120, 1526-1536,
https://doi.org/10.1021/acs.jpcb.5b07433.
Cho, I.-H., Park, D.-J., Bae, M.-S.(2015) Time Resolved Analysis of Water Soluble Organic Carbon by Aerosol-into-Mist System, Journal of Korean Society for Atmospheric Environment, 31, 497-507,(in Korean with English abstract), https://doi.org/10.5572/KOSAE.2015.31.
6.497.
Claeys, M., Szmigielski, R., Kourtchev, I., Van der Veken, P., Ver- meylen, R., Maenhaut, W., Jaoui, M., Kleindienst, T.E., Lewandowski, M., Offenberg, J.H., Edney, E.O.(2007) Hydroxydicarboxylic Acids: Markers for Secondary Org anic Aerosol from the Photooxidation of α-Pin- ene, Environmental Science & Technology, 41, 1628- 1634, https://doi.org/10.1021/es0620181.
Eisele, F., Davis, D., Helmig, D., Oltmans, S., Neff, W., Huey, G., Tan- ner, D., Chen, G., Crawford, J., Arimoto, R.(2008) Ant- arctic Tropospheric Chemistry Investigation(ANTCI) 2003 overview, Atmospheric Environment, 42, 2749- 2761, https://doi.org/10.1016/j.atmosenv.2007.04.
013.
Faber, J., Brodzik, K., Gołda-Kopek, A., Łomankiewicz, D.(2013) Benzene, toluene and xylenes levels in new and used vehicles of the same model, Journal of Environmen- tal Sciences, 25, 2324-2330, https://doi.org/10.1016/
S1001-0742(12)60333-7.
Feng, J., Li, M., Zhang, P., Gong, S., Zhong, M., Wu, M., Zheng, M., Chen, C., Wang, H., Lou, S.(2013) Investigation of the sources and seasonal variations of secondary organic aerosols in PM2.5 in Shanghai with organic tracers, Atmospheric Environment, 79, 614-622, https://doi.
org/10.1016/j.atmosenv.2013.07.022.
Feng, Z., Huang, M., Cai, S., Xu, X., Yang, Z., Zhao, W., Hu, C., Gu, X., Zhang, W. (2019) Characterization of single scattering albedo and chemical components of aged toluene secondary organic aerosol, Atmospheric Pollution Research, 10, 1736-1744, https://doi.org/10.1016/
j.apr.2019.07.005.
Golly, B., Waked, A., Weber, S., Samake, A., Jacob, V., Conil, S., Ran- gognio, J., Chrétien, E., Vagnot, M.-P., Robic, P.-Y., Besombes, J.-L., Jaffrezo, J.-L.(2019) Organic markers and OC source apportionment for seasonal varia- tions of PM2.5 at 5 rural sites in France, Atmospheric Environment, 198, 142-157, https://doi.org/10.1016/
j.atmosenv.2018.10.027.
Hong, Z., Zhang, H., Zhang, Y., Xu, L., Liu, T., Xiao, H., Hong, Y., Chen, J., Li, M., Deng, J., Wu, X., Hu, B., Chen, X.(2019) Secondary organic aerosol of PM2.5 in a mountainous forest area in southeastern China: Molecular compo- sitions and tracers implication, Science of The Total
Environment, 653, 496-503, https://doi.org/10.1016/
j.scitotenv.2018.10.370.
Jardine, K., Yañez-Serrano, A.M., Williams, J., Kunert, N., Jardine, A., Taylor, T., Abrell, L., Artaxo, P., Guenther, A., Hewitt, C.N., House, E., Florentino, A.P., Manzi, A., Higuchi, N., Kesselmeier, J., Behrendt, T., Veres, P.R., Derstroff, B., Fuentes, J.D., Martin, S.T., Andreae, M.O.(2015) Dimethyl sulfide in the Amazon rain forest: DMS in the Amazon, Global Biogeochemical Cycles, 29, 19- 32, https://doi.org/10.1002/2014GB004969.
Kettle, A.J., Andreae, M.O.(2000) Flux of dimethylsulfide from the oceans: A comparison of updated data sets and flux models, Journal of Geophysical Research: Atmo- spheres, 105, 26793-26808, https://doi.org/10.1029/
2000JD900252.
Kunwar, B., Torii, K., Zhu, C., Fu, P., Kawamura, K.(2016) Spring- time variations of organic and inorganic constituents in submicron aerosols(PM1.0) from Cape Hedo, Oki- nawa, Atmospheric Environment, 130, 84-94, https://
doi.org/10.1016/j.atmosenv.2015.09.002.
Lee, Y., Kim, E., Ryu, C., Oh, S.-H., Joo, H., Bae, M.-S.(2018) Rela- tionship between Cholesterol and Oxidative Poten- tial from Meat Cooking, Journal of Korean Society for Atmo spheric Environment, 34, 639-650,(in Korean with English abstract), https://doi.org/10.5572/
KOSAE.2018.34.5.639.
Legrand, M., Ducroz, F., Wagenbach, D., Mulvaney, R., Hall, J.
(1998) Ammonium in coastal Antarctic aerosol and snow: Role of polar ocean and penguin emissions, Journal of Geophysical Research: Atmospheres, 103, 11043-11056, https://doi.org/10.1029/97JD01976.
Li, L., Lai, W., Pu, J., Mo, H., Dai, D., Wu, G., Deng, S.(2018) Polar organic tracers in PM2.5 aerosols from an inland back- ground area in Southwest China: Correlations bet- ween secondary organic aerosol tracers and source apportionment, Journal of Environmental Sciences, 69, 281-293, https://doi.org/10.1016/j.jes.2017.06.002.
Liss, P.S., Lovelock, J.E.(2007) Climate change: the effect of DMS emissions, Environmental Chemistry, 4, 377, https://
doi.org/10.1071/EN07072.
Meskhidze, N., Nenes, A.(2006) Phytoplankton and Cloudiness in the Southern Ocean, Science, 314, 1419-1423, https://
doi.org/10.1126/science.1131779.
Nagy, K., Jakab, A., Pollreisz, F., Bongiorno, D., Ceraulo, L., Averna, M.R., Noto, D., Vékey, K.(2006) Analysis of sterols by high-performance liquid chromatography/mass spe- c trometry combined with chemometrics, Rapid Com- munications in Mass Spectrometry, 20, 2433-2440, https://doi.org/10.1002/rcm.2606.
Nguyen, D.L., Kawamura, K., Ono, K., Ram, S.S., Engling, G., Lee, C.-T., Chi, K.H., Sun, S.-A., Lin, N.-H., Chang, S.-C., Chuang, M.-T., Hsiao, T.-C., Sheu, G.-R., Ou Yang, C.-F.
(2016) Comprehensive PM2.5 Organic Molecular Composition and Stable Carbon Isotope Ratios at Sonla, Vietnam: Fingerprint of Biomass Burning Com- ponents, Aerosol and Air Quality Research, 16, 2618- 2634, https://doi.org/10.4209/aaqr.2015.07.0459.
Oh, S.-H., Park, E.-H., Yi, S.-M., Shon, Z.-H., Park, K., Bae, M.-S.
(2018) Contribution of Biomass Burning and Second- ary Organic Carbon to Water Soluble Organic Carbon at a Suburban Site, Journal of Korean Society for Atmospheric Environment, 34, 259-268,(in Korean with English abstract), https://doi.org/10.5572/
KOSAE.2018.34.2.259.
Perrone, M.R., Becagli, S., Garcia Orza, J.A., Vecchi, R., Dinoi, A., Udisti, R., Cabello, M.(2013) The impact of long-range- transport on PM1 and PM2.5 at a Central Mediterra- nean site, Atmospheric Environment, 71, 176-186, https://doi.org/10.1016/j.atmosenv.2013.02.006.
Scarratt, M., Levasseur, M., Michaud, S., Cantin, G., Gosselin, M., de Mora, S.(2002) Influence of phytoplankton taxo- nomic profile on the distribution of dimethylsulfide and dimethylsulfoniopropionate in the northwest Atlantic, Marine Ecology Progress Series, 244, 49-61, https://doi.org/10.3354/meps244049.
Shen, R., Liu, Z., Liu, Y., Wang, L., Li, D., Wang, Y., Wang, G., Bai, Y., Li, X.(2018) Typical polar organic aerosol tracers in PM2.5 over the North China Plain: Spatial distribution, seasonal variations, contribution and sources, Che- mosphere, 209, 758-766, https://doi.org/10.1016/j.
chemosphere.2018.06.133.
Wang, Y., Zhuang, G., Zhang, X., Huang, K., Xu, C., Tang, A., Chen, J., An, Z.(2006) The ion chemistry, seasonal cycle, and sources of PM2.5 and TSP aerosol in Shanghai, Atmo- spheric Environment, 40, 2935-2952, https://doi.
org/10.1016/j.atmosenv.2005.12.051.
Witkowski, B., Gierczak, T.(2014) Early stage composition of SOA produced by α-pinene/ozone reaction: α-Acyloxy- hydroperoxy aldehydes and acidic dimers, Atmo- spheric Environment, 95, 59-70, https://doi.org/10.
1016/j.atmosenv.2014.06.018.
Authors Information
이용민(국립목포대학교 환경공학과 석사연구원)
김은영(국립목포대학교 환경공학과 석사연구원)
오세호(국립기상과학원 환경기상연구과 연구원)
박민한(광주과학기술원 지구환경공학부 박사연구원)
정지효(광주과학기술원 지구환경공학부 박사급연구원)
이해범(광주과학기술원 지구환경공학부 박사연구원)
송한결(광주과학기술원 지구환경공학부 석사연구원)
곽노현(광주과학기술원 지구환경공학부 석사연구원)
이은비(광주과학기술원 지구환경공학부 석사연구원)
김경주(광주과학기술원 지구환경공학부 석사연구원)
박기홍(광주과학기술원 지구환경공학부 교수)
배민석(국립목포대학교 환경공학과 교수)