Microbial Community Structure of Paddy Soil Under Long-term Fertilizer Treatment Using Phospholipid Fatty Acid (PLFA) Analysis
Aileen Rose Daquiado, Tae Young Kim, Yong Bok Lee1*
Division of Applied Life Science, Gyeongsang National University, Jinju, 660-701, South Korea
1Institute of Agriculture and Life Science, Gyeongsang National University, Jinju, 660-701, South Korea
(Received: October 21 2013, Accepted: November 18 2013)
Understanding the microbial community structure of agricultural soils is important for better soil management in order to improve soil quality. Phospholipid fatty acid analysis has been popularly used in determining the microbial community structure in different ecosystems. The microbial community structure of paddy soil under long-term fertilizer treatments was investigated after 45 years using PLFA analysis. Treatments were control (no fertilization, Con), compost (COM), NPK, NPK+compost (NPKC), PK, NK, and NP. Soil chemical properties were mainly affected by the addition of compost and inorganic P fertilizer. Total nitrogen and organic matter contents were significantly higher in treatments with compost while available P2O5 and exchangeable calcium were significantly higher in treatments with added inorganic P fertilizer. It was found that microbial communities were responsive to the different fertilizer treatments. PLFA results showed that the soils were dominated by gram-negative bacteria, followed by the actinomycetes, then gram-positive bacteria, and fungi. Principal component analysis of the soil chemical properties and PLFA composition proved to be a more reliable tool because it was more responsive to the changes in soil chemical properties.
Key words: PLFA, Microbial community structure, Long-term fertilization
Principal component analysis of long-term fertilized paddy after 45 years using PLFA analysis.
1)
*Corresponding author : Phone: +82557721967, Fax: +82557721960, Email: [email protected]
§Acknowledgement: This study was supported by Rural Development Administration, Repulic of Korea (Project No. PJ906961).
Introduction
One of the key driving factors for sustainability is soil ecosystem - the critical component of the earth’s biosphere, functioning not only in the production of food and fiber but also in the maintenance of local, regional, and global environment quality (Kaur et al., 2005). Microorganisms in soils play a critical role in the various biogeochemical cycles, as well as being a particularly important component of plant and soil ecosystems (http://www.enviroliteracy.org/article.
php/317.html).
Several studies have demonstrated that soil biological and biochemical properties are highly affected by soil management systems. A shift in microbial community structure and higher microbial populations were observed in no-till cropping systems compared to soils under tillage (Doran, 1980). Zhong et al.
(2010) studied soils under different mineral and organic fertilizer regimen reported that total N, available P, and soil pH significantly affected microbial profiles and functional diversity. Cattle manure slurry application increased soil microbial biomass (Acea and Carballas, 1988). Cover crops significantly increased several enzyme activities relative to no cover in no-till corn (Mullen et al., 1998).
Therefore, agricultural management practices, particularly inputs of fertilizers, manure, and cover crops, can have large impacts on the size and activity of soil microbial communities (Bolton et al., 1985; Fraser et al., 1988; Powlson et al., 1987). Environmental conditions and perturbations are likely to affect population structures and their functions in soils which may in turn result in a change of overall soil properties (Widmer et al., 2000). Understanding the microbial ecology of soil is increasingly recognized as important for the restoration and sustainability of ecosystems (Steenwerth et al., 2002; Potthoff et al., 2006).
Soil microbial parameters are probably the earliest indicators of soil quality used. Therefore, the quantitative description of microbial diversity in soils has become a topic of great interest, but remains as one of the most difficult challenges faced by microbial ecologists (Zelles, 1999).
Phospholipid fatty acids are major constituents of the mem- branes of all living cells, and different groups of mic- roorganisms contain specific types of PLFA biomarkers (Frostegard et al., 1991). Phospholipids are rapidly degraded by endogenous and exogenous phospholipases upon cell death, which makes them reliable measure of viable cell biomass (White et al., 1979). Under the conditions expected in naturally occurring communities, phospholipids make up a relatively constant proportion of the biomass of organisms (Lechevalier, 1989). The analysis of PLFA profile provides a rapid and inexpensive way of characterizing microbial community structures (Cavigelli et. al., 1995). With this approach, the total soil PLFA-fraction is obtained and
quantitatively analyzed by gas chromatography (GC) and mass spectrometry (MS) (Zelles and Bai, 1993; Lackzo et al., 1997). Comparison of the data with information in a fatty acids database (Lackzo et al., 1997) allows identification of the extracted PLFAs. The advantage of using the PLFA method is that it is very sensitive in the sense that PLFAs are specific to the group they represent, and they can be used for the quantification of relative bacterial abundance.
However, this method can be problematic due to its lack of complete database, it is labor intensive, it requires the use of special instruments (Huang et al., 2011), and it is incapable of identifying microorganisms up to the species level, and thus cannot be used for phylogenetic characterization (Frostegard, 2010).
This study aimed to characterize microbial composition and community structure of paddy soil under different fer- tilization treatments for 45 years using PLFA analysis.
Materials and Methods
Experimental site and soil sampling The experiment site, located at the Department of Functional Cereal Crop Research Farm, Miryang (36°36’N; 128°45’E; 12 m elev.) in the southeast part of Korea, was established in 1967 and has soil belonging to the Pyeongtaeg series (somewhat poorly drained, fine silty mixed mesic, Typic Haplaquepts).
Seven fertilization treatments were arranged within a randomized complete block design with three replications. Each plot had a size of 10 m × 10 m. Fertilization treatments were as follows: control (no fertilization; Con), compost (COM), NPK, NPK + compost (NPKC), PK, NK, and NP. For treatments with inorganic fertilizer input, Nitrogen (N), phosphate (P2O5, P), and potassium (K2O, K) were applied at a rate of 120 kg ha-1, 80 kg ha-1 and 80 kg ha-1, respectively during 1967-1972 whereas 150 kg ha-1, 100 kg ha-1 and 100 kg ha-1, respectively were applied from 1973 onwards using urea, super phosphate, and potassium chloride. Straw compost that was mixed with cattle manure and composted outdoor for more than six months, was applied annually at a rate of 10 Mg ha-1 for plots treated with compost and NPK + compost. In 2007, the straw compost used had mean values of 431, 19.8, 5.2, and 29.1 g kg-1 of total C, N, P, and K, respectively. Prior to tillage before rice transplanting, inorganic fertilizers and manure were broadcast by hand on the surface of plots using such treatments. Soil samples were taken using a sampling auger from the Ap horizon (0-15 cm depth. For this study, samples were taken in April 2012, before fertilizer application for the next cropping season.
Soil analyses Soil samples intended for chemical analyses were air-dried, powderized, and passed through a 2-mm
sieve. The pH and EC were measured by first mixing the soil samples with distilled water at a 1:5 (soil:water) ratio.
Total nitrogen (T-N) content was analyzed by Kjeldahl method, organic matter content (OM) by Tyurin method, average P2O5 was assessed using the Lancaster method, and cations Na, Mg, K, and Ca were extracted using ammonium acetate (pH 7) and measured by inductively coupled plasma mass spectrometry (ICP-MS) (RDA,1988). Samples for micro- biological analyses were stored at -80°C until use.
Molecular analysis of soil PLFA Extraction and analysis of PLFAs were performed according to the method of Frostegard et al. (1991). Sample amounts are in dry weight basis. Two grams of each sample was weighed and placed into 35 mL glass centrifuge tubes. Up to 1.5 mL of citrate buffer (pH 4) was added to each sample, then 1.9 mL of chloroform, 3.8 mL methanol, and 2 mL Bligh and Dyer reagent were also added, and then mixed with a vortex.
The samples were then left for two hours in the dark, with vortexing every 20 minutes. At the end of extraction, the samples were vortexed once more and then centrifuged at 3000 rpm for 20 minutes. The supernatant was transferred into a new 35 mL glass centrifuge tube and the pellet was re-extracted with 2.5 mL Bligh and Dyer reagent and was then incubated again for two hours with vortexing every 20 minutes. At the end of extraction, the samples were vortexed once more and then centrifuged at 3000 rpm for 20 minutes. The supernatants of each sample were then combined.
The organic and aqueous phases were separated by adding 3.1 mL chloroform and 3.1 mL citrate buffer to the combined supernatants. The samples were then vortexed for at least 30 seconds and centrifuged at 2500 rpm for 10 minutes. Using a Pasteur pipette, 3 mL of the lower (organic) phase was removed and transferred to a 10 mL glass test tube and dried down under nitrogen at 40°C.
Test tubes were stored at -20°C until the next step.
Silica columns (SUPELCO, Pennsylvania, USA) were activated by adding 1 mL of chloroform twice. The dried samples were reconstituted in 300 µL chloroform and applied to the columns using a Pasteur pipette. The sample containers were rinsed with 500 µL chloroform twice, and these washes were also applied to the column. Neutral lipids were eluted with 3 mL chloroform twice, then the glycolipids with 3 mL acetone twice, and the phospholipids with 3 mL methanol twice. The first two eluates (neutral lipids and glycolipids) were discarded. The methanol (phospholipid) eluate was collected in separate 10 mL glass centrifuge tubes and dried down under nitrogen at 40°C.
One milliliter of methanol-toluene solution (1:1, v/v) was added to each sample, then 1 mL of 0.2 M methanolic KOH was also added and the samples were incubated for 15
min at 37°C in a water bath. Methanolysis was stopped by adding 2 mL hexane-chloroform solution (4:1, v/v), 0.3 mL 1 M acetic acid, and 2 mL demineralized water. This was then mixed by vortexing, followed by centrifugation at 2500 rpm for 5 min. A Pasteur pipette was then used to transfer the upper (organic) phase into a new 10 mL glass test tube. The residual aqueous phase was re-extracted with 2 mL hexane-chloroform solution, vortexed, centrifuged, and the upper organic phase was removed and combined in the appropriate glass test tube. The organic phase was dried down under nitrogen at 40°C. The sample was then dissolved in 170 µL hexane/MTBE (1:1, v/v) and 30 µL of 0.01 M methylnonadecanoate (C19:0) as internal standard solution.
The extracted fatty acid methyl esters (FAMEs) were analyzed with a Hewlett-Packard gas chromatograph (HP, USA). Identification and quantification of FlEs were conducted according to the MIDI software using MIDI microbial calibration standards (Microbial ID, Inc., Newark, DE, USA).
The concentration of each PLFA present in the samples was calculated using the following formula:
where C is the concentration of the fatty acid methyl ester (FAME) in nmol/g; FFM is the area of the phospholipid methylester; CIS is the concentration of the internal standard in µg; 2 is a variable factor (if 3 mL was taken from 6 mL organic phase in the step of the phase separation after the extraction of PLFAs); 1000 is the factor to obtain nmol;
100 is the dry weight factor; EW is the weight of the soil in g; TS is the dry matter of the soil; FIS is the area of the internal standard; and MGFM is the molecular weight of the phospholipid methylester in µg/µmol.
The fatty acid nomenclature used is as follows: total number of carbon atoms:number of double bonds, followed by the position of the double bond from the methyl end of the molecule. Cis and trans geometry are indicated by the suffixes c and t. The branching is indicated as iso or anteiso, 10 Me indicates a methyl group on the tenth carbon atom from the carboxyl end of the molecule, position of hydroxyl (OH) groups are noted, and cyclo indicates cyclopropane fatty acids. The lipid biomarkers used to represent the different microbial groups are presented in Table 1.
Statistical analysis Statistical analyses were performed using SAS software version 9.1 (SAS Institute Inc., 2001).
The soil chemical properties, total biomass, and PLFA concentrations were subjected to the analysis of variance and regression. Duncan’s multiple range test (DMRT) was calculated at the 0.05 probability level for making treatment
Table 1. Marker fatty acids of selected microbial groups.
Microbial group Lipid biomarker References
Gram-negative bacteria
14:0, 16:1w7c/15 iso 2OH, 16:1w5c, 16:0, Anteiso 17:1w9c, 17:1w8c, 17:0 cyclo, 16:1 2OH, 18:1w9c, 18:1w7c, 18:0, 19:0 cyclo w8c, 20:4 w6,9,12,15c, 20:1w9c
Zelles, 1999a; Zelles, 1999b;
Cavigelli et al., 1995 Gram-positive bacteria 14:0 iso, 15:0 iso, 15:0 ante, 15:0, 16:0 iso, 17:0 iso, 17:0 ante, 17:0 Zelles, 1999a; Zelles, 1999b;
Pennanen et al., 1998 Actinomycetes 16:0 10 Me, 17:0 10 Me, TBSA 10 Me 18:0, 19:0 10 Me Frostegard, et al., 1993 Fungi 18:3w6c (6,9,12), 18:2 w6,9c/18:0 ante, 20:0 Frostegard, et al., 1993
Table 2. Chemical properties of paddy soil as affected by different fertilizer treatments.
Treat-ment pH (1:5) EC (dS/m) T-N (g/kg) OM (g/kg) Av. P2O5 (mg/kg) Exchangeable Cations (cmol+/kg)
Ca Mg K
Con 5.0a 0.11a 1.8b 15.9d 79.4d 3.9bc 0.80d 0.07f
PK 5.4a 0.13a 1.8b 16.8cd 238.2b 4.4bc 1.07abc 0.19c
NK 5.0a 0.10a 1.7b 16.6cd 61.1d 3.7c 0.73d 0.15d
NP 5.2a 0.10a 1.8b 17.2c 210.7b 4.4bc 0.98bcd 0.08ef
NPK 5.3a 0.09a 1.8b 17.1c 210.7b 4.6b 1.09ab 0.11de
COM 5.1a 0.09a 2.3a 20.5b 125.2c 4.5bc 0.83cd 0.31b
NPKC 5.4a 0.09a 2.4a 22.8a 280.9a 5.7a 1.26a 0.36a
Means with the same letter in each column are not significantly different from each other according to Duncan’s Multiple Range Test at 5 % level.
Fig. 1. Principal component analysis of soil chemical properties of long-term fertilized paddy after 45 years.
mean comparisons. To determine the effects of long-term fertilization on the chemical properties and microbial community structure of paddy soil, principal component analysis (PCA) was performed on the data sets of the soil chemical properties and PLFA analysis results using the PC-ORD v.4 software.
Graphs were generated through SigmaPlot software version 12 (Systat Software Inc., 2012).
Results
Soil chemical properties The chemical properties of paddy soil under different fertilizer treatments for 45 years (1967~2012) are presented in Table 2. Results showed that the total nitrogen (T-N) and organic matter (OM) content were significantly increased by the addition of compost. The available P2O5 concentrations were significantly higher in treatments with inorganic phosphate fertilizer (PK, NP, NPK, and NPKC). The said treatments also had high pH, although they were not significantly higher than that of the control.
The exchangeable calcium concentrations were also noticeably high in treatments with inorganic phosphate fertilizer application.
The addition of inorganic N did not affect the T-N content of the soils.
These results were reflected in the principal component analysis (PCA) wherein T-N and O.M. were correlated with compost application and P2O5 was influenced only by inorganic P application (Fig. 1). The application of inorganic N and
K only did not change soil chemical properties. A high percent of variance (97.1%) indicates that both PC1 (Axis 1) and PC (Axis 2) account for the majority of the factors or information which elicited the resulting graph. As shown in the figure, treatments with added inorganic phosphate fertilizer (NP, NPK, and PK) displayed somewhat similar properties and affected available P2O5 concentration. The addition of compost, on the other hand, highly affected the total nitrogen and organic matter contents of the soil.
Table 3. Microbial biomass obtained from long-term fertilized paddy after 45 years using different methods.
Total PLFA (nmol g-1)
Con 587b
PK 696b
NK 543b
NP 686b
NPK 593b
COM 881a
NPKC 866a
Means with the same letter in each column are not significantly different from each other according to Duncan’s Multiple Range Test at 5 % level.
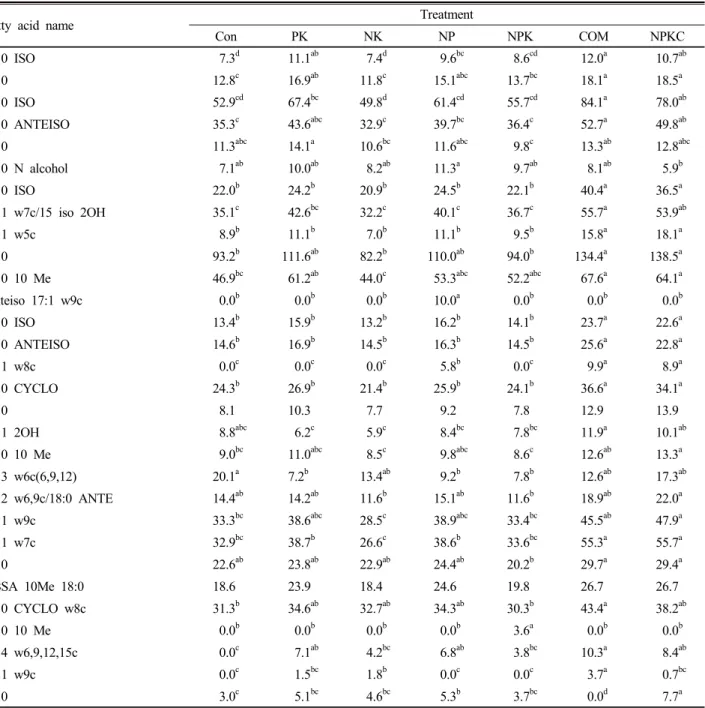
Table 4. Fatty acids extracted from paddy soil under different fertilizer treatments for 45 years.
Fatty acid name Treatment
Con PK NK NP NPK COM NPKC
14:0 ISO 7.3d 11.1ab 7.4d 9.6bc 8.6cd 12.0a 10.7ab
14:0 12.8c 16.9ab 11.8c 15.1abc 13.7bc 18.1a 18.5a
15:0 ISO 52.9cd 67.4bc 49.8d 61.4cd 55.7cd 84.1a 78.0ab
15:0 ANTEISO 35.3c 43.6abc 32.9c 39.7bc 36.4c 52.7a 49.8ab
15:0 11.3abc 14.1a 10.6bc 11.6abc 9.8c 13.3ab 12.8abc
16:0 N alcohol 7.1ab 10.0ab 8.2ab 11.3a 9.7ab 8.1ab 5.9b
16:0 ISO 22.0b 24.2b 20.9b 24.5b 22.1b 40.4a 36.5a
16:1 w7c/15 iso 2OH 35.1c 42.6bc 32.2c 40.1c 36.7c 55.7a 53.9ab
16:1 w5c 8.9b 11.1b 7.0b 11.1b 9.5b 15.8a 18.1a
16:0 93.2b 111.6ab 82.2b 110.0ab 94.0b 134.4a 138.5a
16:0 10 Me 46.9bc 61.2ab 44.0c 53.3abc 52.2abc 67.6a 64.1a Anteiso 17:1 w9c 0.0b 0.0b 0.0b 10.0a 0.0b 0.0b 0.0b
17:0 ISO 13.4b 15.9b 13.2b 16.2b 14.1b 23.7a 22.6a
17:0 ANTEISO 14.6b 16.9b 14.5b 16.3b 14.5b 25.6a 22.8a
17:1 w8c 0.0c 0.0c 0.0c 5.8b 0.0c 9.9a 8.9a
17:0 CYCLO 24.3b 26.9b 21.4b 25.9b 24.1b 36.6a 34.1a
17:0 8.1 10.3 7.7 9.2 7.8 12.9 13.9
16:1 2OH 8.8abc 6.2c 5.9c 8.4bc 7.8bc 11.9a 10.1ab 17:0 10 Me 9.0bc 11.0abc 8.5c 9.8abc 8.6c 12.6ab 13.3a 18:3 w6c(6,9,12) 20.1a 7.2b 13.4ab 9.2b 7.8b 12.6ab 17.3ab 18:2 w6,9c/18:0 ANTE 14.4ab 14.2ab 11.6b 15.1ab 11.6b 18.9ab 22.0a
18:1 w9c 33.3bc 38.6abc 28.5c 38.9abc 33.4bc 45.5ab 47.9a
18:1 w7c 32.9bc 38.7b 26.6c 38.6b 33.6bc 55.3a 55.7a
18:0 22.6ab 23.8ab 22.9ab 24.4ab 20.2b 29.7a 29.4a
TBSA 10Me 18:0 18.6 23.9 18.4 24.6 19.8 26.7 26.7
19:0 CYCLO w8c 31.3b 34.6ab 32.7ab 34.3ab 30.3b 43.4a 38.2ab 19:0 10 Me 0.0b 0.0b 0.0b 0.0b 3.6a 0.0b 0.0b 20:4 w6,9,12,15c 0.0c 7.1ab 4.2bc 6.8ab 3.8bc 10.3a 8.4ab 20:1 w9c 0.0c 1.5bc 1.8b 0.0c 0.0c 3.7a 0.7bc
20:0 3.0c 5.1bc 4.6bc 5.3b 3.7bc 0.0d 7.7a
Means with the same letter in each row are not significantly different from each other according to Duncan’s Multiple Range Test at 5 % level.
Microbial biomass The microbial biomass in each treatment is shown in Table 3. The COM and NPKC treatments obtained the two highest values. This was then zfollowed by PK, NP, NPK, and control. The NK-treated soil obtained the lowest biomass among all the trealnts used. Although not significantly different, treatments with added P (compost also has P) had slightly higher microbial biomass than those without P addition.
Microbial composition A total of 30 different PLFAs were quantified and used for data analysis (Table 4). The control was represented by 25 individual fatty acids, PK,
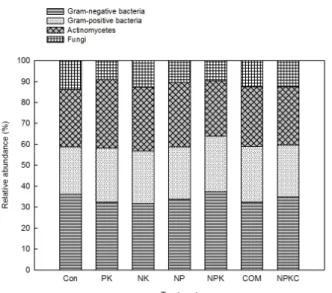
Fig. 2. Bacterial composition of long-term fertilized paddy after 45 years using PLFA analysis.
Fig. 3. Principal component analysis of long-term fertilized paddy after 45 years using PLFA analysis.
NK, NPK, and COM treatments each had 27 fatty acids, and both NP and NPKC treatments had 28 each. PK- and NK-treated soils were contained the same PLFAs. All fatty acids found in the COM treatment were also present in the NPKC treatment. The most abundant PLFA was 16:0, which is a bioindicator of gram-negative bacteria. This was followed by 15:0 ISO and 16:0 10 Me, which are bioindicators of gram-positive bacteria and actinomycetes, respectively. The PLFAs Anteiso 17:1w9c and 19:0 10 Me were unique to NP- and NPK-treated soils, respectively. The PLFAs 16:0 10 Me, 17:0 10 Me, and TBSA 10Me 18:0, which are bioindicators for actinomycetes, were found in high amounts especially in the COM and NPKC treatments. The source of the PLFA 16:0 N alcohol, which was detected in all samples, is not yet known.
Fig. 2 shows the microbial composition of the different soil samples through PLFA analysis. Results showed that gram-negative bacteria, as identified by 14:0, 16:1w7c/15 iso 2OH, 16:1w5c, 16:0, Anteiso 17:1w9c, 17:1w8c, 17:0 cyclo, 16:1 2OH, 18:1w9c, 18:1w7c, 18:0, 19:0 cyclo w8c, 20:4 w6,9,12,15c, and 20:1w9c, were the most abundant in all treatments (31.6-37.4%). This was followed by the actinomycetes with 26.4-32.7%, as identified by 16:0 10 Me, 17:0 10 Me, TBSA 10 Me 18:0, and 19:0 10 Me;
then gram-positive bacteria with 22.7-26.5%, as identified by 14:0 iso, 15:0 iso, 15:0 ante, 15:0, 16:0 iso, 17:0 iso, 17:0 ante, and 17:0; and fungi with 9.0-13.8%, as identified by 18:3w6c (6,9,12), 18:2 w6,9c/18:0 ante, and 20:0.
Gram-negative bacteria had the highest relative abundance in NPK-treated soil and the lowest in NK-treated soil.
Gram-positive bacteria had the highest relative abundance in NPK- and COM-treated soils and the lowest in the control. The actinomycetes had the highest relative abundance in PK-treated soil and the lowest in NPK-treated soil. Lastly,
the fungal group had the highest relative abundance in the control and the lowest in PK-treated soil.
Microbial community structure The microbial com- munity structure present in paddy soil under different treatments for 45 years was also analyzed through PCA. For PLFAs, PCA showed the same trend as in soil chemical properties (Fig. 3) wherein COM and NPKC were grouped together;
PK, NP, and NPK were also grouped together; and NK grouped with the control. It also showed that most of the PLFA biomarkers grouped together in the same quadrant as the COM and NPKC treatments. The 82.0% of variance illustrates that PC1 and PC2 (Axis 1 and Axis 2, respectively) account for majority of the factors which brought out the resulting graph.
Discussion
Soil chemical properties The application of compost greatly increased the levels of total carbon and total nitrogen.
This is in line with other studies that have reported higher total nitrogen and organic carbon levels in soil following compost application (Ros et al., 2006; Sarwar et al., 2008;
and Bouajila and Sanaa, 2011). The addition of inorganic phosphate fertilizer increased available P concentration due to the accumulation of phosphates in soil and its recovery from soils was aided by the addition of organic matter (compost) (Wandruszka, 2006). The pH and exchangeable calcium was increased by the CaO present in the superphosphate fertilizer.
Principal component analysis revealed three groupings among the treatments which were influenced by the addition of different fertilizers: (1) COM and NPKC – affected by compost addition; (2) NP, NPK, and PK – influenced by inorganic phosphate fertilizer addition; and (3) NK, which grouped with the control, indicating that the addition of
inorganic N and K fertilizers alone had no significant effect on soil properties.
Microbial biomass Treatments with compost applications had the highest number of microbial biomass. The addition of compost increases microbial biomass in soil (Arslan et al., 2008; and Turk and Mihelič, 2013). The third highest up to the fifth highest number of microbial biomass were treatments with added phosphorus. A study by Liu et al.
(2011) showed that the addition of P significantly increased the microbial biomass a forest soil. There was also a significant increase in soil respiration after P addition, suggesting that P availability is one of the limiting factors for microbial growth.
Because PLFAs are rapidly degraded after cell death and are not found in storage products, the concentration of total PLFA provides quantitative insight into the viable or active microbial biomass present (Kaur et al., 2005). In this regard, PLFA analysis is a great tool in measuring microbial biomass in a given sample.
Microbial composition and community structure Bio- geochemical cycles, the turnover processes of organic matter, and the fertility and quality of soils are largely determined by the composition and activity of soil microbial com- munities (Zelles, 1999). Hence, the biological health of soil ecosystem has considerable potential as indicator of ecosystem health, which can be of use in environmental diagnosis. The indicators used for monitoring the state of the environment should be able to reflect the structure and function of ecosystem processes sensitive to variations in management and climate, reproducible, easily measurable and applicable from local to national scale (Kaur, et al., 2005).
Phospholipid fatty acid analysis has been widely used to study microbial community composition and structure (Ferré et al., 2012). Aside from accounting for a larger proportion of the soil microbial community which gives this method an advantage over culture-based methods, PLFAs are also useful biomarkers for fingerprinting the soil microbial community because of certain PLFAs that are specific to a group of microorganisms. However, PLFA analysis also has its limitations. This includes its inability to reveal any information at the species-level, archae bacteria cannot be detected using this method, and databases for the interpretation of biomarkers are centered on fatty acids of microorganisms from pure cultures (Kaur, et al., 2005).
The most abundant PLFA in all the samples was 16:0, which is a bioindicator of gram-negative bacteria. This was followed by 15:0 ISO and 16:0 10 Me, which are bioindicators of gram-positive bacteria and actinomycetes, respectively. The PLFAs Anteiso 17:1w9c and 19:0 10 Me were unique to NP- and NPK-treated soils, respectively.
The PLFAs 16:0 10Me, 17:0 10Me, and TBSA 10 Me 18:0, which are bioindicators for actinomycetes, were found in high amounts especially in the COM and NPKC treatments.
In terms of microbial community structure, principal component analysis of the PLFAs showed the same trend as in soil chemical properties wherein COM and NPKC were grouped together; PK, NP, and NPK were also grouped together; and NK grouped with the control. It also showed that most of the PLFA biomarkers grouped together in the same quadrant as the COM and NPKC treatments, indicating that the presence of such PLFAs was highly influenced by compost application.
Conclusions
Microorganisms are the driving force of many processes in ecosystems, including biogeochemical cycling, the turnover processes of organic matter, and they influence the fertility and quality of soils. Thus, understanding the microbial ecology of soil is essential for the restoration and sustainability of ecosystems. Soil chemical properties were mainly affected by compost and inorganic P fertilizer application. Treatments with compost had significantly higher T-N and OM contents.
Treatments with inorganic P fertilizer had significantly higher available P2O5 and exchangeable calcium concentrations, and noticeably higher pH although the difference was not significant when compared to other treatments. In terms of microbial community structure, principal component analysis of the data sets showed that the soil chemical properties and PLFA analysis were very similar – COM and NPKC grouped together, PK, NP, and NPK grouped together, and NK and Con grouped together. Because PLFA profiles changed along with the soil chemical properties, this would therefore indicate that PLFA analysis is a dependable tool for the detection of changes in microbial community structures of environmental samples. As stated by Zelles (1999), soil microbial parameters are probably the earliest indicators of soil quality.
References
Acea, M.J. and T. Carballas. 1988. The influence of cattle slurry on soil microbial population and nitrogen cycle microorganisms.
Biological Wastes 23:229-241.
Arslan, E.I., E. Öbek, S. Kirbağ, U. İpek, and M. Topal. 2008.
Determination of the effect of compost on soil microor- ganisms. International Journal of Science and Technology 3(20):151-159.
Bolton, J., L.F. Elliot, P.R. Papendick, and D.F. Bezdicek. 1985.
Soil microbial biomass and selected soil enzyme activities;
effect of fertilization and cropping practices. Soil Biology and Biochemistry 17:297-302.
Bouajila, K. and M. Sanaa. 2011. Effects of organic amendments on soil physic-chemical and biological properties. Journal of Materials and Environmental Science 2(S1):485-490.
Cavigelli, M.A., G.P. Robertson, and M.J. Klug. 1995. Fatty acid methyl ester (FAME) profiles as measures of soil microbial community structure. Plant and Soil 170:99-113.
Doran, J.W. 1980. Soil microbial and biochemical changes associated with reduced tillage. Soil Science Society of America Journal 44:764-771.
Environmental Literacy Council. Microorganisms. http://www.
enviroliteracy.org/article.Php/ 317 .html.
Ferré, C., S. Zechmeister-Boltenstern, R. Comolli, M. Andersson, and G. Seufert. 2012. Soil microbial community structure in a rice paddy field and its relationships to CH4 and N2O fluxes.
Nutrient Cycling in Agroecosystems 93:35-50.
Fraser, D.G., J.W. Doran, W.W. Sahs, and G.W. Lesoin. 1988.
Soil microbial populations and activities under conventional and organic management. Journal of Environmental Quality 17:585-590.
Frostegard, A., A. Tunlid, and E. Baath. 1991. Microbial biomass measured as a total lipid phosphate in soils of different organic content. Journal of Microbiological Methods 14:151-163.
Frostegard, A., A. Tunlid, and E. Baath. 2010. Use and misuse of PLFA measurements in sois. Soil Biology and Biochemistry 1-5.
Kaur, A., A. Chaudhary, A. Kaur, R. Choudhary, and R. Kaushik.
2005. Phospholipid fatty acid – a bioindicator of environment monitoring and assessment in soil ecosystem. Current Science 89(7):1103-1112.
Lackzo, E., A. Rudaz, and M. Aragno. 1997. Diversity of antropogenically influenced or disturbed soil microbial com- munities. p. 54-67. In: Insam, H. and A. Rangger (eds.).
Microbial Communities - Functional versus Structural Approaches.
Springer Verlag, Heidelberg.
Lechevalier, M. P. 1989. Lipids in bacterial taxonomy. p.
455-561. In: O’Leary, W. M. (ed.). Practical Handbook of Microbiology. CRC, Boca Raton, Florida.
Liu, L., P. Gunderson, T. Zhang, and J. Mo. 2011. Effects of phosphorus addition on soil microbial biomass and community composition in three forest types in tropical China. Soil Biology and Biochemistry 44:31-38.
Mullen, M.D., C.G. Melhorn, D.D. Tyler, and B.N. Duck. 1998.
Biological and biochemical soil properties in no-till corn with different cover crops. Journal of Soil and Water Conservation 53(3):219-224.
Powlson, D.S., P.C., Brookes, and B.T. Christensen. 1987.
Measurement of soil microbial biomass provides an early indication of changes in total soil organic matter due to straw incorporation. Soil Biology and Biochemistry 19:159-164.
Potthoff, M., K.L. Steenwerth, L.E. Jackson, R.E. Drenovsky,
K.M. Scow, and R.G. Joergensen. 2006. Soil microbial community composition as affected by restoration practices in California grassland. Soil Biology and Biochemistry 38:
1851-1860.
RDA (Rural Development Administration, Korea) (1988) Method of Soil Chemical Analysis. National Institute of Agricultural Science and Technology, Suwon, Korea.
Ros, M., S. Klammer, B. Knapp, K. Aichberger, and H. Insam.
2006. Long-term effects of compost amendment of soil on functional and structural diversity and microbial activity. Soil Use and Management 22:209-218.
Sarwar, G., H. Schmeisky, N. Hussain, S. Muhammad, M.
Ibrahim, and E. Safdar. 2008. Improvement of soil physical and chemical properties with compost application in rice- wheat cropping system. Pakistan Journal of Botany 40(1):
275-282.
Steenwerth, K.L., L.E. Jackson, F.J. Calderon, M.R. Stromberg, and K.M. Scow. 2002. Soil microbial community composition and land use history in cultivated and grassland ecosystems of coastal California. Soil Biology and Biochemistry 34:1599-1611.
Turk, A. and R. Mihelič. 2013. Wheat straw decomposition, N-mineralization and microbial biomass after 5 years of conservation tillage in Gleysol field. Acta Agriculturae Slovenica 101(1):69-75.
Wandruszka, R. V. 2006. Phosphorus retenction in calcareous soils and the effect of organic matter on its mobility.
Geochemical Transactions 7:6.
White, D.C., R.J. Bobbie, J.S. Heron, J.D. King, and S.J.
Morrison. 1979. Biochemical measurements of microbial mass and activity from environmental samples. p. 69-81. In: Costerton, J.W. and R.R. Colwell (eds). Native Aquatic Bacteria:
Enumeration, Activity, and Ecology, ASTM STP 695.
American Society for Testing and Materials, Philadelphia, PA.
Widmer, F., A. Flieβbach, E. Laczkó, J. Schulze-Aurich, and J.
Zeyer. 2001. Assessing soil biological characteristics: a comparison of bulk soil community DNA-, PLFA-, and Biolog
™-analyses. Soil Biology and Biochemistry 33:1029-1036.
Zelles, L. 1999. Fatty acid patterns of phospholipids and lipopolysaccharides in the characterization of microbial communities in soil: a review. Biology and Fertility of Soils 29:111-129.
Zelles, L. and Q.Y. Bai. 1993. Fractionation of fatty acids derived from soil lipids by solid phase extraction and their quantitative analysis by GC-MS. Soil Biology and Biochemistry 24:317-323.
Zhong, W., T. Gu, W. Wang, B. Zhang, X. Lin, Q. Huang, and W.
Shen. 2010. The effects of mineral fertilizer and organic manure on microbial community and diversity. Plant and Soil 326:511-522.