balances, field-or surface-balances, and system balances.
Farm-gate balances account for external flows to and from the farm, such as purchased fertilizers, feed and sold animal and crop products. Field balances consider inputs through fertilizers, organic matter addition, and atmospheric deposition, and outputs via crop off-take, surface run-off and leaching. System balances include more detailed information related to inputs, outputs and pools including internal nutrient flows and losses (Modin-Edman et al., 2007). Therefore, farm-gate nutrient balances provide information that differs from field balances or systems balances. A studyby Öborn et al.(2005), for example, found the average farm-gate K balance of -1 kg ha
-1yr
-1whereas the field K balance was -21 kg ha
-1yr
-1. The difference was caused by accounting as nutrient output of, for example, crop residue removal from field for animal feed in the samefarm. At farm scale, these nutrients are not considered as removal.
Andriest-Rangel et al.(2007) from a 18 year experiment found K field balance varied from -21 to -60 kg K ha
-1year
-1under the conventional fertilization system and from -22 to -75kg K ha
-1year
-1under organic matter fertilization. This indicates that the management systems rely upon soil reserve K. On the other hand, Khai et al. (2007) in an agricultural system in peri-urban areas of Hanoi found N surplus ranging from 85 to 882 kg ha
-1year
-1, while for P and K the surplus were 109 to 196 and 20 to 306 kg ha
-1year
-1, respectively, implying a high risk for nutrients accumulation and associated transfers throughthefoodchain.
Losses of nutrients from farming systems are determined by the amount of nutrients removed in product, leaching, atmospheric losses, and immobilization of nutrients into the soil. The magnitude of inputs of nutrients will depend on the fertilizer applied, atmospheric input or nutrients released from the soil (Condron et al. 2000).
The practices of soil management under organic farming systems so far in Indonesia and elsewhere are mostly based on trials, errors and perceptions on the effectiveness of various nutrient sources. We observed that sometimes farmers applied so many combinations of organic matter sources that presumably gave no effects on crop yield. Scientific explanation is lacking in terms of comparative advantage in agronomic sense and nutrient balance under organic farming systems. The objectives of this research were to evaluate the effects of organic matter application on N, P and K balances, soil N, P and
K status and vegetable crop production under organic farming system.
MATERIALS AND METHODS
This research was conducted in Cimahi, West Java Province of Indonesia (06
˚47' 55" N, 107
˚33' 05" S;
1250 m asl) on a Eutric Hapludand (Soil Survey Staff, 2003) in five cropping seasons from 2005 to 2007. Prior to this experiment, the area was used for many years for elephant grass (Pennisetum purpureum) fodder system.
The elephant grass was cleared in June 2005 by plowing and removing the stumps and roots.
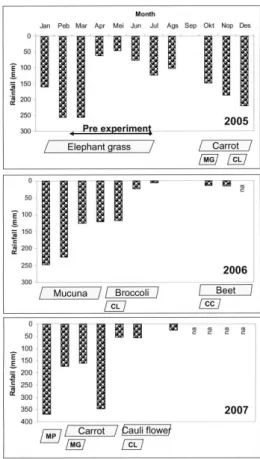
Cropping Pattern The cropping pattern and monthly rainfall distribution (data obtained from the sub-district meteorological station located about 5 km from the research site) are presented in Figure 1. Mustard green (Brassica rugosa Prain) and carrot (Daucus carrota) were planted in an intercropping arrangement in early Oct. 2005. The mustard green was harvested 1 month after planting in Nov. 2005, and it was replaced by
Fig. 1. Cropping pattern and rainfall distribution for the three year experiment of vegetable crops under different kinds and rates of organic matter in Cimahi, West Java, Indonesia. na = data not available; MG = Mustard green; CL = Chinese lettuce; CC = Chinese cabbage; MP = Mucuna.
Chinese lettuce (Brassica chinensis L.). Both the Chinese lettuce and Carrot were harvested in Jan. 2006.
Mucuna (Mucuna pruriens) as a cover crop was planted in Jan. 2006 on all plots using seeds planted at 30 cm by 30 cm distance. In Apr. 2006 the Mucuna was cut at ground level, chopped into 15-20 cm pieces and was incorporated as green manure into the 0-20 cm layer of the respective plots.
Broccoli (Brassica oleraceae var. botrytis L.), intercropped with Chinese lettuce, were planted in May 2006. The second crops, Beet (Beta vulgaris) intercropped with Chinese cabbage (Brassica chinensis L.), were planted in Sep. 2006. The beet was harvested in Dec. 2006.
Mucuna was immediately planted on all plots following the beet harvest and was harvested in Feb 2007 and treated the same way as that in the previous year.
In 2007, carrot intercropped with mustard green were planted in Feb. and harvested in May. The last crop for this experiment, Cauli flower (Brassica oleraceae var.
botrytis L.), intercropped with Chinese lettuce, was planted in May. Chinese lettuce was harvested in June while Cauli flower was harvested in Aug. 2007.
Plant spacing for Carrot was 60 cm x 20 cm, for Broccoli, Cauli flower and Beet was 60 cm x 40 cm while for Mustard Green and Chinese Lettuce it was 20 cm x 20 cm and for Chinese cabbage it was 30 cm x 40 cm. Plant arrangement for carrot intercropped with mustard green and for Beet intercropped with Chinese lettuce is schematically depicted in Figure 2.
Sources of Organic Matter and Composting Processes Cattle (CBM), goat (GBM), horse (HBM) and chicken (ChBM) barnyard manures were obtained from the surrounding farms. Tithonia diversifolia green manure (TGM) is the cuttings of the greener and leafy plant parts of Tithonia obtained from the nearby farms.
This cutting was chopped into about 10 cm materials.
The 10 cm long chopping were also used for Tithonia compost (TC). Plant residue (PR) was made from equal fresh weight of bean, carrot and broccoli plant residues, chopped into about 10 cm long material, mixed and composted.
The composting was conducted in a shelter. The manures, TGM and PR were layered 25 cm thick on the dry soil surface in the shelter. The GBM, HBM, ChBM, TGM and PR were moistened by spraying with a watering can and covering with black plastic sheets for two days. Cattle manure was relatively moist when collected from the farm and thus not watered.
The pile of organic matters were broadcast with 1.5 kg t
-1powder form of “Biodec” bio-decomposer (consisted of Trichoderma sp, Trametes sp, and Aspergillus niger) and covered with black plastic sheets. Each organic matter was mixed by using a shovel every five days and the composts were ready to use after about three weeks of composting, except for GBM which needed four weeks.
Each compost is considered mature when its temperature cools off to room temperature. Samples of each compost were taken for water and nutrient content analyses.
‘Progressive compost’ that was applied in a few surrounding organic farms was tested in 2006.
Progressive compost (PC) is the method of on-the-plot composting, whereby the compost is made on the plot in a pit of (for this experiment) 0.5 m wide (plot lengthwise direction) by 1 m (plot widthwise direction) and 0.5 m deep. The portion (about 5%) of the plot area occupied by the compost pit was not planted. As much as 22 kg per plot (equivalent with 17 t ha
-1) of fresh plant residues were dumped into the pit. The liquid form of “Biodec” at a rate of 1 L t
-1was mixed with the plant residue to speed up the decomposition process.
The compost was dug out of the pit and distributed to the 9.5 m long plot before crop planting. In the long run, the pits were meant to be progressively moved from the first 0.5 m section of the plot to the next 0.5 m in the following crop season and each time filled with new plant residue.
In situ green leaf manure (GLM) is generated from the
Fig. 2. Layout of plant spacing of carrot intercropped withmustard green or beet intercropped with Chinese cabbage.
cutting of Crotalaria juncea legumes. This legume seeds were drilled on the middle row of the treated plots and then thinned to 15 cm distance between the plants after emergence. This plant is a nitrogen fixing and insect attractant. The plants were cut at soil surface level after reaching the height of 60 cm, twice per crop.
Experimental Design and Treatment Adaptation Ten treatments with three replications were arranged in a randomized complete block design (RCBD). Experimental plot dimension was 1m x 10 m. Treatments underwent adaptation as the research progresses (Table 1).
For 2005 experiment, barnyard manure rate of 20 t ha
-1was based on a simple assessment of nutrient budget for the vegetable crops. TGM rate of 15 t ha
-1or its equivalent TC of 3 t ha
-1(about 80% mass loss of fresh Tithonia to Tithonia compost) in combination with 20 t ha
-1barnyard manure was based on the local organic farming practice. The 20 t ha
-1PR was decided by considering the maximum amount of plant residues that can be collected locally. Treatment 10 (30 t ha
-1ChBM) was based on the local farmer practice when using ChBM singly.
For the 2006 experiment, the amount of applied manure was adjusted to 25 t ha
-1based on Widowati et al. (2007) and on the fact that crop yields under 30 and 20 t ha
-1ChBM for the 2005 crops were not significantly different.
Another biofertilizer, the multifunctional soil microorganisms (MM) containing (Azospirillum sp - a free N-fixing bacteria; Alcaligenes sp - an organism producing plant regulator and anti pathogen; and Bacillus sp - a P solubilizing bacteria) was used for treatments 1, 2 and 4. In addition, progressive compost (PC) was introduced to Treatments 6 and 7.
For the 2007 experiment, readjustment were made by simplifying the treatments to enable better comparison of treatment effects. Organic matter rates were adjusted into halves the 2006 rate when two kinds of organic matters were used. Also, because of insignificant effects of biofertilizer and complication of progressive composting, these treatments were eliminated in 2007.
Each plot (raised bed) was tilled twice and leveled by using a hoe. At the beginning of 2005, each plot was planted with Paspallum notatum grass on the riser to reduce erosion from the plot. Composts of animal manures were applied in planting holes one day before planting of broccoli, Chinese cabbage, and Beet or at plant rows for mustard green, Chinese Lettuce and Carrot. Seedlings of each vegetable crops were prepared in a shaded nursery.
Tithonia diversifolia green manure (TGM) was incorporated into the top 20 cm soil depth two weeks
Treatment No.
1 2 3 4 5 6 7 8 9 10
CBM = Cattle barnyard manure compost TC = Tithonia diversifolia compost TGM = Fresh Tithoniagreenmanure
PR = Plant residue of common bean, carrot, and broccoli GBM = Goat barnyard manure compost
ChBM = Chicken barnyard manure compost HBM = Horse barnyard manure compost
GLM = In situ green leaf manure of Crotalaria juncea and Sesbania sesban legumes. These legumes were intercropped in the vegetable interrows.
BF = Biofertilizers PC = Progressive compost
20 CBM + 3 TC 25 CBM + 3 TC + BF 5 TC
20 CBM + 15 TGM 25 HBM + 15 TGM + BF 25 TGM
20 PR 25 PR 20 PR
20 GBM + 3 TC 25 GBM + 3 TC + BF 12.5 ChBM + 2.5 TC
20 GBM + 15 TGM 25 HBM + 3TC 12.5 ChBM + 12.5 TGM
20 ChBM 25 ChBM + 17 PC 12.5 ChBM + 5 PR
20 ChBM + 3 TC 25 ChBM + 17 PC + 15 TGM 25 CBM
20 CBM + 3 TC + GLM 25 CBM + 3 TC + GLM 25 HBM
20 GBM + 3 TC + GLM 25 GBM + 3 TC + GLM 25 GBM
30 ChBM 25 ChBM 25 ChBM
2007 2006
2005
Rate (t ha-1)andtreatmentcodeinyear
Table 1. Kinds and rates of organic matters used for each treatment in the three year organic farming experiment.
before vegetable planting. Pests and diseases were controlled by bio-pesticides (nimb oil) and by handpicking.
During the dry period of Jun. and Jul. 2006 and of Oct.
and Nov. 2006 (Figure 1) the crops were watered using a watering hose at plant hills with about 3 mm ground well water every three days.
Organic Matter and Soil Analyses Samples of organic matters were analyzed for water and nutrients (N, P
2O
5, K
2O, Ca, Mg, S, and micro nutrients) as well as C contents. Plant samples were analyzed for N, P and K contents.
Soil samples according to the horizon depths were collected from a soil pit located about 10 m from the plots in March 2007. The analyses included three class soil texture (Gee and Bauder, 1986), pH (in H
2O with 1:5 soil- water suspension) using a glass electrode, organic C (Walkley and Black) total-N (Kjeldahl digestion), available P (Bray-1) and potential P (25% HCl extractable) and cation exchange capacity (CEC) and exchangeable Ca, Mg and K using 1 MNH
4-OAc extraction at pH 7 (ISRIC, 1993; Sulaeman et al. 2005 Page, 1982).
Nutrient Balance We estimated the simplified nutrient balance according to Andrist-Rangel et al.
(2007) using equation:
Balance
Nutrient= Added
Nutrient= Removed
NutrientAdded
Nutrientin this case is the amount of nutrients contained in the added organic matter. Removed
Nutrientis the amount of nutrients taken out of the plots with harvest and any other removed biomass. For broccoli the harvested part is the flower and about 10 cm of the stem and the accompanying leaves. The remaining shoot and plant roots were considered as the plant residues which are left on the beds. Since this portion is not removed from the plot, its nutrients are not accounted as the
removed nutrients. For carrot the harvested part is the root without stem and leaves. For cabbages, the harvest included all shoot, but the wilt leaves. Crop biomass/residue were left to rot on and incorporated into the respective plots during the soil tillage for the succeeding crops.
The plant was harvested from the raised bed and weighted. A portion of harvested plant was sampled for N, P, and K contents, corrected with gravimetric water content. This amount of nutrients was considered as removed nutrients.
Prior to their application, organic matters used in this experiment were sampled for water content and N, P and K contents. The multiplication of this nutrient contents with the rate of application is regarded as nutrients input.
Soil samples were taken in 2007 outside of the experimental plots to represent the non treated properties, and form each plot at 0-20 cm depth after the 2005 carrot harvest in January 2006 and 30 days after planting of the second crop in June 2007. The analyzed properties included soil pH in 2:5 soil-water suspension using a glass electrode, soil organic carbon using the Walkley and Black procedure, total N using Kjeldahl digestion, Bray-1 extractable P and exchangeable K using the 1 M Ammonium Acetate extraction at pH 7 (Page 1982).
Crop Observation Observation on the crops included the crop yield and plant residue (biomass). Crop yield data was corrected by a factor of 0.8 to account for plot borders.
Parameters measured were analyzed using the analysis of variance followed by mean comparison using the Duncans Multiple Range Test (DMRT).
RESULT AND DISCUSSION
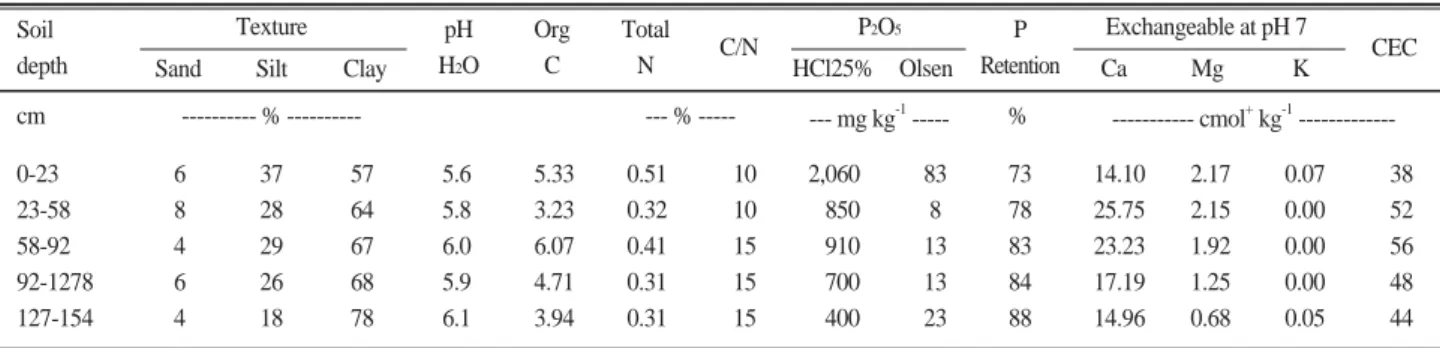
The soil properties Table 2 shows selected soil physical and chemical properties based on the description
Soil depth
0-23 6 37 57 5.6 5.33 0.51 10 2,060 83 73 14.10 2.17 0.07 38
23-58 8 28 64 5.8 3.23 0.32 10 850 8 78 25.75 2.15 0.00 52
58-92 4 29 67 6.0 6.07 0.41 15 910 13 83 23.23 1.92 0.00 56
92-1278 6 26 68 5.9 4.71 0.31 15 700 13 84 17.19 1.25 0.00 48
127-154 4 18 78 6.1 3.94 0.31 15 400 23 88 14.96 0.68 0.05 44
CEC K
Mg Ca Olsen
HCl25%
Total C/N N Org
C pH H2O Clay Silt Sand
Texture P2O5 Exchangeable at pH 7
--- cmol+kg-1--- --- mg kg-1--- %
--- % --- --- % ---
cm
P Retention
Table 2. Selected soil profile properties by depth as taken from soil pit at Cimahi experimental site (samples were taken in March 2007).
of soil pit undertaken on March 2007. Soil texture was fine, pH was slightly acid, organic C and total N were relatively high and the C/N ratio was low to moderate.
Total P (25% HCl extractable) and available P were high in the Ap horizon, but low to moderate in the underlying layers. This indicates P accumulation from fertilization and organic matter application. As in typical Andisols, P retention was high because of allophane fixation.
Exchangeable calcium and magnesium were high, but exchangeable potassium was low.
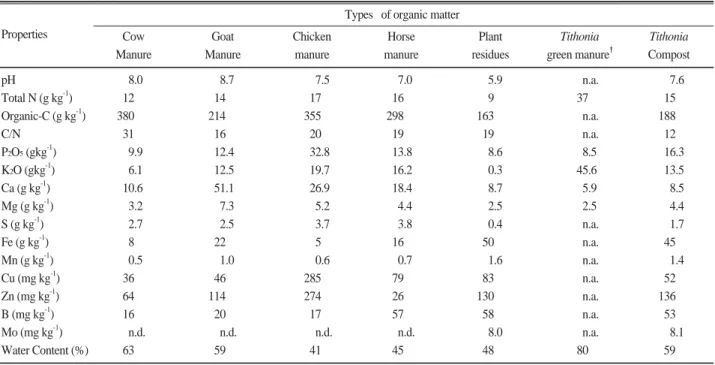
Nutrient content of organic matter Nutrient content of organic matter used varied with time and it appears to be dependent on the variation of handling procedure before the composting and on the sources. The analysis of the organic matter used for 2007 experiment is presented in Table 3. Chicken manure excelled other organic matter in terms of N, P and K contents. Tithonia green manure was also superior for N and P contents and was only inferior in this respect compared to chicken manure. Plant residue contained the lowest N, P and K as well as Ca, Mg and S.
Nutrient Balance Table 4 presents the amount of N, P and K added through organic matter, removed through crop harvest and the field balance. Positive budget was
shown for N, P, and K after the harvest of the three crops in 2005, except for a slight negative K under plant residues application and of N under 20 t ha
-1chicken manure application. Application of 20 t ha
-1Chicken barnyard manure was followed by high nutrient output through harvest indicating high plant yield under this treatment. This treatment gave an excess of 32 kg P ha
-1, an amount about three times as much as nutrients taken through the harvest of the three crops planted in this season.
The use of manure composts in combination with Tithonia compost or Tithonia green manure also supplied nutrients in excess of the amount taken out through harvest and resulted in positive N, P and K balances and thus they are good candidates for further investigations related to the nutrient release and uptake.
The addition of 20 t ha
-1plant residue compost supplied very low N, P and K. The low nutrient removal under this treatment was attributed to low crop yield. Although recycling of in situ plant residue is a good organic matter management practice to alleviate the amount of fertilizers (Abdurachman and Agus, 2001), but application of 20 t ha
-1plant residue is not practical since, in general, the amount of in situ vegetable plant residue is not even half that amount.
For 2006 the adaptation of treatments changed the
Properties
"Source: Jama et al. (2000)
n.a. = data not available n.d. = not detectable
pH 8.0 8.7 7.5 7.0 5.9 n.a. 7.6
Total N (g kg-1) 12 14 17 16 9 37 15
Organic-C (g kg-1) 380 214 355 298 163 n.a. 188
C/N 31 16 20 19 19 n.a. 12
P2O5(gkg-1) 9.9 12.4 32.8 13.8 8.6 8.5 16.3
K2O (gkg-1) 6.1 12.5 19.7 16.2 0.3 45.6 13.5
Ca (g kg-1) 10.6 51.1 26.9 18.4 8.7 5.9 8.5
Mg (g kg-1) 3.2 7.3 5.2 4.4 2.5 2.5 4.4
S (g kg-1) 2.7 2.5 3.7 3.8 0.4 n.a. 1.7
Fe (g kg-1) 8 22 5 16 50 n.a. 45
Mn (g kg-1) 0.5 1.0 0.6 0.7 1.6 n.a. 1.4
Cu (mg kg-1) 36 46 285 79 83 n.a. 52
Zn (mg kg-1) 64 114 274 26 130 n.a. 136
B (mg kg-1) 16 20 17 57 58 n.a. 53
Mo (mg kg-1) n.d. n.d. n.d. n.d. 8.0 n.a. 8.1
Water Content (%) 63 59 41 45 48 80 59
Tithonia Compost Types of organic matter
Tithonia green manure"
Plant residues Horse
manure Chicken
manure Goat
Manure Cow
Manure
Table 3. Properties of different sources of organic matters used for vegetable in the experiment in Cimahi, West Java, based on Sep.
2007 sampling.
amount of added nutrients significantly (Table 4).
Treatment 7 (combination of 25 t ha
-1chicken manure compost with 17 t ha
-1progressive compost and 15 t ha
-1Tithonia green manure, for example, doubled the amount of N and also significantly increased P and K amount added to the soil compared to application of 25 t ha
-1chicken manure compost singly. As in 2005, the 25 t ha
-1plant residue (Treatment 3) contributed to the lowest N, P and K.
For the dry season crops almost all treatments resulted in positive N, P and K balances. The more vigorous plant growth in the wet season resulted in negative N balance
No. Output Nutrient balance
--- kg ha-1--- Wet season (Oct 2005- Jan. 2006): Carrot, Mustard green and Chinese lettuce
Dry season (May-Aug.) 2006: Broccoli and Chinese lettuce intercropping
Wet season (Sep. - Dec.) 2006: Beet and Chinese cabbage intercropping
1 20 CBM + 3 TC 53 19 21 28 4 19 25 14 2
2 20 CBM + 15 TGM 67 25 31 33 6 31 34 20 0
3 20 PR 34 11 26 29 5 28 5 6 -2
4 20 GBM + 3 TC 59 25 52 48 8 40 11 17 12
5 20 GBM + 15 TGM 73 31 62 47 8 40 26 23 22
6 20 ChBM 57 43 56 61 11 48 -4 32 8
7 20 ChBM + 3 TC 67 47 63 58 10 44 9 37 20
8 20 CBM + 3 TC + GLM 53 19 21 26 4 20 26 15 1
9 20 GBM + 3 TC + GLM 67 47 63 30 5 26 37 42 37
10 30 ChBM 85 64 85 69 12 64 16 52 20
1 25 CBM + 3 TC + BF 63 23 25 42 6 26 22 16 -1
2 25 HBM + 15 TGM + BF 100 40 52 45 6 32 55 33 20
3 25 PR 42 14 33 32 5 27 10 9 5
4 25 GBM + 3 TC + BF 71 30 63 44 7 37 26 23 26
5 25 HBM + 3TC 108 42 70 35 4 21 72 38 49
6 25 ChBM + 17 PC 99 63 96 53 8 35 46 55 60
7 25 ChBM + 17 PC + 15 TGM 145 84 129 60 9 39 85 75 91
8 25 CBM + 3 TC + GLM 63 23 25 29 3 20 35 19 5
9 25 GBM + 3 TC + GLM 71 30 63 26 4 22 45 26 41
10 25 ChBM 71 53 73 44 6 35 27 48 39
1 25 CBM + 3 TC + BF 63 23 25 65 9 50 -1 13 -25
2 25 HBM + 15 TGM + BF 100 40 52 61 12 50 39 28 2
3 25 PR 42 14 33 58 7 40 -16 6 -7
4 25 GBM + 3 TC + BF 71 30 63 48 7 38 23 23 26
5 25 HBM + 3TC 108 42 70 76 10 50 32 32 20
6 25 ChBM + 17 PC 99 63 96 81 11 53 18 52 43
7 25 ChBM + 17 PC + 15 TGM 145 84 129 73 11 53 72 73 77
8 25 CBM + 3 TC + GLM 63 23 25 60 7 36 3 15 -11
9 25 GBM + 3 TC + GLM 71 30 63 67 11 54 4 19 9
10 25 ChBM 71 53 73 77 11 50 -5 42 24
CBM = Cattle barnyard manure compost TC = Tithonia diversifolia compost TGM = Fresh Tithonia green manure
PR = Plant residue of common bean, carrot, and broccoli GBM = Goat barnyard manure compost
ChBM = Chicken barnyard manure compost
GLM = In situ green leaf manure of Crotalaria juncea and Sesbania sesban legumes. These legumes were intercropped in the vegetable interrows.
Input
K P
N K
P N
K P
Treatment N
Table 4. N, P, and K inputs from the applied organic matters, removals (outputs) with crop harvests and balances based on 2005 and 2006 crops.
under plant residue (Treatment 3) and 25 t ha
-1chicken manure (Treatment 10). No negative P balance was observed for this 2006 crops. Negative balance of K was found under Treatments 1, 3 and 7. Crop yield was relatively higher in the second season, and it seems that 25 t ha
-1chicken manure compost is not enough to balance the crop uptake and nutrient removal through harvest.
Further readjustments of the treatments in 2007 lead to a more comparable added nutrients among treatments involving barnyard manure compost, except for cattle barnyard manure (Treatment 7) which contained very low P and K. Tithonia compost (Treatment 1) also
contained much lower N and K relative to Tithonia green manure compost (Treatment 2) (Table 5).
Tithonia compost treatment caused severe N and K deficits due to low contents of these two nutrients.
Although, mucuna decomposition have contributed to nutrient supplies (data not presented), but was not taken into account in this field level nutrient balance calculation. Cattle manure compost (Treatment 7) also caused severe K deficit. Tithonia green manure supplied ample amounts of N and K and appeared to be a good nutrient source provided that the source is easily available locally. However, its continued cutting and transporting may cause depletion of soil fertility at the place where the
No. Output Nutrient balance
--- kg ha-1--- Wet season (Feb. May) 2007: Mustard green and carrot
Dry season (May-August) 2007: Chinese lettuce and Cauli flower
1 5 TC 17 7 11 33 6 36 -16 1 -25
2 25 TGM 76 7 76 34 5 34 42 3 41
3 20 PR 34 11 26 23 3 27 12 8 -1
4 12.5 ChBM + 2,5 TC 53 37 52 29 5 36 24 32 15
5 12.5 ChBM + 12,5 TGM 82 37 84 31 6 42 51 31 42
6 12.5 ChBM + 5 PR 53 36 52 32 5 36 21 31 17
7 25 CBM 54 18 18 27 6 36 27 13 -18
8 25 HBM 99 38 63 29 5 35 70 32 28
9 25 GBM 62 26 57 26 4 42 36 21 14
10 25 ChBM 89 67 92 37 4 30 52 62 62
1 5 TC 17 7 11 28 3 22 -11 4 -11
2 25 TGM 76 7 76 28 3 21 48 4 55
3 20 PR 34 11 26 30 4 25 4 7 1
4 12.5 ChBM + 2,5 TC 53 37 52 46 5 38 7 32 14
5 12.5 ChBM + 12,5 TGM 82 37 84 61 8 62 22 29 22
6 12.5 ChBM + 5 PR 53 36 52 62 7 43 -8 29 9
7 25 CBM 54 18 18 47 6 34 8 13 -15
8 25 HBM 99 38 63 40 5 34 59 32 30
9 25 GBM 62 26 57 37 4 30 25 22 27
10 25 ChBM 89 67 92 65 8 53 23 58 39
CBM = Cattle barnyard manure compost TC = Tithonia diversifolia compost TGM = Fresh Tithonia green manure
PR = Plant residue of common bean, carrot, and broccoli GBM = Goat barnyard manure compost
ChBM = Chicken barnyard manure compost HBM = Horse barnyard manure compost
GLM = In situ green leaf manure of Crotalaria juncea and Sesbania sesban legumes. These legumes were intercropped in the vegetable interrows.
BF = Biofertilizers PC = Progressive compost
Input
K P
N K
P N
K P
Treatment N
Table 5. N, P, and K inputs from the applied organic matters, removals (outputs) with vegetable crop harvest and balances based on the 2007 crops.
cutting is taken.
Crop residue compost (Treatment 3), despite seemingly giving good balance to K and positive balance to N and P in 2007, has caused low vegetable crops yields (to be explained in Crop Response section) due to its low N, P and K contents and its consecutive application since 2005. Therefore short term nutrient balance does not give much information and data on nutrient balance, albeit giving a good indication of sustainability, should be cross checked with crop yield data. Treatments involving barnyard manure, except for CBM, gave positive N, P and K balances.
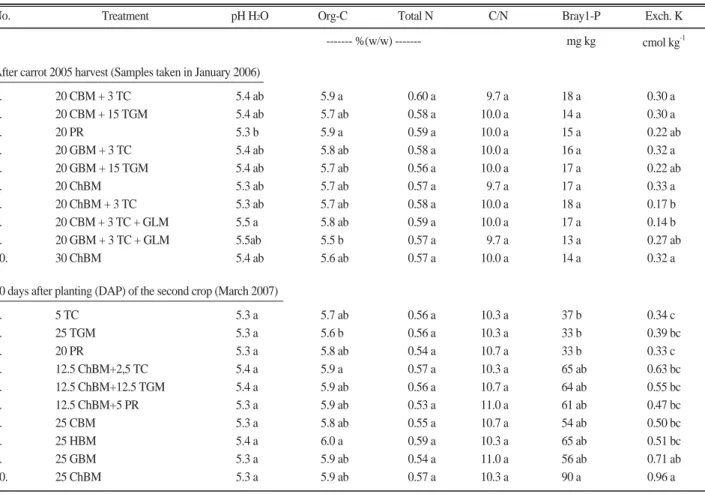
Soil fertility status There was a significant buildup of plant available P and exchangeable K in the soil as affected by organic matter addition. Total N concentrations remained relatively high (Table 6) in the high N status Andisol. Despite the high total N status, the vegetable crops were responsive to organic matter containing high N because the soil organic N may not be readily available for crop uptake.
The unavailability of Bray-1 P data from the soil profile outside the plot is a limitation of this experiment. However, despite this shortcoming, Bray-1 P build up is clearly shown in Table 6. Vegetable crops took up relatively low P and the addition of P from the organic matters was a lot
No.
After carrot 2005 harvest (Samples taken in January 2006)
1. 20 CBM + 3 TC 5.4 ab 5.9 a 0.60 a 9.7 a 18 a 0.30 a
2. 20 CBM + 15 TGM 5.4 ab 5.7 ab 0.58 a 10.0 a 14 a 0.30 a
3. 20 PR 5.3 b 5.9 a 0.59 a 10.0 a 15 a 0.22 ab
4. 20 GBM + 3 TC 5.4 ab 5.8 ab 0.58 a 10.0 a 16 a 0.32 a
5. 20 GBM + 15 TGM 5.4 ab 5.7 ab 0.56 a 10.0 a 17 a 0.22 ab
6. 20 ChBM 5.3 ab 5.7 ab 0.57 a 9.7 a 17 a 0.33 a
7. 20 ChBM + 3 TC 5.3 ab 5.7 ab 0.58 a 10.0 a 18 a 0.17 b
8. 20 CBM + 3 TC + GLM 5.5 a 5.8 ab 0.59 a 10.0 a 17 a 0.14 b
9. 20 GBM + 3 TC + GLM 5.5ab 5.5 b 0.57 a 9.7 a 13 a 0.27 ab
10. 30 ChBM 5.4 ab 5.6 ab 0.57 a 10.0 a 14 a 0.32 a
CBM = Cattle barnyard manure compost TC = Tithonia diversifolia compost TGM = Fresh Tithonia green manure
PR = Plant residue of common bean, carrot, and broccoli GBM = Goat barnyard manure compost
ChBM = Chicken barnyard manure compost HBM = Horse barnyard manure compost
GLM = In situ green leaf manure of Crotalaria juncea and Sesbania sesban legumes. These legumes were intercropped in the vegetable interrows.
BF = Biofertilizers PC = Progressive compost n.a. = data not available
Exch. K cmol kg-1 mg kg
--- %(w/w) ---
Bray1-P C/N
Total N Org-C
pH H2O Treatment
Table 6. Selected top soil chemical properties based on samples taken in January 2006 and in March 2007 from each experimental plots.
30 days after planting (DAP) of the second crop (March 2007)
1. 5 TC 5.3 a 5.7 ab 0.56 a 10.3 a 37 b 0.34 c
2. 25 TGM 5.3 a 5.6 b 0.56 a 10.3 a 33 b 0.39 bc
3. 20 PR 5.3 a 5.8 ab 0.54 a 10.7 a 33 b 0.33 c
4. 12.5 ChBM+2,5 TC 5.4 a 5.9 a 0.57 a 10.3 a 65 ab 0.63 bc
5. 12.5 ChBM+12.5 TGM 5.4 a 5.9 ab 0.56 a 10.7 a 64 ab 0.55 bc
6. 12.5 ChBM+5 PR 5.3 a 5.9 ab 0.53 a 11.0 a 61 ab 0.47 bc
7. 25 CBM 5.3 a 5.8 ab 0.55 a 10.7 a 54 ab 0.50 bc
8. 25 HBM 5.4 a 6.0 a 0.59 a 10.3 a 65 ab 0.51 bc
9. 25 GBM 5.3 a 5.9 ab 0.54 a 11.0 a 56 ab 0.71 ab
10. 25 ChBM 5.3 a 5.9 ab 0.57 a 10.3 a 90 a 0.96 a
higher than just compensate the plant uptake (Tables 4 and 5) in such a way that P build-up occurred.
The very low exchangeable K is untypical of Andisols which normally range from 0.2 to 0.5 cmol(+) K kg
-1, but the elephant grass that have been planted for several years may have depleted soil K as also observed by Agus et al.
(1999). Repeated application of organic matter at the beginning of every planting increased exchangeable soil K status. Treatments involving barnyard manure compost rejuvenated exchangeable K to >0.5 cmol(+) kg
-1; a level considered high for most crops. The use of 25 to 30 t ha
-1chicken manure for every planting season gave the highest accumulation of K; reaching 1 cmol(+) kg
-1.
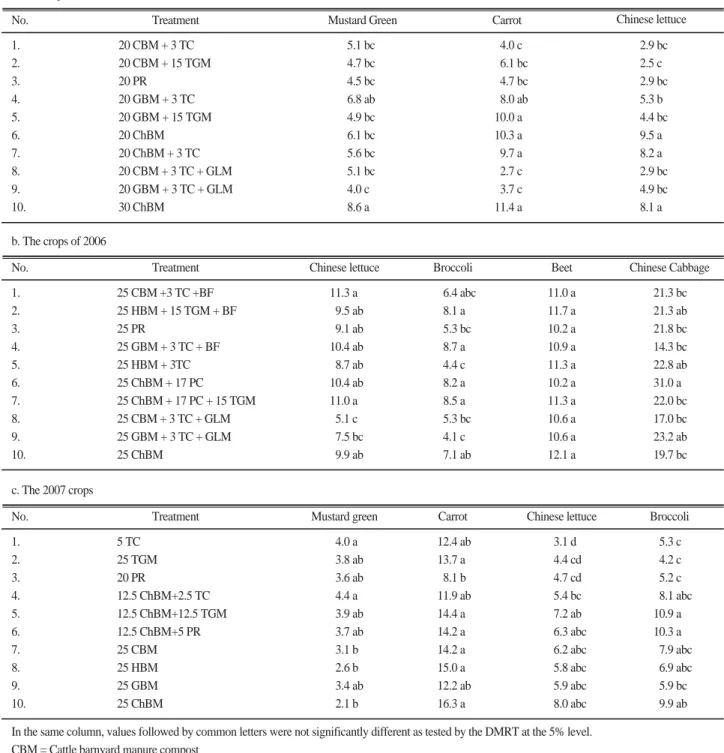
Crop responses For the 2005 crops Chicken manure (Treatment 10) gave consistently the highest crop yield.
Treatments involving Chicken manure (Treatments 6 and 7) also gave among the highest yield for carrot and Chinese lettuce, although this response was not consistent for Mustard green. For these former two crops, Treatments 6, 7, and 10 were not significantly different (Table 7), meaning that, under the application of 20 t ha
-1Chicken manure, there is no need to add additional 3 t ha
-1Tithonia compost, nor increasing of the Chicken manure rate to 30 t ha
-1is necessary. Nutrients contained in 20 t ha
-1Chicken manure seemed to meet these crops nutrient demands.
Although inconsistently, goat manure (Treatments 4 and 5) gave relatively high yield and thus recommendable.
However, treatments involving Cow manure (Treatments 1, 2, and 8) gave among the lowest yield due to lower nutrient content of this organic matter (Table 3).
Treatments involving in-situ green leaf manure (Treatments 8 and 9) gave consistently the lowest yield.
In our experiment, Crotalaria green manure crop were sparsely planted (the seeds were drilled along the middle of the plots), and may have contributed insignificant amount of organic matter and nitrogen on this high C and N soil (Table 2). Their intercropping with vegetable crops may also have created competition for nutrients and water. When it is used as a cover crop, Crotalaria contributed as high as 40 to 57 kg N ha
-1and significantly increased crop yield such as sugar cane (Bokhtiar et al.
2003).
The use of plant residue (Treatment 3) gave among the lowest yield as expected because of the low nutrient content of this organic matter (Table 4). Also, in a large scale, collection of 20 t ha
-1of plant residue from the surrounding area is not practical, while the in situ source
under the local condition ranged only from 5 to 10 t ha
-1. Combination of plant residue and other organic matter sources gave better effects as tested by Aggarwal et al.
(1997).
In 2006 the pattern of treatment effects on crop yield was rather inconsistent. Nutrients extraction by and recycling of Mucuna biomass that contained as high as (kg ha
-1) 83-137 N, 9-15 P, and 42-73 K in early 2006 seem to have diffused treatment effects on the production of the subsequent crops.
Beet was less sensitive to the various treatments. As in 2005, treatments involving Chicken manure (Treatments 6, 7, and 10) and those involving Goat manure without GLM (Treatment 4), almost consistently gave the highest yield (Table 6). Also, like the 2005 experiment, treatments 8 and 9 gave among the lowest yield for Chinese lettuce and Broccoli.
The pattern of Chinese cabbage growth did not show interpretable trend, because this crop was attacked by club root disease. For example, while treatment 6 (25 t ha
-1chicken manure plus 17 t ha-1 progressive compost) gave 21.4 t ha
-1yield, treatment 7 (the same as treatment 6 plus 15 t ha
-1Tithonia green leaf manure) gave about 26% lower yield.
For all crops in 2007, but Mustard green (which was also attacked by club root disease), treatments involving barnyard manure (Treatments 4 to 10) gave comparable or higher yield relative to the other three treatments (Table 7).
Although with some inconsistencies, this research has demonstrated that the application of 20 to 25 t ha
-1of either one of the four kinds of barnyard manure composts gave better yield than the application of plant residue, Tithonia green manure and Tithonia compost applied singly. This pattern was more clearly seen for leafy vegetables.
CONCLUSSIONS
In general, application of
≥20 t ha
-1barnyard manure per crop resulted in positive balances of N, P, and K.
Cattle manure contains a relatively low K and thus sometimes could not compensate the plant uptake by K demanding crops such as Chinese cabbage. Application of 20 to 25 t ha
-1of plant residue or 5 t ha
-1of Tithonia compost also often resulted in a negative K balance.
All treatments, especially those involving 25 t ha
-1barnyard manure, except for cattle manure, resulted in
positive P balance. Furthermore, soil available P increased significantly overtime under barnyard manure
application. Chicken manure had the highest available P causing the highest soil P built up. In the long run,
No.
a. The crops of Oct. 2005 to Jan. 2006.
1.
2.
3.
4.
5.
6.
7.
8.
9.
10.
20 CBM + 3 TC 20 CBM + 15 TGM 20 PR
20 GBM + 3 TC 20 GBM + 15 TGM 20 ChBM 20 ChBM + 3 TC 20 CBM + 3 TC + GLM 20 GBM + 3 TC + GLM 30 ChBM
5.1 bc 4.7 bc 4.5 bc 6.8 ab 4.9 bc 6.1 bc 5.6 bc 5.1 bc 4.0 c 8.6 a
14.0 c 16.1 bc 14.7 bc 18.0 ab 10.0 a 10.3 a 19.7 a 12.7 c 13.7 c 11.4 a
2.9 bc 2.5 c 2.9 bc 5.3 b 4.4 bc 9.5 a 8.2 a 2.9 bc 4.9 bc 8.1 a
In the same column, values followed by common letters were not significantly different as tested by the DMRT at the 5% level.
CBM = Cattle barnyard manure compost TC = Tithonia diversifolia compost TGM = Fresh Tithonia green manure
PR = Plant residue of common bean, carrot, and broccoli GBM = Goat barnyard manure compost
ChBM = Chicken barnyard manure compost HBM = Horse barnyard manure compost
GLM = In situ green leaf manure of Crotalaria juncea and Sesbania sesban legumes. These legumes were intercropped in the vegetable interrows.
BF = Biofertilizers PC = Progressive compost
Chinese lettuce Carrot
Mustard Green Treatment
No.
b. The crops of 2006
1. 25 CBM +3 TC +BF 11.3 a 6.4 abc 11.0 a 21.3 bc
2. 25 HBM + 15 TGM + BF 9.5 ab 8.1 a 11.7 a 21.3 ab
3. 25 PR 9.1 ab 5.3 bc 10.2 a 21.8 bc
4. 25 GBM + 3 TC + BF 10.4 ab 8.7 a 10.9 a 14.3 bc
5. 25 HBM + 3TC 8.7 ab 4.4 c 11.3 a 22.8 ab
6. 25 ChBM + 17 PC 10.4 ab 8.2 a 10.2 a 31.0 a
7. 25 ChBM + 17 PC + 15 TGM 11.0 a 8.5 a 11.3 a 22.0 bc
8. 25 CBM + 3 TC + GLM 5.1 c 5.3 bc 10.6 a 17.0 bc
9. 25 GBM + 3 TC + GLM 7.5 bc 4.1 c 10.6 a 23.2 ab
10. 25 ChBM 9.9 ab 7.1 ab 12.1 a 19.7 bc
Chinese lettuce Broccoli Beet Chinese Cabbage
Treatment
No.
c. The 2007 crops
1. 5 TC 4.0 a 12.4 ab 3.1 d 5.3 c
2. 25 TGM 3.8 ab 13.7 a 4.4 cd 4.2 c
3. 20 PR 3.6 ab 8.1 b 4.7 cd 5.2 c
4. 12.5 ChBM+2.5 TC 4.4 a 11.9 ab 5.4 bc 8.1 abc
5. 12.5 ChBM+12.5 TGM 3.9 ab 14.4 a 7.2 ab 10.9 a
6. 12.5 ChBM+5 PR 3.7 ab 14.2 a 6.3 abc 10.3 a
7. 25 CBM 3.1 b 14.2 a 6.2 abc 7.9 abc
8. 25 HBM 2.6 b 15.0 a 5.8 abc 6.9 abc
9. 25 GBM 3.4 ab 12.2 ab 5.9 abc 5.9 bc
10. 25 ChBM 2.1 b 16.3 a 8.0 abc 9.9 ab
Mustard green Carrot Chinese lettuce Broccoli
Treatment
Table 7. Crop yield (t ha-1)as affected by organic matter treatments in 2005, 2006 and 2008 (refer to Figure 1 for the crops combination and sequence).
application of 25 t ha
-1cattle, goat, and horse manure or about 20 t ha
-1chicken manure is recommendable for sustaining the fertility of this Andisol for vegetable production.
Simple treatments such as application of certain kind of barnyard manure singly seem more practical. Provided that the sources are available locally, part of barnyard manure could potentially be substituted with Tithonia green manure or compost. Crotalaria intercropping as an in situ source of green manure, progressive mulch technique, and biofertilizer did not affect crop yield.
Acknowledgements
This research was conducted in collaboration between Indonesian Soil Research Institute (ISRI) of the RepublicofIndonesia and the National Institute of Agricultural Science and Technology (NIAST), Rural Department Administration (RDA) of the Republic of Korea.
REFERENCES
Abdurachman, A., and F. Agus. 2001. Konservasi tanah dan air melalui pengelolaan bahan organik. Alami 6(1):35-43. (In Indonesian)
Agus, F., D.P. Garrity, and D.K. Cassel. 1999. Soil fertility in contour hedgerow systems on sloping Oxisols in Mindanao, Philippines. Soil and Tillage Research 50:159-167.
Aggarwal, R.K., Praveen-Kumar, and J.F. Power. 1997. Use of crop residue and manure to conserve water and enhance nutrient availability and pearl millet yields in an arid tropical region. Soil &
Tillage Research 41:43-51.
Andrist-Rangel, Y., A.C. Edwards, S. Hillier, and I.Öborn.2007.Long-term K dynamics in organic and conventional mixed cropping systems as related to management and soil properties. Agriculture, Ecosystems & Environment 122(4):413- 426.
Bokhtiar, S.M., M.A. Gafur, and A.B.M.M. Rahman. 2003. Effects of Crotalaria and Sesbania aculeata green manures and N fertilizer on soil fertility and the productivity of sugarcane. Journal of Agricultural Science 140:305-309.
Condron, L.M., K.C. Cameron, H.J. Di, T.J. Clough, E.A. Forbes, R.G. Mc Larren, R.G. Silva. 2000. A comparison of soil and environmental quality under organic and conventional farming system in New Zealand. New Zealand Journal of Agricultural Research. Vol.43:443-466.
Cooperland, L. 2002. Building Soil Organic Matter with Organic Amendments. Centre for Integrated Agricultural Systems, College of Agricultural and Life Sciences, University of Wisconsin- Madison.
Dalgaard, R., N. Halberg, I.S. Kristensen and I. Larsen. 2006.
Modelling representative and coherent Danish farm types based on farm accountancy data for use in environmental assessments.
Agriculture Ecosystem and Environment 117, 223-237.
Gee, G.W. and J.W. Bauder. 1986. Particle size analysis. p. 383- 411. In A. Klute (Ed.). Methods of Soil Analysis (Part I).
Agronomy 9. Soil Sci. Soc. Amer., Madison,WI,USA.
ISRIC (International Soil Reference and Information Centre).1993.
Procedures for Soil Analysis. In van Reeuwijk, L.P. (Ed.).
Technical Paper, International Soil Reference and Information Centre. Wageningen, The Netherlands. 4thedition.100 pp.
Jama, B.A., C.A. Palm, R.A. Buresh, A.I. Niang, C. Gachengo, G.
Mziuheba, and B. Amadalo B. 2000. Tithonia diversifolia as a green manure for soil fertility improvement in Western Kenya: A Review. Agroforestry Systems 49:201-221.
Khai M.N., P.Q. Ha, and I Öborn. 2007. Nutrient flows in small- scale peri-urban vegetable farming systems in Southeast Asia-A case study in Hanoi. Agriculture, Ecosystems and Environment 122:192-202.
Lampkin, N.H., and S. Padel. 1994. The economic of organic farming: An International Perspective. CAB International.
Wallingford,UK.
Modin-Edman, A.-K., I. Öborn, and H. Sverdrup. 2007.
FARMFLOW- a dynamic model for phosphorous mass flow, simulating conventional and organic management of a Swedish dairy farm. Agricultural System. 94, 431-444.
Moyin-Jesu, E.I. 2007. Use of plant residues for improving soil fertility, pod nutrients, root growth and pod weight of okra (Abelmoschus esculentum L). Bioresource Technology 98:2057- 2064.
Öborn, I., Y. Andrist-Rangel, M. Askegaard, C.A. Grant, C.A.
Watson and A.C. Edwards. 2005. Critical aspects of potassium management in agricultural production systems. Soil Use Management. 21:102-112.
Oenema, O. and M. Heinen. 1999. Uncertainties in nutrient budgets due to biases and errors. In: E.M.A Smaling, O. Oenema, and L.O.
Fresco (Eds.). Nutrient Disequilibria in Agroecosystems-Concepts and Case Studies. CABI Publishing, Wallingford, UK.
Page A.L. (ed.) 1982. Methods of Soil Analysis, Part 2, Chemical and Microbiological Properties, 2ndEd. Soil Sci. Soc. Am. Inc.
Madison, WI, USA.
Smukler, S.M., L.E. Jackson, L. Murphree, R. Yokota, S.T. Koike, and R.F. Smith. 2008. Transition to large-scale organic vegetable production in the Salinas Valley, California. Agriculture, Ecosystems and Environment 126:168-188
Soil Survey Staff. 2003. Key to Soil Taxonomy. USDA. Natural Recources Conservation Services (NRCS). Ninth Edition, 2003.
Washington, D.C.
Sulaeman, Suparto and Eviati. 2005. Petunjuk Teknis Analisis Kimia Tanah, Tanaman, Air dan Pupuk. Balai Penelitian Tanah, Bogor. (In Indonesian).
Watson, C.A., H. Bengtsson, M. Ebbesvik, A.K. Loes, A. Myrbeck, E. Salomon, J. Schroder, and E.A. Stockdale, E.A., 2002. A review of farm-scale nutrient budgets for organic farms as a tool
for management of soil fertility. Soil Use Manage. 18:264-273.
Widowati, L.R., D. Setyorini and W. Hartatik W. 2007. Aplikasi pupuk organik pada tanah Andisol Cisarua bagi pertumbuhan tanaman sayuran organic (Effetcs of organic fertilizers on vegetable growth in Andisol of Cisarua. IXthNational Congress of
Indonesian Society of Soil Science, 5-7 Desember, 2007.
Yogyakarta.Indonesia. (InIndonesian).
Wong, J.W.C., K.K. Ma, K.M. Fang, and C. Cheung. 1999.
Utilization of a manure compost for organic farming in Hongkong.
Bioresource Technology 67:43-46.
농경지내 유입된 다양한 양분원의 양분수지에 대한 정보는 농경지의 지속성을 평가하는데 매우 중요한 요인이 다. 본 연구는 질소, 인산 및 칼리의 양분수지를 알아보기 위하여 2005년부터 2007년까지 5작기 동안 인도네시 아 서자바섬 Eutric Hapludand에 있는 채소유기재배포장에서 수행되었다. 유기자원으로 우분, 염소분, 계분 및 마분 등 가축분퇴비, 티토니아, 식물잔사 및 크로타라리아 등 10개의 처리를 완전임의구획배치 3반복으로 하였 으며, 유기자원의 시용량은 작물반응에 따라 매 작기별로 달리 처리되었다. 가축분퇴비를 ha당 20톤 이상 시용 하였을 때, 질소, 인산 및 칼리에 대하여 양의 양분수지를 보였다. 식물잔사를 ha당 20∼25톤 또는 티토니아 퇴 비를 ha당 5톤 시용하였을 때, 칼리는 음의 양분수지를 나타냈다. 토양 중 유효인산함량은 ha당 25톤 이상의 가축분 퇴비처리에서 증가하였으며, 특히 계분퇴비구에서 가장 높게 나타났다. 결국, 작물의 수량은 질소, 인산 및 칼리함량이 높았던 계분퇴비구에서 가장 높았으며, 식물잔사처리구에서 가장 낮았다. 가축분퇴비의 ha당 12.5톤 시용, 가축분퇴비(12.5톤/ha)와 티토니아 혼합처리 및 티토니아와 식물잔사 혼합퇴비처리구의 작물수량 은 ha당 25톤의 가축분퇴비를 시용한 처리구와 비교하였을 때 현저히 감소하는 경향을 보였다. 장기적인 관점 으로 볼 때, ha당 25톤의 우분, 염소분 및 마분퇴비 또는 ha당 20톤의 계분퇴비 시용은 유기농 채소생산을 위 해 필요로 하는 토양의 비옥도를 유지하는 것으로 판단되었다.
유기자원에 따른 양분수지 및 작물생산
Fahmuddin Agus
1,*·Diah Setyorini
1·Wiwik Hartatik
1·이상민
2·성좌경
2·신재훈
21인도네시아 토양연구소, 2국립농업과학원