Ⅰ. 서론
신재생 발전원은 다수의 발전기와 선로가 연계되 어 계통에 연계된다. 다수의 신재생 전원, 선로, 변 압기 등을 계획 DB에 반영하기 위해서는 기존 설 치 신재생 전원 및 향후 설치되는 신재생 전원 정 보를 필요로 한다. 이러한 신재생 전원 기별 정보 를 바탕으로 개별 발전기 모델링 후 계획 DB 반영 시 수천 개의 발전기가 추가된다. 따라서 본 논문 에서는 이런 단점을 보완하기 위한 대안연구를 진 행하였다. 대안연구는 신재생 발전원 Aggregation 방식을 따른다.
Ⅱ. 본론
1. 신재생 발전원 Aggregation 방식
신재생 전원에 대한 Aggregation 수행 후 해당 정보를 계통 DB에 반영하여 다수의 신재생 전원을 등가 발전기 모델로 구성하여 DB에 반영한다. 등 가 신재생 발전기 시스템은 등가 발전기, 등가 승 압변압기, Collector 선로, 연계용 변압기, 연계용 선로 및 무효전력 보상기로 이루어진다. 다수의 신 재생 발전기를 1기 발전기 및 승압변압기로 모델링 후 연계하기 위해서는 Collector 모델(개별 연계 선 로 정보 등가화 정보)이 필요하다. 다수의 선로로
신재생에너지 확대에 따른 전력계통 해석에 관한 연구
A study on the analysis of power system due to the
expansion of renewable energy
신 해 수*, 조 윤 성*★ Hae-Su Sin*, Yoon-Sung Cho*★
Abstract
This paper performs Agregation for supplementing the additional generator when reflecting the plan DB based on a number of renewable power sources, line and transformer data. In this study, modeling of a line and a generator through a Collector method and a Step-Up-Transformer among Aggregation execution methods is conducted.
요 약
본 논문은 다수의 신재생 전원, 선로 및 변압기 데이터를 바탕으로 계획 DB 반영 시 추가되는 발전기 보완을 위한 Aggregation을 수행한다. 본 연구에서는 Aggregation 수행방식 중 Collector 방식과 Step-Up-Transformer를 통한 선로 및 발전기 모델링을 하여 사례연구를 진행한다.
Key words
:
Renewable Energy, Aggregation, Collector Method, Step-Up-Transformer, Simulation* Dept. of Electronics Engineering, Daegu Catholic University
★ Corresponding author
E-mail:[email protected], Tel:+82-53-850-2780
※ Acknowledgment
This paper is supported by the research fund of the Catholic University of Daegu in 2018.
Manuscript received Sep. 6, 2018; revised Sep. 18, 2018; Accepted Sep. 18, 2018
This is an Open-Access article distributed under the terms of the Creative Commons Attribution Non-Commercial License (http://creativecommons.org/licenses/by-nc/3.0) which permits unrestricted non-commercial use, distribution, and reproduction in any medium, provided the original work is properly cited.
ISSN:1226-7244 (Print)
ISSN:2288-243X (Online) j.inst.Korean.electr.electron.eng.Vol.22,No.3,729∼732,September 2018
논문번호 18-03-30 http://dx.doi.org/10.7471/ikeee.2018.22.3.729
208
(729)
A study on the analysis of power system due to the expansion of renewable energy 209
계통에 연계된 신재생 발전기의 등가화된 1기의 선 로로 모델링하기 위해서 선로를 1개의 등가 임피던 스로 계산한다. 신재생 발전원 Collector 등가화 방 식은 그림 1 및 수식(1)(2)을 따른다.
Fig. 1. Equivalent collector method using line model.
그림 1. 선로 모델을 이용한 등가 Collector 방식
(1)
(2)
신재생 전원 연계에 필요한 변압기의 등가 파라 미터 산정 방식은 그림 2 및 수식(3)(4)를 따른다.
Fig. 2. Equivalent transformer modeling method for renewable power supply connection
그림 2. 신재생 전원 연계용 등가 변압기 모델링 방식
(3)
× (4) 2. 중장기 DB 신재생 발전원 모델
본 연구에서는 신재생 발전원은 전압제어 모드 신재생 발전기로 모델링하고 기타 신재생 발전기 는 일반 발전기로 모델링하였다. 전압제어모드는 표 1에 명시되어 있다.
Table 1. Voltage control method.
표 1. 전압제어 방식
Mode 3
Control Mode Voltage Control
PF Control Power factor input, generator target voltage maintenance Ground-fault reactive power output Voltage Operation within generator terminal voltage and
surrounding voltage range
Reactive power reactive power output in some or many areas plan Reactive power output Generator terminal
voltage rise
Fig. 3. Power factor control and voltage control setting screen.
그림 3. 역률제어 및 전압제어 설정 화면
제어 모드 설정은 그림 3과 같이 발전기 모델에서 Wind Control Mode를 2(+, - Q limits based on WPF) 또는 3(Fixed Q based on WPF)으로 설정 할 수 있다.
가. 발전기 내부 Step-Up-Transformer 구성 발전기 연계 시 신설모선 수 감축을 위해 변압기 를 발전기 내부 Step-Up-Tr로 모델링한다. 발전기 내부 승압변압기 구성은 그림 4와 같다.
Fig. 4. Generator Step-Up-Transformer Configuration.
그림 4. 발전기 내부 Step-Up-Transformer 구성
(1) 조류계산 측면
조류계산 시 변압기 내부 임티던스로 인한 무효 전력 손실을 발전기 무효전력 상한 및 하한 수정으 로 조성한다. Wind Control Mode 적용시에는 내부 임피던스 고려없이 역률내 동작한다. 조류계산 측 면의 계산식은 수식(5)(6)을 따른다.
limlim× (5)
limlim× (6) (2) 고장계산 측면
고장계산 시 변압기 임피던스는 100MVA로 이를 발전기 내부 임피던스로 환산하여 적용해야 한다.
Wind Control Mode 적용과 상관없이 고장계산 시 동일하게 적용된다. 고산계산 측면의 계산식은 수 식(7)을 따른다.
×
(7)
(730)
210 j.inst.Korean.electr.electron.eng.Vol.22,No.3,729∼732,September 2018
3. Aggregation Flow Chart
Fig. 5 Generator Aggregation Construction Procedure.
그림 5. 발전기 Aggregation 구축 절차
그림 본 논문은 송배저전 전기설비 정보를 바탕 으로 신재생 전원의 Aggregation을 수행하였다.
Aggregation 수행 순서도는 그림 5과 같다.
Ⅲ. 사례연구 및 결론 가. 시험 계통 검증
Fig. 6. Generator External Step-Up-Transformer Test System Diagram.
그림 6. 발전기 외부 Step-Up-Transformer 시험계통
Fig. 7. Generator External Step-Up-Transformer Test System Diagram.
그림 7. 발전기 내부 Step-Up-Transformer 시험계통
그림 6, 7의 발전기 외부 및 내부 Step-Up- Transformer 시험계통 검증을 통해 발전량, 선로 무효전력, 모선전압 Set-Voltage, 발전모선 및 부 하모선의 전압이 같은 결과를 확인하였다.
나. 신재생 모델링 모의 (1) Case1: Mode2, 10.9km
Mode2의 조류계산 결과 최저전압은 area1 4개
모선에서 0.9235, area2 2개 모선에서 0.95의 값을 가지고, 최고전압은 area3 주변 7개 모선에서 1.0568, area4에서 1.0538의 값을 가진다. 변압기 탭 비율 및 조상설비 초기값 조정은 적용하지 않는다. 전압별 조류계산 결과값은 표 2, 그림 8, 9에 나타나있다.
Table 2. Comparison of Powerflow Calculation by voltage (Case1).
표 2. 전압별 조류계산 비교( Case1)
bus num
base kV
Voltage[pu]
Before input
Voltage[pu]
After input Difference
1 765 1.0369 1.0364 0.0005
2 765 1.0223 1.0210 0.0013
3 765 1.0213 1.0192 0.0021
4 765 1.0425 1.0422 0.0003
5 765 1.0373 1.0370 0.0003
6 765 1.0458 1.0457 1E-04
7 765 1.0240 1.0241 1E-04
8 765 1.0246 1.0242 0.0004
9 765 1.0233 1.0199 0.0034
10 765 1.0277 1.0264 0.0013
Fig. 8. Comparison of Powerflow calculation by voltage (345kV).
그림 8. 전압별 조류계산 비교(345kV)
Fig. 9. Comparison of Powerflow calculation by voltage (154kV).
그림 9. 전압별 조류계산 비교(154kV)
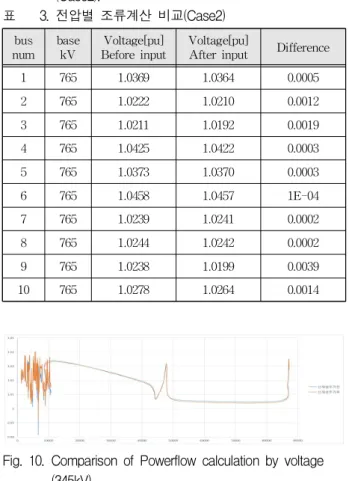
(2) Case2: Mode2, ZBR
Mode2의 조류계산 결과 최저전압은 area1 4개 모 선에서 0.9225, area2 2개 모선에서 0.95의 값을 가 지고, 최고전압은 area3 주변 7개 모선에서 1.0572,
(731)
A study on the analysis of power system due to the expansion of renewable energy 211
area4에서 1.0548의 값을 가진다. 변압기 탭 비율 및 조상설비 초기값 조정은 적용하지 않는다. 전압별 조류계산 결과값은 표 3, 그림 10, 11에 나타나있다.
Table 3. Comparison of Powerflow Calculation by voltage (Case2).
표 3. 전압별 조류계산 비교(Case2)
bus num
base kV
Voltage[pu]
Before input
Voltage[pu]
After input Difference
1 765 1.0369 1.0364 0.0005
2 765 1.0222 1.0210 0.0012
3 765 1.0211 1.0192 0.0019
4 765 1.0425 1.0422 0.0003
5 765 1.0373 1.0370 0.0003
6 765 1.0458 1.0457 1E-04
7 765 1.0239 1.0241 0.0002
8 765 1.0244 1.0242 0.0002
9 765 1.0238 1.0199 0.0039
10 765 1.0278 1.0264 0.0014
Fig. 10. Comparison of Powerflow calculation by voltage (345kV).
그림 10. 전압별 조류계산 비교(345kV)
Fig. 11. Comparison of Powerflow calculation by voltage (154kV).
그림 11. 전압별 조류계산 비교(154kV)
다. 결론
본 논문에서는 Mode 2(전압제어 방식)의 신재생 모델링에 대한 모의 연구를 진행하였다. Case1의 경우 다수의 신재생 전원이 진상 운전, Case2의 경 우 일분 신재생 전원이 진상 운전을 하였다. 다음 연구에서는 Mode 3 역률제어 방식에 대한 연구를 수행할 것이다.
References
[1] Study of the Integration of the Lubbock Power
& Light System into the ERCOT System, ERCOT, June 9, 2016.
[2] World Energy Perspectives 2016, “Variable Renewables Integration in Electricity Systems:
How to Get it Right,” https://www.worldenergy.org/
news-and-media/news/variable-renewables-inte gration-in-electricity-systems-how-to-get-it-right/
[3] NREL, “Wind Power Plant Modeling Dynamic Model Data,” 2009.
[4] WECC, “Generic Solar Photovoltaic System Dynamic Simulation Model Specification:, 2012.
[5] WECC Modeling and Validation Working Group, “WECC Wind Plant Dynamic Modeling Guidelines,” 2014.04.
[6] WECC Modeling and Validation Working Group, “WECC Solar Plant Dynamic Modeling Guidelines,” 2014.04.
[7] PSS/E 34 Manual “Operation Manual” Siemens PTI.
[8] PSS/E 34 Manual “Application Manual” Siemens PTI.
BIOGRAPHY
Hae-Su Sin4 (Member)
2018 : BS degree in Electrical
Engineering, Daegu Catholic University.
She is presently a master course in the Department of Electronic and Electrical Engineering, Deagu Catholic University.
Yun-Sung Cho (Member)
2008 : He received PhD degree in electrical engineering from Korea universit
He is presently an assistant professor in the Department of Electronic and Electrical Engineering, Deagu Catholic University
2012~2015 : Research Engineer, LS Industrial Systems
(732)