ISSN 1225-7591(Print) / ISSN 2287-8173(Online)
Spark Plasma Sintering of the Ni-graphite Composite Powder Prepared by Electrical Explosion of Wire in Liquid and Its Properties
Minh Thuyet-Nguyen a and Jin-Chun Kim b, *
a
School of Materials Science and Engineering, Hanoi University of Science and Technology, No 1, Dai Co Viet, Hai Ba Trung, Hanoi 100000, Vietnam
b
School of Materials Science and Engineering, University of Ulsan, 93 Daehak-ro, Nam-gu, Ulsan 44610, Republic of Korea (Received February 17, 2020; Revised February 21, 2020; Accepted February 21, 2020)
...
Abstract In this work, the electrical explosion of wire in liquid and subsequent spark plasma sintering (SPS) was introduced for the fabrication of Ni-graphite nanocomposites. The fabricated composite exhibited good enhancements in mechanical properties, such as yield strength and hardness, but reduced the ductility in comparison with that of nickel.
The as-synthesized Ni-graphite (5 vol.% graphite) nanocomposite exhibited a compressive yield strength of 275 MPa (about 1.6 times of SPS-processed monolithic nickel ~170 MPa) and elongation to failure ~22%. The hardness of Ni- graphite composite had a value of 135.46 HV, which is about 1.3 times higher than that of pure SPS-processed Ni (105.675 HV). In terms of processing, this work demonstrated that this processing route is a novel, simple, and low-cost method for the synthesis of nickel-graphite composites.
Keywords: Nanocomposite, Nickel, Graphite nanosheets, Mechanical properties, Electrical explosion of wire
...
1. Introduction
Carbonaceous nanomaterials, including carbon nano- tubes (CNTs), graphene and graphite nanosheet have remarkable potentials about mechanical and physical properties that could be listed as high mechanical strength, high elastic modulus as well as the high electri- cal and thermal conductivity material, which makes them become promising candidates for structural engineering and functional device applications [1]. Graphite recently has attracted considerable attention not only as a cost- effective substitute for carbon nanotubes but also enhance the mechanical properties, corrosion resistance and lighten the weight of parts in various industrial applica- tions [2]. Moreover, because of the excellent thermal conductivity, the graphite helps to dissipate the heat, therefore, metal-graphite composites are widely used for thermal management components in electronic devices.
In addition, metal matrix-graphite composites with the
magnetic matrices are promising materials due to the high potentials for applying in the magnetic field such as recording devices, magnetic shielding [3-6]. Among many kinks of metal-graphite composites, Ni-graphite composites are widely used in many applications such as conductive fillers [7], self-lubrication parts for automo- tive industry and tribological engineering parts [8, 9]. It was also used in electromagnetic interference (EMI) gas- kets, microwave absorber application [10] because of the positive characteristics which were the combination of thier components such as the good thermal, electrical conductivity and magnetic properties of nickel and the low thermal expansion coefficient, high lubrication prop- erties of graphite [11, 12]. Up to now, Ni-graphite com- posites have been mainly used in Ni-coated graphite powder type which was usually fabricated by using chemical and physical techniques such as oxidation and reduction methods [13, 14], or electroless deposition in alkaline coating bath [10, 15, 16]. Ni nanoparticles and
- M. Thuyet-Nguyen: 전임강사, 김진천: 교수
*Corresponding Author: Jin-Chun Kim, TEL: +82-52-712-8061, FAX: +82-52-259-1688, E-mail: [email protected]
Ni coated graphite composite were also widely used in coating or thin film types which have been applied in many applications requiring friction and wear resistance behavior [11, 17]. In term of bulk materials, the Ni- graphite composites have received less attention. They were typically prepared by a powder metallurgy (PM) process [8, 9, 18, 19]. However, the PM has certain lim- itations that primarily related to the poor affinity between Ni and graphite materials. This was not only led to the rising of weak interfaces between them but also negative effects on the structural, mechanical and magnetic prop- erties of their composites. In addition, the expensive price of the initial powder materials is also known as a disad- vantage of the PM process. Therefore, new methods for synthesis of this composite type have still got a lot of attention from researchers and manufacturers.
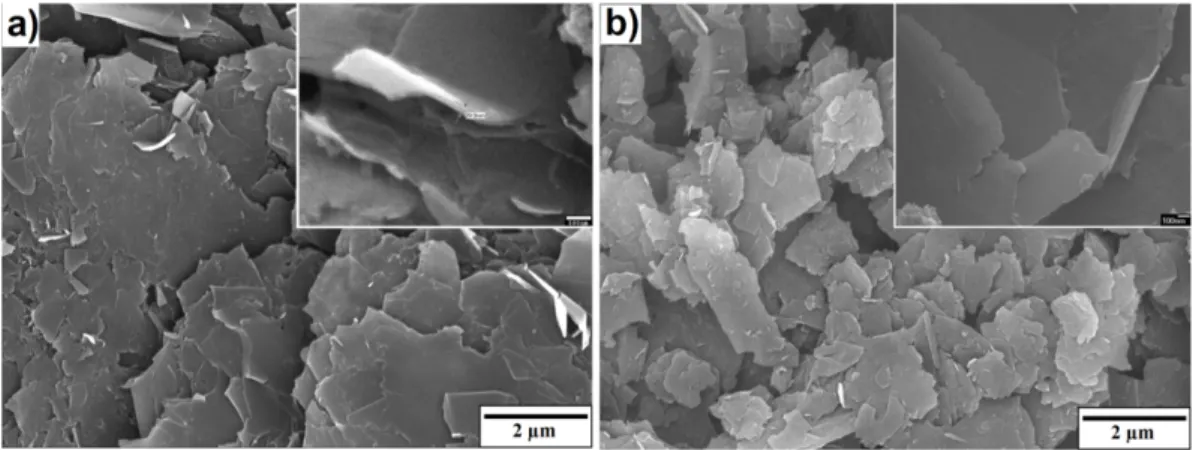
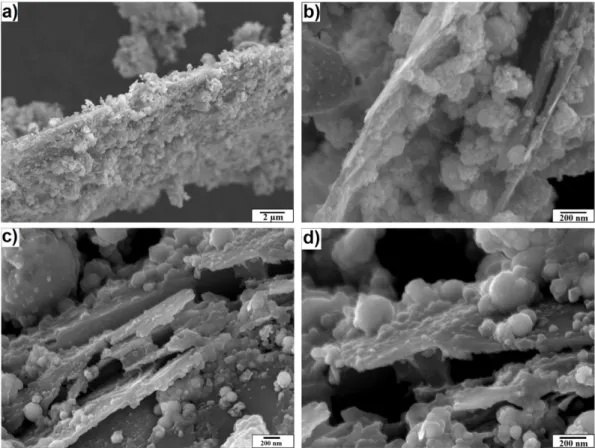
In this work, we present a new processing route which is the combination of EEW, ultrasonication and SPS methods for synthesizing the Ni-graphite nanocompos- ites. It is noted that the EEW process has been widely used to fabricate various types of nanosized metallic par- ticles as well as metallic alloyed powders. In addition, the electrical conductivity of graphite enables the EEW to produce nanosized graphite powder from graphite rods. Based on that concept, in this work, Ni-graphite nanocomposite powders were firstly fabricated by the EEW, subsequently sintered by the spark plasma sinter- ing (SPS) process to get the bulk specimens. The proper- ties of the as-synthesized composites include phases, mechanical were investigated then.
2. Experimental
Graphite rods with a diameter of 0.5 mm and Ni wires (purity of 99%) with a diameter of 0.25 mm were used in this work. Before exploding in EEW, the graphite rods were treated with a solution of nitric acid for 12-24 hours, then they were washed with deionized water and ethanol for several times and dried at 60
oC for 5 hours.
The dried graphite rods were exploded in ethanol to pro- duce the graphite suspension. This suspension was ultra- sonicated for about 1 hour to obtain the better homo- genous. Subsequently, EEW was continuously performed to explode Ni wires (0.25 mm diameter and 40 mm length) in the as-prepared graphite suspension to fabri-
cate the Ni-graphite composite. The explosion times of the graphite rod and Ni wires were calculated based on the volume fraction of graphite and Ni in the desired composite following the formulas (1), (2) and (3).
According to these formulas, the ratio x/y is obviously calculated. Thus, with each value of x that we picked up, there is a correlative value of y. Therefore, the number of the explosion was determined. In this study, the volume fraction of Ni and graphite in their composite was 95 vol.% and 5 vol.%, respectively.
V
graphite= (1)
V
nickel= (2)
(3) Where: V
graphiteand V
nickelare volume fraction of graph- ite and nickel in the desire composite; R
1- radius of graphite rod; R
2- is radius of Ni wire; L- the required length for using in EEW and x, y are the number of explosions of graphite rod and Ni wirein EEW, respec- tively.
After the explosion the as-exploded Ni-graphite com- posite powders were collected from their suspension and drying at 80
oC under vacuum. Then, a heat treatment stage in H
2atmosphere condition for 2 hours at 400
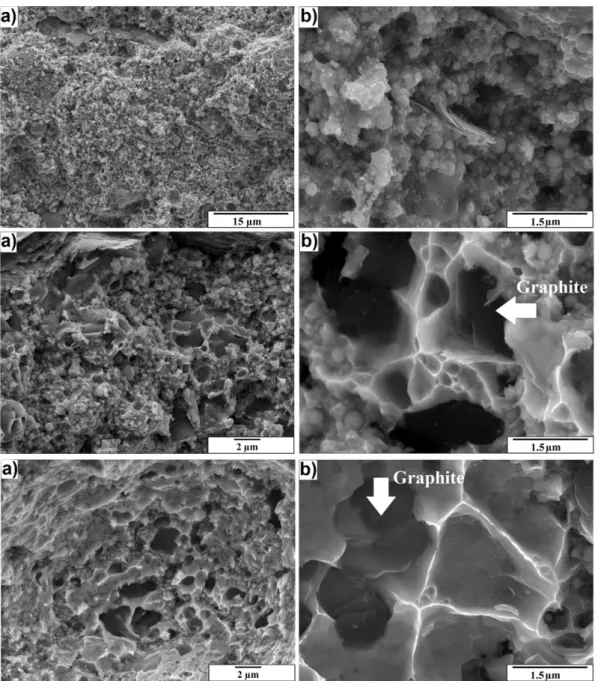
oC was used to complete the synthesis of Ni-graphite com- posite powders. TheNi-graphitenano composite powders were then consolidated in the SPS equipment (Mod.
115S, Sumitomo Coal Mining Co.Ltd., Japan) at various temperatures (900
oC, 1000
oC and 1100
oC) in vacuum condition under a pressure of 50 MPafor 10 minutes. The heating rate of SPS process was maintained at 50
oC/min.
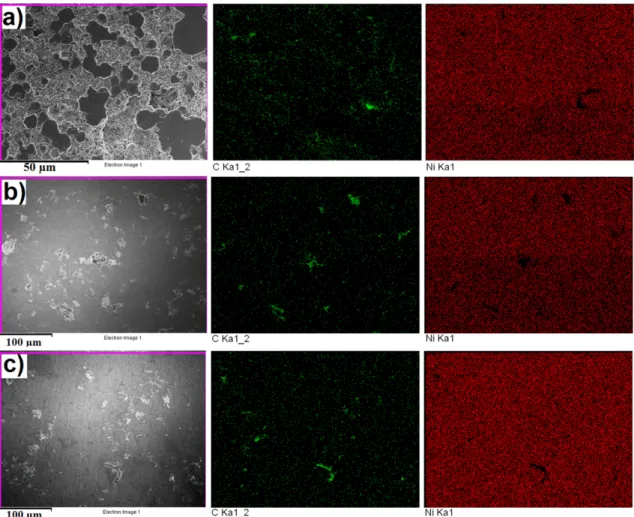
A JSM-6500F field emission scanning electron micro- scope (FE-SEM) and the X-ray diffraction (XRD) analy- ses (RigakuUltima III) were employed to observe the surface morphology, phases and microstructures of both powders and bulk samples. The density of the sintered specimens was measured by the Archimedes method.
The microhardness was measured by using a standard Vickers microhardness tester (Mitutoyo MVK-H1) under a load of 100 g for 15 seconds. In order to obtain a statis- tical distribution which reliably depicts the hardness of the sample, 10 times measurements were performed on
π R
12