Corresponding author Ji Hee Hong, M.D., Ph.D.
Department of Anesthesiology and Pain Medicine, Keimyung University Dongsan Hospital, 1035 Dalgubeol- daero, Dalseo-gu, Daegu 42601, Korea
Tel: 82-53-258-7767 Fax: 82-53-258-6288 E-mail: [email protected]
Background: Robot-assisted laparoscopic radical prostatectomy is an advanced and popu- lar surgical technique. However, increased intracranial pressure which is caused by CO
2pneumoperitoneum and Trendelenburg position is the main cerebrovascular effect. Mea- surement of optic nerve sheath diameter using ocular ultrasound is a noninvasive and reli- able method for the assessment of intracranial pressure. The primary endpoint of this study was to identify whether low blood pressure regulation has any benefit in attenuating an in- crease of optic nerve sheath diameter during robot-assisted laparoscopic radical prostatec- tomy.
Methods: Optic nerve sheath diameter and cerebral oxygen saturation were measured at baseline (supine position), one and two hours after pneumoperitoneum and Trendelenburg position respectively, and after return to supine position in normal (n = 27) and low blood pressure groups (n = 24).
Results: Mean optic nerve sheath diameter values measured at one and two hours after pneumoperitoneum and Trendelenburg position were significantly increased compared to the baseline value (P < 0.001 in normal blood pressure group; P = 0.003 in low blood pres- sure group). However, the mean optic nerve sheath diameter and cerebral oxygen saturation measured at any of the time points as well as degrees of change between the two groups did not show any significant changes. The peak values of optic nerve sheath diameter in normal and low blood pressure groups demonstrated 14.9% and 9.2% increases, respec- tively.
Conclusions: Low blood pressure group demonstrated an effect in maintaining an increase of optic nerve sheath diameter less than 10% during CO
2pneumoperitoneum and Trende- lenburg position.
Keywords: Blood pressure; Cerebral oxygen saturation; Optic nerve sheath diameter; Pneu- moperitoneum; Trendelenburg position.
Comparison of the effects of normal and low blood pressure regulation on the optic nerve sheath diameter in robot assisted laparoscopic radical prostatectomy
Ji Hoon Park, Ji Hee Hong, Ji Seob Kim, and Hyung Jun Kim
Department of Anesthesiology and Pain Medicine, Keimyung University Dongsan Hospital, Daegu, Korea
Received December 15, 2020 Revised February 22, 2021 Accepted February 22, 2021
This is an Open Access article distributed under the terms of the Creative Commons Attribution Non-Commercial License (http://creativecommons.org/licenses/by-nc/4.0) which permits unrestricted non-commercial use, distribution, and reproduction in any medium, provided the original work is properly cited.
Copyright © the Korean Society of Anesthesiologists, 2021
CC INTRODUCTION
Robot-assisted laparoscopic radical prostatectomy (RAL- RP) is an advanced and popular surgical technique with benefits of reduced intraoperative bleeding, less postopera- tive pain, good surgical field and shorter hospital stay [1,2].
However, RALRP requires CO
2pneumoperitoneum with steep Trendelenburg position to enhance the clarity of the surgical field, which causes unwanted hemodynamic, respi- ratory, and cerebrovascular events.
Among such adverse events, increased intracranial pres- sure (ICP) which is caused by CO
2pneumoperitoneum and Trendelenburg position either independently or in conjunc- tion is the main cerebrovascular effect [1,3–5]. Early diagno- sis and proper management of increased ICP play an essen- tial role in preventing further brain damage. In spite of the importance of increased ICP during surgery, it is rarely monitored intraoperatively due to the invasiveness of the ICP measurement. Direct measurement of ICP involves measuring pressure in the ventricle or the brain parenchyma directly [6]. However, such an invasive method makes the popular use of ICP monitoring difficult. An alternative non-invasive method for ICP assessment is using optic nerve sheath diameter (ONSD) measurement by ultraso- nography [6–8].
Measurement of ONSD using ocular ultrasound is a non- invasive and reliable method for the assessment of ICP. Nu- merous studies have proven that ONSD measured by ocular ultrasound correlates well with the degree of ICP changes [9–13]. Also, this measurement technique has shown excel- lent intra-observer and inter-observer reproducibility (0.25–
0.3 mm) [14,15].
Previous study which investigated the elevation of ICP during RALRP suggested that postoperative ONSD changes were significantly associated with regulation of mean arterial pressure (MAP) [2]. According to this study, a 10 mmHg in- crease in MAP resulted in a 0.023 mm increase in postopera- tive ONSD. However, only a small number of participants were studied to identify this correlation between MAP and ONSD. Moreover, this study did not demonstrate any range or degree of MAP regulation during the entire study period [2].
Cerebral circulation can be assessed by measurement of regional cerebral oxygen saturation (rSO
2) values using near infrared spectroscopy. Previous study which evaluated changes in rSO
2during RALRP demonstrated that changes of rSO
2correlated with MAP and PaCO
2[16].
The purpose of this study was to identify whether low
MAP regulation has any benefit in attenuating an increase in ONSD. The primary endpoint of this study was to compare the differences in ONSD changes during surgery between the normal and hypotensive groups. The secondary end- point of this study was to compare the changes of ONSD and rSO
2when MAP was tightly regulated between pressure ranges corresponding to normal (95–105 mmHg) and low (65–75 mmHg) during RALRP.
MATERIALS AND METHODS
Subjects
This prospective and randomized study was approved by the Institutional Review Board (no. 19-07-049) of our institu- tion. Written and verbal information about the potential benefits and risks of the study were provided. All partici- pants provided written informed consent. This study was registered before patient enrollment at clinicalTrials.gov (NCT04339244, Date of registration: 6th-April-2020).
Patients with American Society of Anesthesiologists class I to II who were scheduled for an elective RALRP using the da Vinci
Sirobot system (Intuitive Surgical Inc., USA) between April 2020 and September 2020 were included in this study.
Patients with preexisting ophthalmic and cerebrovascular disease or previous history of brain or ophthalmic surgery were excluded. Patients with a previous history of uncon- trolled hypertension in spite of using antihypertensive med- ication were excluded.
Anesthetic management
The participants arrived in the operating room without premedication. Electrocardiography, pulse oximetry and noninvasive blood pressure monitoring were applied. Gen- eral anesthesia was induced with propofol 1.5 mg/kg, rocu- ronium bromide 0.9 mg/kg and remifentanil 1 μg/kg. After successful tracheal intubation, mechanical ventilation of volume control mode was performed with a tidal volume of 8–10 ml/kg and an adjusted respiratory rate to maintain an end-tidal CO
2(EtCO
2) of 30 to 35 mmHg during surgery.
For the purpose of continuous arterial blood pressure
monitoring and sampling for arterial blood gas analysis, radi-
al artery cannulation was performed. Continuous cardiac
output was measured directly from this arterial line
(Flotrac
TM, Edward Life Science, USA). Anesthesia was main-
tained with 1 to 1.5 minimum alveolar concentration of sevo-
flurane in 60% oxygen/air and remifentanil 0.05 to 0.3 μg/kg/
min. An adequate anesthetic depth was maintained using a SedLine monitor (SedLine
TM, Masimo Corp., USA) and a range of 25–50 patient state index was targeted during sur- gery. An rSO
2was assessed during surgery. Cerebral oximeter sensors were applied 2 cm above the eyebrow on the left and right sides of the forehead bilaterally before induction of an- esthesia. The value of rSO
2was continuously monitored us- ing O3 regional oximetry (Root ® , Masimo Corp., USA).
CO
2was infused with an intra-abdominal pressure of 15–
20 mmHg using the da Vinci
Sirobot system while the pa- tient’s position was supine. Trendelenburg position was ap- plied to 30-degrees. During the period of CO
2pneumoperi- toneum, minute ventilation was regulated to maintain an EtCO
2of 30 to 35 mmHg by adjusting the respiratory rate.
Group allocation
This study focused on measuring the ONSD using ocular ultrasonography under different MAP regulation. Partici- pants in the normal and low blood pressure groups were ran- domly assigned to be controlled to either a MAP of 95–105 mmHg (normal blood pressure group) and 65–75 mmHg (low blood pressure group) using a computer-generated ran- domization table. MAP was mainly regulated using the target concentration of remifentanil. In the low blood pressure group, MAP was regulated between 65–75 mmHg using remifentanil at 0.2 to 0.3 μg/kg/min. In normal blood pres- sure group, MAP was regulated within 95–105 mmHg using remifentanil 0.05 to 0.2 μg/kg/min. Strict regulation of MAP in normal and low blood pressure groups was targeted. How- ever, transient MAP changes either above or below assigned pressure ranges for less than one minute were allowed with- out using any blood pressure regulating medications.
Measurement of ONSD
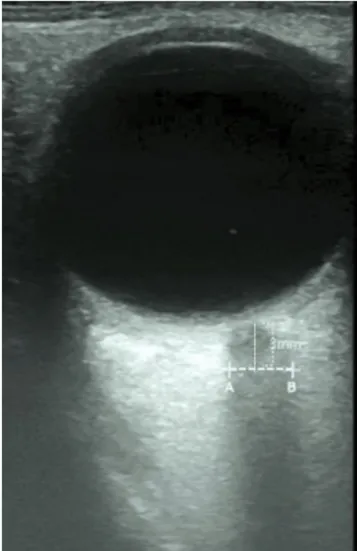
A single trained investigator with more than 200 scans of ONSD measurement and fully experienced with previous studies [1,17] conducted this ultrasonographic measure- ment. This investigator was blinded to the group assign- ment. Transorbital sonography using a hockey stick probe (Logiq S8, GE Healthcare, USA) was performed to measure ONSD. The power output was reduced (mechanical index, 0.2; thermal index, 0) to minimize the risk of ultrasound -induced eye injury. Participants were asked to close their eyes and a sterile gel was applied on each closed upper eye-
lid. The hockey stick probe was placed gently to minimize the exerted pressure on eyeball. The probe was moved using heel-toe method to capture the best axial image of the orbit in the plane of the optic nerve. The depth parameter was controlled within 3.0–4.0 cm. ONSD was measured 3 mm posterior to the optic nerve head (Fig. 1) [13,17,18]. ONSD images were obtained when the postural effects were stabi- lized with no further external stimuli.
Each ONSD was measured serially in each eye at the fol- lowing time points: awake state in supine position before anesthesia induction (baseline, T0), one hour after 30-de- gree Trendelenburg position with CO
2pneumoperitoneum (T1), two hours after 30-degree Trendelenburg position with CO
2pneumoperitoneum (T2), and 10 min after returning to supine position without CO
2pneumoperitoneum at the end of RALRP (T3).
Fig. 1. Measurement of optic nerve sheath diameter by ultrasonography. Axial images of the orbit were acquired in the plane of the optic nerve. Optic nerve sheath diameters were measured 3 mm posterior to the optic nerve head (A–B).
CC At each time point, to obtain more reliable value of ONSD, this measurement was performed twice on the right and twice on the left sides of the optic nerve, respectively. There- fore, the average of the four values was considered to be the final ONSD at each time point. If the measured ONSD was more than 5.5 mm which was the cut-off point used in a pre- vious study, such patients were considered to have increased ICP [12].
The ONSD, rSO
2, heart rate, mean arterial pressure and cardiac output were examined from T0 to T3. The parame- ters regarding respiratory mechanics and arterial blood gas analysis were examined from T1 to T3.
In addition, the Trendelenburg and pneumoperitoneum time, operation and anesthesia time, intraoperative blood loss, and volumes of administered fluid were recorded.
Statistical analysis
This study was designed to identify whether there would be any differences in ONSD according to MAP regulation.
Previous study demonstrated that a difference in ONSD >
0.5 mm (10% of mean ONSD in asymptomatic normal adults [mean ONSD 4.9 mm]) would be clinically relevant [12]. Giv- en a 5% two-tailed significance level, a power of 80% and a dropout rate of 15%, 24 patients per group were required to detect a mean difference of 0.5 mm between ONSD in nor- mal and low blood pressure groups.
All variables were reported as mean ± SD. Patient charac- teristics and operative data were compared by unpaired t-test. Except for ONSD and rSO
2, intergroup comparisons for repeated measures, including hemodynamic and respi- ratory parameters were performed by unpaired t-test with Bonferroni correction. Repeated ONSD and rSO
2measure- ments were analyzed by linear mixed models for random and fixed effects between the two groups. The Shapiro–Wil-
kes test was applied before performing the LMM and the variables were distributed normally.
Intergroup comparison of changes in ONSD over time was performed by group-by-time interaction. All statistical val- ues were two-tailed, and P values < 0.05 were considered to be statistically significant. Statistical evaluations were per- formed using SPSS version 22.0 (IBM Corp., USA).
RESULTS
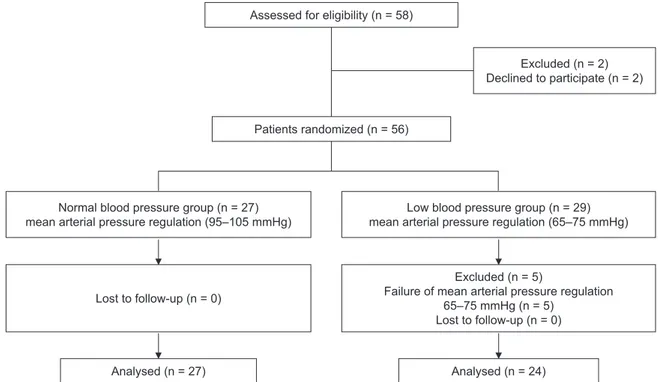
Eligibility was assessed in 58 patients and 51 of these pa- tients completed this study without dropout. Two patients refused to participate in this study and five patients were ex- cluded due to a failure of proper MAP regulation to the as- signed group. Therefore, final enrolled participants were 51 patients (Fig. 1). Patient characteristics and intraoperative data are described in Table 1.
Mean blood pressure of the low blood pressure group was significantly lower than the normal blood pressure group from T1 to T3 (Table 2, P = 0.001). Respiratory mechanics and arterial blood gas analysis did not show any significant changes between normal and low blood pressure groups (Table 3).
Both normal and low blood pressure groups showed sig- nificant increases of ONSD according to time. Mean ONSD values measured at T1 and T2 significantly increased com- pared to the baseline value at T0 (Table 4, P < 0.001 in nor- mal blood pressure group; P = 0.003 in low blood pressure group). However, the mean ONSD values measured at any of the time points and degrees of changes (T1-T0, T2-T0, and T3-T0) between two groups did not show any significant changes. Normal and low blood pressure groups showed peak value of ONSD at T2 and T1, respectively (Table 4, Fig. 2).
The peak value of ONSD in normal and low blood pressure groups demonstrated 14.9% (T2 vs. T0) and 9.2% (T1 vs. T0)
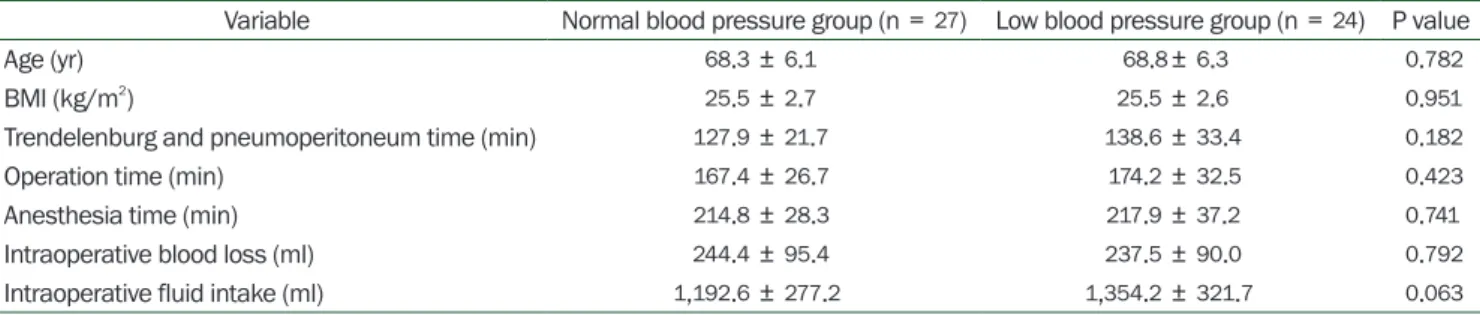
Table 1. Patient Demographics and Intraoperative Data Assigned to Normal Blood Pressure or Low Blood Pressure Group during Robot- assisted Laparoscopic Radical Prostatectomy
Variable Normal blood pressure group (n = 27) Low blood pressure group (n = 24) P value
Age (yr) 68.3 ± 6.1 68.8± 6.3 0.782
BMI (kg/m2) 25.5 ± 2.7 25.5 ± 2.6 0.951
Trendelenburg and pneumoperitoneum time (min) 127.9 ± 21.7 138.6 ± 33.4 0.182
Operation time (min) 167.4 ± 26.7 174.2 ± 32.5 0.423
Anesthesia time (min) 214.8 ± 28.3 217.9 ± 37.2 0.741
Intraoperative blood loss (ml) 244.4 ± 95.4 237.5 ± 90.0 0.792
Intraoperative fluid intake (ml) 1,192.6 ± 277.2 1,354.2 ± 321.7 0.063 Values are presented as mean ± SD. BMI: body mass index.
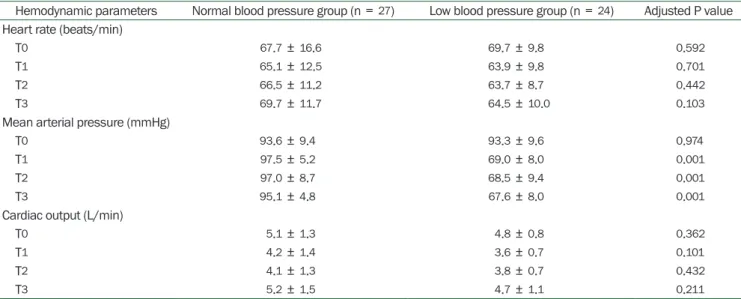
Table 2. Hemodynamic Parameters during Robot-assisted Laparoscopic Radical Prostatectomy in Normal Blood Pressure and Low Blood Pressure Groups
Hemodynamic parameters Normal blood pressure group (n = 27) Low blood pressure group (n = 24) Adjusted P value Heart rate (beats/min)
T0 67.7 ± 16.6 69.7 ± 9.8 0.592
T1 65.1 ± 12.5 63.9 ± 9.8 0.701
T2 66.5 ± 11.2 63.7 ± 8.7 0.442
T3 69.7 ± 11.7 64.5 ± 10.0 0.103
Mean arterial pressure (mmHg)
T0 93.6 ± 9.4 93.3 ± 9.6 0.974
T1 97.5 ± 5.2 69.0 ± 8.0 0.001
T2 97.0 ± 8.7 68.5 ± 9.4 0.001
T3 95.1 ± 4.8 67.6 ± 8.0 0.001
Cardiac output (L/min)
T0 5.1 ± 1.3 4.8 ± 0.8 0.362
T1 4.2 ± 1.4 3.6 ± 0.7 0.101
T2 4.1 ± 1.3 3.8 ± 0.7 0.432
T3 5.2 ± 1.5 4.7 ± 1.1 0.211
Values are presented as mean ± SD. Adjusted P value indicates the Bonferroni-corrected P value. T0, supine position before anesthesia induction (baseline); T1, 1 h after 30-degree Trendelenburg position with CO2 pneumoperitoneum; T2, 2 h after 30-degree Trendelenburg position with CO2 pneumoperitoneum; T3, 10 min after returning to supine position without CO2 pneumoperitoneum at the end of surgery.
Table 3. Respiratory Mechanics and Arterial Blood Gas Analysis during Robot-assisted Laparoscopic Radical Prostatectomy in Normal Blood Pressure and Low Blood Pressure Groups
Respiratory parameters Normal blood pressure group (n = 27) Low blood pressure group (n = 24) Adjusted P value Peak inspiratory pressure (cmH2O)
T1 23.3 ± 4.9 24.1 ± 3.5 0.512
T2 23.5 ± 3.8 24.1 ± 3.8 0.591
T3 14.7 ± 5.0 13.7 ± 1.9 0.373
Respiratory rate (beats/min)
T1 13.6 ± 1.4 13.5 ± 1.6 0.762
T2 14.6 ± 1.6 14.1 ± 2.0 0.261
T3 13.8 ± 1.7 14.1 ± 2.4 0.602
End tidal CO2 (mmHg)
T1 33.4 ± 4.1 32.9 ± 3.4 0.593
T2 34.6 ± 4.3 33.8 ± 4.5 0.524
T3 36 ± 4.5 36 ± 5.8 0.992
End tidal sevoflurane (%)
T1 1.8 ± 0.3 1.9 ± 0.5 0.991
T2 2.1 ± 0.5 2.2 ± 0.2 0.991
T3 2.3 ± 0.2 2.2 ± 0.2 0.992
PaCO2 (mmHg)
T1 41.1 ± 4.8 41.6 ± 3.8 0.992
T2 44.6 ± 4.9 42.9 ± 5.5 0.561
T3 43.2 ± 4.2 44.8 ± 8.1 0.361
PaO2 (mmHg)
T1 165.0 ± 22.5 165.6 ± 18.1 0.991
T2 182.6 ± 32.1 182.7 ± 28.5 0.992
T3 186.0 ± 28.5 186.1 ± 34.1 0.994
Values are presented as mean ± SD. Adjusted P value indicates the Bonferroni-corrected P value. T0, supine position before anesthesia induction (baseline); T1, 1 h after 30-degree Trendelenburg position with CO2 pneumoperitoneum; T2, 2 h after 30-degree Trendelenburg position with CO2 pneumoperitoneum; T3, 10 min after returning to supine position without CO2 pneumoperitoneum at the end of surgery.
CC
Table 4. Optic Nerve Sheath Diameter during Robot-assisted Laparoscopic Radical Prostatectomy in Normal Blood Pressure and Low Blood Pressure Groups
Optic nerve sheath diameter and
changes in diameter Normal blood pressure group (n = 27) Low blood pressure group (n = 24) Adjusted P value Optic nerve sheath diameter (mm)
T0 5.31 ± 0.48 5.33 ± 0.46 0.891
T1 6.0 ± 0.47* 5.82 ± 0.5† 0.631
T2 6.1 ± 0.59‡ 5.77 ± 0.47† 0.121
T3 5.87 ± 0.45 5.71 ± 0.57 0.772
Changes in optic nerve sheath diameter (mm)
T1-T0 0.69 ± 0.37 0.49 ± 0.50 0.213
T2-T0 0.79 ± 0.50 0.44 ± 0.50 0.142
T3-T0 0.56 ± 0.43 0.38 ± 0.61 0.681
Values are presented as mean ± SD. Adjusted P value indicates the Bonferroni-corrected P value. T0, supine position before anesthesia induction (baseline); T1, 1 h after 30-degree Trendelenburg position with CO2 pneumoperitoneum; T2, 2 h after 30-degree Trendelenburg position with CO2 pneumoperitoneum; T3, 10 min after returning to supine position without CO2 pneumoperitoneum at the end of surgery.
*T1 vs. T0, P < 0.001; †T1 vs. T0 and T2 vs. T0, P = 0.003; ‡T2 vs. T0, P = 0.006.
Fig. 2. CONSORT diagram of patient recruitment. CONSORT: consolidated standards of reporting trials.
Assessed for eligibility (n = 58)
Patients randomized (n = 56)
Normal blood pressure group (n = 27) mean arterial pressure regulation (95–105 mmHg)
Lost to follow-up (n = 0)
Analysed (n = 27)
Low blood pressure group (n = 29) mean arterial pressure regulation (65–75 mmHg)
Excluded (n = 5)
Failure of mean arterial pressure regulation 65–75 mmHg (n = 5)
Lost to follow-up (n = 0) Analysed (n = 24)
Excluded (n = 2) Declined to participate (n = 2)
increases, respectively. Twenty four patients (24/27, 88.8%)
in the normal blood pressure group and 16 patients (16/24, 66.6%) in the low blood pressure group showed a value of ONSD above 5.5 mm (P = 0.05; the cutoff value for predic- tion of increased ICP) [12], and these patients did not expe- rience a decrease of rSO
2or any neurologic complication.
The mean rSO
2values of the low blood pressure group showed higher values compared to normal blood pressure group from T0 to T3. However, this difference did not show
any significant changes (Table 5, Fig. 3). Neurologic compli- cations were not observed in any of the enrolled patients during the postoperative period in both groups.
DISCUSSION
The effect of CO
2pneumoperitoneum and steep Trende-
lenburg position during RALRP on ICP warrants a careful
consideration. In this study, an increase in ONSD of more
than 0.5 mm, which represents a 10.0% increase compared to supine position without pneumoperitoneum, was consid- ered to be the result of increased intracranial pressure [12].
The results of our study demonstrated that an increase of ONSD of 14.9% was observed during CO
2pneumoperitone- um and Trendelenburg position in the normal blood pres- sure group, while a 9.2% increase was seen in the low blood pressure group. In addition, the number of patients who showed an increase of ONSD above 10% was higher in the normal blood pressure group compared to the low blood pressure group. Mean values of ONSD and rSO
2during T0 to T3 did not show any significant difference between the two groups. If we consider an increase of ONSD more than 10%
predicts an increased ICP during CO
2pneumoperitoneum
and Trendelenburg position, the normal blood pressure group shows a higher probability of increased ICP than the low blood pressure group. In this study, we used an ONSD value of 5.5 mm as the cutoff for prediction of increased ICP although other study suggested it should be 5.8 mm [11].
Since ONSD values differ according to ethnicity [19], the re- sults obtained from a Caucasian population may not accu- rately reflect the association between increased ICP and ONSD in the Korean population. Therefore, we used the cut- off value of 5.5 mm as it was established among the Korean population [12].
ONSD increased due to steep Trendelenburg position and CO
2pneumoperitoneum during RALRP. The dural sheath of the optic nerve is in close contact with the CSF in the intra-
Table 5. Regional Cerebral Oxygen Saturation (rSO2) during Robot-assisted Laparoscopic Radical Prostatectomy in Normal Blood Pressure and Low Blood Pressure Groups
Regional cerebral oxygen saturation Normal blood pressure group (n = 27) Low blood pressure group (n = 24) Adjusted P value rSO2 (%)
T0 64.5 ± 5.3 65.8 ± 5.2 0.592
T1 66.7 ± 6.8 67.5 ± 4.9 0.901
T2 66.2 ± 5.9 68.8 ± 4.8 0.152
T3 67.3 ± 5.6 69.0 ± 5.4 0.564
Values are presented as mean ± SD. Adjusted P value indicates the Bonferroni-corrected P value. T0, supine position before anesthesia induction (baseline); T1, 1 h after 30-degree Trendelenburg position with CO2 pneumoperitoneum; T2, 2 h after 30-degree Trendelenburg position with CO2 pneumoperitoneum; T3, 10 min after returning to supine position without CO2 pneumoperitoneum at the end of surgery.
Fig. 3. Changes in optic nerve sheath diameter (A) and regional cerebral oxygen saturation (B) (rSO2) in normal (filled circle) and low blood pressure groups (open circle). Data are mean with SD. T0, supine position before anesthesia induction (baseline); T1, 1 h after 30-degree Trendelenburg position with CO2 pneumoperitoneum; T2, 2 h after 30-degree Trendelenburg position with CO2 pneumoperitoneum; T3, 10 min after returning to supine position without CO2 pneumoperitoneum at the end of surgery.
A
7
6.5
6
5.5
5
4.5 T0
Optic nerve sheath diameter (mm)
T1 T2 T3 T0
rSO2 (%)
T1 T2 T3
80 75 70 65 60 55 50
B
CC cranial subarachnoid space. Hence, any increase or decrease of ICP is directly transmitted to the CSF in the optic nerve sheath. The subarachnoid space surrounding the optic nerve sheath has an elastic trabecular structure [8,11,14]. It is most distensible 3 mm behind the papilla in the globe.
Due to such distensibility, the optic nerve sheath inflates within a few minutes of exposure to increased ICP [1,7,14,17]. The Trendelenburg position has an effect to pro- duce a moderate increase in ICP as seen with intracranial monitoring. CO
2pneumoperitoneum causes an increased intra-abdominal pressure. Such increases in intra-abdomi- nal pressure can impair CSF drainage with resultant eleva- tion of ICP [20]. In conjunction with increased intra-abdom- inal pressure, the elevated content of arterial CO
2during CO
2pneumoperitoneum increases the cerebral blood flow. As a result, ICP is expected to increase [1,3]. In this study, values of PaCO
2analyzed after pneumoperitoneum showed a ten- dency towards an increase. Hence, the increased PaCO
2might partially contribute to the increased ICP, although EtCO
2was near to normocapnia after adjusting for the respi- ratory rate.
The cerebral perfusion pressure (CPP) is known as MAP minus central venous pressure or ICP. If this equation was entirely true, ICP would equal to MAP-CPP implying no ve- nous involvement [21]. Therefore, we can assume that if CPP is constant, the low blood pressure group will have lower ICP than the normal blood pressure group. However, ICP has a dynamic component which is affected by the brain, in- tracranial blood flow, and CSF. The average male intracrani- al volume including brain and CSF is around 1,473 ml and the brain receives blood flow approximately 14% of cardiac output (700 ml/min). At any moment in time, the intracrani- al blood volume is 100–130 ml. Therefore, brain, blood flow, and CSF should be considered during regulation of ICP [20,21].
ICP is regulated by arterial and venous influence. Previous study suggested that vena caval pressure can reflect CSF pressure due to the lack of valves in the cranio-vertebral ve- nous system, and retinal venous distension could reflect in- tracranial venous pressure. ICP is affected by changes in vascular pressure especially with the greater importance of the venous system. Specifically, increasing central venous pressure results in increasing ICP when compliance is lost [1,16,20,21]. We assume that the effect of an attenuation in increase of ONSD in the low blood pressure group is related to lower intracranial vascular pressure compared to the nor- mal blood pressure group.
Cerebral oxygenation can be monitored by rSO
2and it re- flects cerebral perfusion. rSO
2is comprised of 25% arterial and 75% venous blood according to the manufacturer. Cere- bral blood volume changes with variation in PaCO
2[16].
Carbon dioxide insufflated abdominally during pneumo- peritoneum is absorbed into the systemic circulation and is exhaled with ventilation. We could observe a slight increase in PaCO
2during time points of T1 and T2 although it did not exceed 45 mmHg. In addition to this increase of PaCO
2, the steep head down tilt position is known to cause an increase in cerebral blood volume. Previous study measured cerebral blood volume using near-infrared time-resolved spectrosco- py. Cerebral blood volume increased to near 10% during head down tilt position compared to the supine position [22]. Our study showed changes in rSO
2over time, with a tendency to increase in both groups. Increased cerebral blood volume resulting from increased PaCO
2and steep head down tilt position might have resulted in a tendency for rSO
2to increase. However, this increase of rSO
2was with- in 5% in both groups. Similar to our study, changes in rSO
2were within 3% in previous study [22].
Our study includes several limitations. First, transient blood pressure changes above or below of target blood pres- sure were observed. However, the duration of such blood pressure change was within a minute. We assume that tran- sient blood pressure effect beyond the target blood pressure would not be so potent as to affect the overall results of this study. Second, the operation time of T2 varied depending on surgeon. Although T2 was defined as two hours after pneu- moperitoneum and Trendelenburg position, some cases of RALRP had to return to supine position before fulfilling the expected two hours. However, such cases had less than 15 min differences compared to the two-hour fulfilled T2.
In conclusion, both groups showed significant increases in ONSD during CO
2pneumoperitoneum and steep Trende- lenburg position compared to baseline. The low blood pres- sure group demonstrated an effect in maintaining an in- crease of ONSD less than 10 % during CO
2pneumoperitone- um and Trendelenburg position. However, mean values for ONSD and rSO
2during T0 to T3 did not show any significant differences between the two groups.
ACKNOWLEDGMENTS
This study was supported by Keimyung University Re-
search Grant of 2020.
CONFLICTS OF INTEREST
No potential conflict of interest relevant to this article was reported.
DATA AVAILABILITY STATEMENT
The datasets generated durig and/or analyzed during the current study are available from the corresponding author on resonable requet.
AUTHOR CONTRIBUTIONS
Data curation: Ji Hee Hong. Formal analysis: Ji Hee Hong, Ji Hoon Park. Funding acquisition: Ji Hee Hong. Methodolo- gy: Ji Hee Hong. Project administration: Ji Hee Hong. Writing - original draft: Ji Hee Hong. Writing - review & editing: Ji Hee Hong. Investigation: Ji Hee Hong, Ji Seob Kim, Hyung Jun Kim. Resources: Ji Hoon Park. Supervision: Ji Hee Hong.
ORCID
Ji Hoon Park, https://orcid.org/0000-0003-4776-5206 Ji Hee Hong, https://orcid.org/0000-0002-6679-3088 Ji Seob Kim, https://orcid.org/0000-0002-8273-8644 Hyung Jun Kim, https://orcid.org/0000-0002-6518-3755
REFERENCES
1. Kim MS, Bai SJ, Lee JR, Choi YD, Kim YJ, Choi SH. Increase in intracranial pressure during carbon dioxide pneumoperitone- um with steep trendelenburg positioning proven by ultrasono- graphic measurement of optic nerve sheath diameter. J Endou- rol 2014; 28: 801-6.
2. Whiteley JR, Taylor J, Henry M, Epperson TI, Hand WR. Detec- tion of elevated intracranial pressure in robot-assisted laparo- scopic radical prostatectomy using ultrasonography of optic nerve sheath diameter. J Neurosurg Anesthesiol 2015; 27: 155-9.
3. Choi ES, Jeon YT, Sohn HM, Kim DW, Choi SJ, In CB. Compari- son of the effects of desflurane and total intravenous anesthe- sia on the optic nerve sheath diameter in robot assisted laparo- scopic radical prostatectomy: a randomized controlled trial.
Medicine (Baltimore) 2018; 97: e12772.
4. You AH, Song Y, Kim DH, Suh J, Baek JW, Han DW. Effects of positive end-expiratory pressure on intraocular pressure and optic nerve sheath diameter in robot-assisted laparoscopic radical prostatectomy: a randomized, clinical trial. Medicine
(Baltimore) 2019; 98: e15051.
5. Kim Y, Choi S, Kang S, Park B. Propofol affects optic nerve sheath diameter less than sevoflurane during robotic surgery in the steep trendelenburg position. Biomed Res Int 2019;
2019: 5617815.
6. Robba C, Santori G, Czosnyka M, Corradi F, Bragazzi N, Paday- achy L, et al. Optic nerve sheath diameter measured sono- graphically as non-invasive estimator of intracranial pressure:
a systematic review and meta-analysis. Intensive Care Med 2018; 44: 1284-94.
7. Robba C, Bacigaluppi S, Cardim D, Donnelly J, Bertuccio A, Czosnyka M. Non-invasive assessment of intracranial pressure.
Acta Neurol Scand 2016; 134: 4-21.
8. Robba C, Cardim D, Tajsic T, Pietersen J, Bulman M, Donnelly J, et al. Ultrasound non-invasive measurement of intracranial pressure in neurointensive care: a prospective observational study. PLoS Med 2017; 14: e1002356.
9. Ali MA, Hashmi M, Shamim S, Salam B, Siraj S, Salim B. Cor- relation of optic nerve sheath diameter with direct measure- ment of intracranial pressure through an external ventricular drain. Cureus 2019; 11: e5777.
10. Ozturk Z, Atalay T, Arhan E, Aydin K, Serdaroglu A, Hirfanoglu T, et al. The efficacy of orbital ultrasonography and magnetic resonance imaging findings with direct measurement of intra- cranial pressure in distinguishing papilledema from pseudo- papilledema. Childs Nerv Syst 2017; 33: 1501-7.
11. Dubost C, Le Gouez A, Jouffroy V, Roger-Christoph S, Benham- ou D, Mercier FJ, et al. Optic nerve sheath diameter used as ul- trasonographic assessment of the incidence of raised intracra- nial pressure in preeclampsia: a pilot study. Anesthesiology 2012; 116: 1066-71.
12. Lee SU, Jeon JP, Lee H, Han JH, Seo M, Byoun HS, et al. Optic nerve sheath diameter threshold by ocular ultrasonography for detection of increased intracranial pressure in Korean adult patients with brain lesions. Medicine (Baltimore) 2016; 95:
e5061.
13. Lee B, Koo BN, Choi YS, Kil HK, Kim MS, Lee JH. Effect of cau- dal block using different volumes of local anaesthetic on optic nerve sheath diameter in children: a prospective, randomized trial. Br J Anaesth 2017; 118: 781-7.
14. Padayachy LC, Padayachy V, Galal U, Gray R, Fieggen AG. The relationship between transorbital ultrasound measurement of the optic nerve sheath diameter (ONSD) and invasively mea- sured ICP in children: part I: repeatability, observer variability and general analysis. Childs Nerv Syst 2016; 32: 1769-78.
15. Cimilli Ozturk T, Demir H, Yorulmaz R, Ozdemir S, Isat G, Ec- mel Onur O. Assessment of intra-interobserver reliability of the
CC
sonographic optic nerve sheath diameter measurement. Kaoh- siung J Med Sci 2015; 31: 432-6.16. Matsuoka T, Ishiyama T, Shintani N, Kotoda M, Mitsui K, Mat- sukawa T. Changes of cerebral regional oxygen saturation during pneumoperitoneum and Trendelenburg position un- der propofol anesthesia: a prospective observational study.
BMC Anesthesiol 2019; 19: 72.
17. Hong JH, Jung SW, Park JH. The effect of speed of normal saline injection on optic nerve sheath diameter in thoracic epidural anesthesia. Pain Physician 2019; 22: E325-32.
18. Moretti R, Pizzi B. Ultrasonography of the optic nerve in neuro- critically ill patients. Acta Anaesthesiol Scand 2011; 55: 644-52.
19. Yin G, Wang YX, Zheng ZY, Yang H, Xu L, Jonas JB; Beijing Eye Study Group. Ocular axial length and its associations in Chi-
nese: the Beijing eye study. PLoS One 2012; 7: e43172.
20. Choi SH, Lee SJ, Rha KH, Shin SK, Oh YJ. The effect of pneumo- peritoneum and Trendelenburg position on acute cerebral blood flow-carbon dioxide reactivity under sevoflurane anaes- thesia. Anaesthesia 2008; 63: 1314-8.
21. Wilson MH. Monro-Kellie 2.0: the dynamic vascular and ve- nous pathophysiological components of intracranial pressure.
J Cereb Blood Flow Metab 2016; 36: 1338-50.
22. Tanaka N, Yamamoto M, Abe T, Osawa T, Matsumoto R, Shino- hara N, et al. Changes of cerebral blood volume during ro- bot-assisted laparoscopic radical prostatectomy: observational prospective study using near-infrared time-resolved spectros- copy. J Endourol 2019; 33: 995-1001.