Journal of Welding and Joining, Vol.35 No.1(2017) pp79-88 1. Introduction
Securing an efficient energy source that will contribute to a reduction in global warming and replace gradually diminishing fossil fuels, has received significant atten- tion recently. Nuclear power generation has received in- creasing attention as a possible replacement, owing to its stable and efficient energy supply, despite radio- activity and nuclear waste concerns. Of the various types of nuclear power generation, the fast breeder re- actor (FBR, using fast neutrons that breed Plutonium- 239 from Uranium-238) is considered the most ad- vanced owing to its more efficient use of fuel. Type 316FR stainless steel modified based on type 316L steel, which has better creep fatigue properties than those of other austenitic stainless steels, is a promising structural material for the primary coolant circuit in next-generation commercial FBR plants 1,2) . However,
when FBR plants have been in operation for a long time (max. about 40 years), then components suffering from the effects of sigma phase embrittlement, creep fatigue or corrosion in a liquid sodium environment will re- quire essential maintenance, which typically involves welding 2,3) .
Prior to establishing repair-welding processes for aged FBR plants, the typical differences between an FBR and other general types of reactors (e.g., light water-cooled reactors) must be understood. Firstly, owing to its high thermal conductivity, an FBR uses molten sodium metal as a coolant instead of water. Secondly, compared to other reactors, an FBR operates at higher temperatures of 773-823 K, owing to its high degree of heat generation.
After long-term service exposure, however, corrosion stemming from the flow of liquid sodium at high serv- ice temperatures, damages the surface layers of the structural materials 3,4) . Consequently, overlay welding is considered a promising candidate for the repair welding
Influence of Metallic Sodium on Repair Weldability for Type 316FR Stainless Steel
Eun-Joon Chun* , †, Su-Jin Lee*, Jeong Suh*, Ju-Seung Lee**, Namhyun Kang***
and Kazuyoshi Saida****
*Busan Laser Application Support Center, Korea Institute of Machinery and Materials (KIMM), Busan 46744, Korea
**3rd Land System Team, Defense Agency for Technology and Quality, Gyeongsangnam-do 51474, Korea
***Department of Materials Science and Engineering, Pusan National University, Busan 46241, Korea
****Division of Materials and Manufacturing Science, Osaka University, Osaka 565-0871, Japan
†Corresponding author : [email protected]
(Received October 12, 2016 ; Revised November 28, 2016 ; Accepted February 1, 2017)
Abstract
The effect of residual metallic sodium on the solidification cracking susceptibility of type 316FR stainless steel was investigated via transverse-Varestraint tests. And a solidification brittle temperature range (BTR) of type 316FR stainless steel was 37 K. However, the BTR expanded from 37 to 67 K, as the amount of metallic sodium at the specimen surface increased from 0 to 7.99 mg/cm 2 . Microstructural observation of the weld metal su- ggested that metallic sodium existed in the weld metal, including in the cell boundaries, during welding solidification. Thermodynamic calculations suggested that sodium expanded the temperature range of solidliquid coexis- tence during welding solidification of the steel weld metal. Therefore, the increased solidification cracking susceptibility (i.e., expansion of the BTR) in the residual sodium environment was attributed to enhanced segregation of sodium during the welding solidification; this segregation, in turn, resulted in an expanded temperature range of solid-liquid coexistence.
Key Words : Welding, Solidification cracking susceptibility, Varestraint test, Metallic sodium
ISSN 2466-2232
Online ISSN 2466-2100
of aged FBR plants.
Although liquid sodium is drained from the sodium loop prior to repair welding, a small amount of metallic sodium may persist at the surface of the structural mate- rial; i.e., repair welding would be performed in a metal- lic sodium environment. As such, determining the effect of residual metallic sodium on the repair-weldability is essential. During any welding process for austenitic stainless steel, special attention needs to be paid to the alloy’s weldability under the viewpoint of hot cracking, such as solidification, liquation and ductility-dip cracks
5,6) . Even though, liquation and ductility-dip cracks have been confirmed when the repair welding of aged stain- less steels (for HP-modified stainless steel), one of the crucial cracks has been regarded as solidification crack for austenitic stainless stee l5-21) . However, the effect of sodium on this susceptibility has not been quantitatively studied. The objective of the present study, therefore, is to examine the changes in the solidification cracking susceptibility of a type 316FR stainless steel in a metal- lic sodium environment. This study is performed as part of a larger goal of establishing welding repair processes for next- generation FBR plants.
2. Materials and experimental procedures 2.1 Materials
The material selected in this study is a filler metal for
type 316FR stainless steel, whose composition lies within the compositional range of the steel 2) . The chemical composition (mass%) of the steel is shown in Table 1.
This steel was hot-rolled to a 100 mm (length) × 50 mm (width) × 3 or 5 mm (thickness) plate and solution- treat- ed at 1423 K for 30 min for full austenization. The cor- responding Cr eq /Ni eq value indicates that primary aus- tenite and secondary δ-ferrite (AF) were formed during solidification of the steel 6,7) .
2.2 Immersion test in liquid sodium
To simulate a metallic sodium environment, an im- mersion test was performed in a liquid sodium pool.
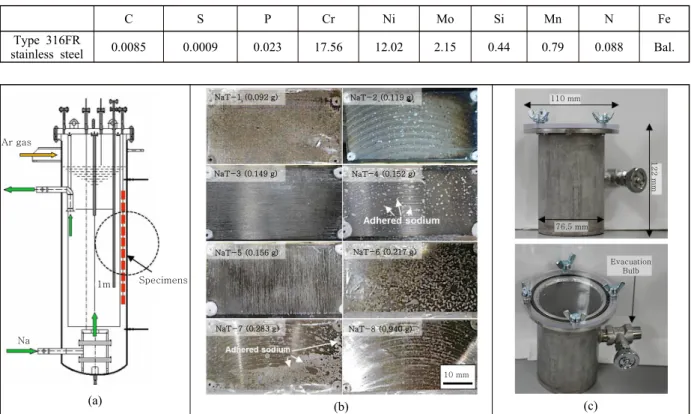
The plate was polished with eight conditions, each hav- ing a different roughness, in order to vary the amount of sodium at the specimen surface. Fig. 1 shows the proce- dures followed for the liquid sodium immersion test.
The prepared specimens were connected by a wire, im- mersed in the sodium pool (in Fig. 1(a)), and the test was performed at 673 K for 640 min. As Fig. 1(b) shows, the sodium was uniformly distributed at the sur- face of the specimen. The amount of adhered metallic sodium, which varied from 0.092 to 0.940 g depending on the roughness of the specimens, was measured using an electronic scale. After the test, each immersed speci- men was stored in a desiccator (Fig. 1(c)) under argon
C S P Cr Ni Mo Si Mn N Fe
Type 316FR
stainless steel 0.0085 0.0009 0.023 17.56 12.02 2.15 0.44 0.79 0.088 Bal.
Ar gas
1m
Na
Specimens
(a)
NaT-1 (0.092 g)
10 mm NaT-7 (0.283 g)
NaT-5 (0.156 g) NaT-3 (0.149 g)
NaT-8 (0.940 g) NaT-6 (0.217 g) NaT-4 (0.152 g) NaT-2 (0.119 g)
(b)
Evacuation Bulb 76.5 mm
122 mm
110 mm
(c)
Fig. 1 Liquid sodium immersion test: (a) schematic of sodium pool, (b) appearance after immersion test, and (c) desic- cator under argon atmosphere
Table 1 Chemical composition of the steel used (mass%)
gas (99.99% purity) atmosphere.
2.3 Transverse-Varestraint test
Transverse-Varestraint tests with gas tungsten arc (GTA) welding were performed in order to assess the solidification cracking susceptibility of the specimens.
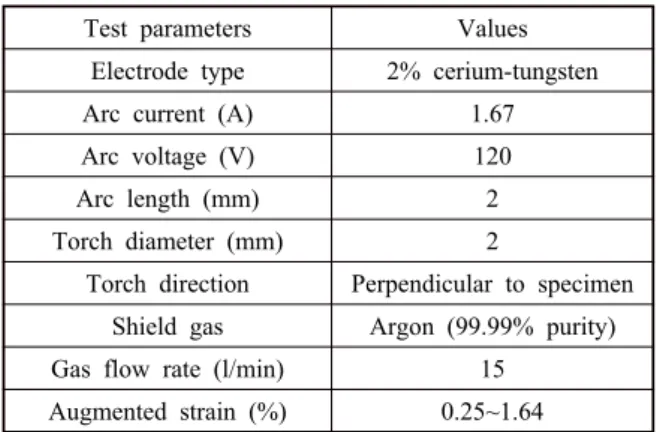
Fig. 2(a) shows a schematic of the workbench used in the test under the sodium environment. Owing to the strong reactivity of sodium, the workbench was shield- ed by argon gas (99.99% purity) in a specially attached glove box, in which the overall procedures of the test were performed; the corresponding test parameters are listed in Table 2. The test was performed at a transverse welding speed of 1.67 mm/s and a third-penetration bead was obtained by adjusting the arc current. Moreover, the augmented strain was varied from 0.25-1.64%. Fig.
2(b) shows the dimensions of the test specimen used (thickness: 3 or 5 mm) and the configuration of the bending block. The length of the transverse weld bead was adjusted to 40 mm and the temperature history dur- ing welding solidification was measured using a ther- mocouple (Pt-12%Rh/Pt); this thermocouple was di- rectly plunged into the weld pool during welding in or- der to obtain the range of cracking temperatures. The corresponding crack surface was examined using a scanning electron microscope (SEM).
2.4 Microstructure observation of the weld metal To characterize the microstructure of the type 316FR steel weld metal, GTA bead-on-plate welding was per- formed on the prepared plates (without sodium im- mersion) under the same conditions (Table 2) used for
transverse welding. The as-welded microstructures were characterized via electron backscatter diffraction (EBSD) after electrolytic etching with a 10% aqueous solution of KOH at room temperature.
2.5 Preparation of the sodium-trapped weld metal Sodium-trapped weld metal was manufactured in or- der to clearly determine whether the weld metal con- tains sodium. The schematic in Fig. 3 shows the method used to prepare the weld metal. Pure sodium (99.99%
purity) was placed between the upper (100 × 5 × 1 mm) and lower plate (100 × 5 × 9 mm) of the steel (without sodium immersion). The specimen was then GTA bead-on-plate welded in the glove box (owing to the strong activity of sodium) using an arc current, arc volt- age, and welding speed of 180 A, 14 V and 1.67 mm/s, respectively. In addition, an electron probe X-ray micro analyzer (EMPA) was used to determine the sodium
Bending block Specimen
Yoke
Rubber glove Rubber
glove Arc torch
Protection window
(Local Ar atmosphere)
Stopper Hydraulic pressure
(a)
Bending block Spot welding
Yoke
Weld bead Bead length:
40 mm Specimen
Thickness 3 or 5 mm Clamp
Yoke 355035
Unit: mm 40
100 φ4
(b) Fig. 2 Transverse-Varestraint test: (a) schematic of the workbench used in the test
Test parameters Values
Electrode type 2% cerium-tungsten
Arc current (A) 1.67
Arc voltage (V) 120
Arc length (mm) 2
Torch diameter (mm) 2
Torch direction Perpendicular to specimen Shield gas Argon (99.99% purity)
Gas flow rate (l/min) 15
Augmented strain (%) 0.25~1.64
Table 2 Parameters used for the transverse-Varestraint
test
content of the weld metal.
3. Characterization of weld metal microstructure and solidification mode
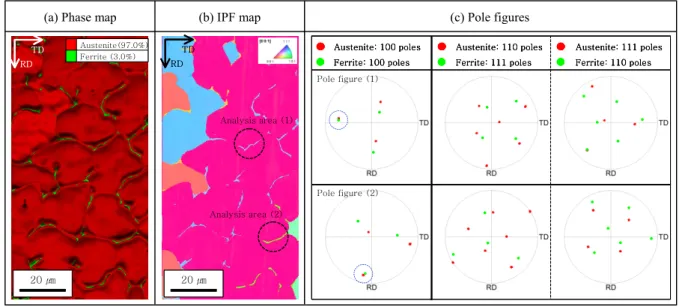
The cross-sectional view of the microstructure (Fig.
4(a)), as observed by EBSD, shows the cellular mor- phology that is typically associated with the current sol- idification behavior. The δ-ferrite (δ) is located at the cell boundaries or triple points of austenite (γ), is elon- gated or globular-shaped, and constitutes an average volume fraction of 3%. In addition, it has been regarded that solidification mode of austenitic stainless steel can be characterized crystallographic orientation relation- ship between γ and δ. The inverse pole figure (IPF) map and the corresponding pole figures, Fig. 4(b) and (c), reveal the crystallographic orientation relationship be- tween γ and δ. The pole figures show that these phases are related by a perfect parallel relationship, <100> γ //
<100> δ , rather than the Kurdjumov-Sachs crystallo-
graphic orientation relationship ({111} γ // {110} δ , <111> γ
// <110> δ ). Similar relationships are confirmed at other locations of the weld bead. These characteristics are consistent with the AF mode that occurs with divorced eutectic solidification between γ and δ, and concur with the results of Inoue et al. 22,23) and Hashimoto et al. 24) , who determined the crystallographic orientation rela- tionship in austenitic stainless steel weld metals.
4. Solidification cracking susceptibility Fig. 5 shows the appearance and fracture surface re- sulting from the transverse-Varestraint test without so- dium immersion (i.e., sodium-free condition). The frac- ture surface occurring on both the high (under the fu- sion line) and low temperature sides (away from the fu- sion line) had a dendritic structure with only a trace amount of melting. Microstructural observations of the crack surface revealed that this crack resulted possibly from solidification cracking. Similar morphologies were observed on the crack surfaces resulting from other strain conditions. However, ductility-dip and liquation cracks were not observed.
Fig. 6 summarizes the solidification cracking suscepti- bilities evaluated by using the crack length and number of cracks measured from SEM observations after the transverse-Varestraint test. Each bar represents a single crack, which is classified as either a crack, back-fill (filled with liquid from molten pool after crack ini- tiation), or blank (crack-free). As the figure shows, the cracking susceptibility (number of cracks and crack length) increased with increasing applied strain. In ad- dition, a solidification brittle temperature (BTR) of 37 K was obtained by using the maximum crack length and
20 ㎛ 20 ㎛
20 ㎛ 20 ㎛
Analysis area (1)
20 ㎛ 20 ㎛
Analysis area (1) Austenite(97.0%)
Ferrite (3.0%) Austenite(97.0%) Ferrite (3.0%)
(a) Phase map (b) IPF map (c) Pole figures
Ferrite: 111 poles Austenite: 110 poles
Ferrite: 110 poles Austenite: 111 poles Ferrite: 100 poles
Austenite: 100 poles
Pole figure (1)
Pole figure (2)
Ferrite: 111 poles Austenite: 110 poles
Ferrite: 110 poles Austenite: 111 poles Ferrite: 100 poles
Austenite: 100 poles
Pole figure (1)
Pole figure (2)
Ferrite: 111 poles Austenite: 110 poles Ferrite: 111 poles Austenite: 110 poles
Ferrite: 110 poles Austenite: 111 poles Ferrite: 110 poles Austenite: 111 poles Ferrite: 100 poles
Austenite: 100 poles Ferrite: 100 poles Austenite: 100 poles
Pole figure (1)
Pole figure (2) Analysis area (2)
TD RD
TD RD TD
RD TD RD
Fig. 4 EBSD analysis of the weld metal: (a) phase map, (b) IPF map, and (c) pole figures
Arc torch
Lower Plate
(Thickness: 10 mm)
Weld bead
Pure sodium Upper Plate
(Thickness: 1 mm)
Fig. 3 Schematic of the GTA bead-on-plate welding for
sodium-trapped specimen
the cooling rate (240 K/s) measured by the thermocouple.
This BTR is shown in the ductility curve for solidification cracking (Fig. 7) of the type 316FR stainless steel.
5. Effect of sodium on solidification cracking susceptibility
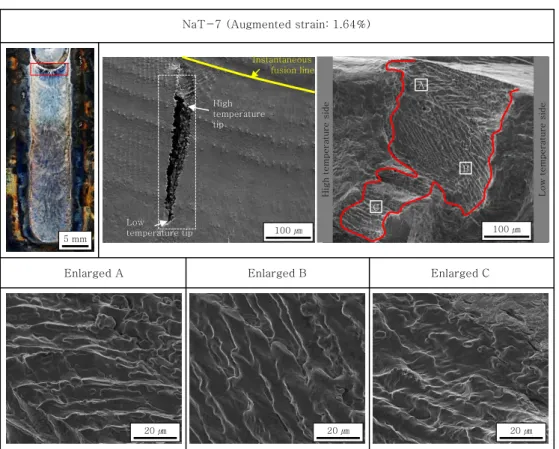
Fig. 8 shows the typical appearance and fracture sur-
face resulting from the transverse-Varestraint test under metallic sodium environment (i.e., for sodium immersion specimen of NaT-7). Hot cracks could confirmed near the fusion line. The fracture surface of a crack indicates a totally dendritic structure with a trace of melting. In other words, the cracks formed by the transverse-Varestraint test under the metallic sodium environment can be re- garded as solidification crack as similar with the sodium
20 ㎛ 20 ㎛ 20 ㎛
20 ㎛ 20 ㎛
20 ㎛
B
A
C
High temperature side Low temperature side
B
A
C
High temperature side Low temperature side
Instantaneous fusion line
High temperature tip
Low temperature tip
Instantaneous fusion line
High temperature tip
Low temperature tip
5 mm 5 mm 5 mm
Enlarged A
Sodium free (Augmented strain: 0.83%)
20 ㎛ 20 ㎛ 100 ㎛
100 ㎛
Enlarged B Enlarged C
Fig. 5 Appearance and fracture surface, as observed by SEM, after the transverse-varestraint test (for sodium-free condition)
0
100
200
300
400
500
Number of cracks Augmented strain (%)
0.15 0.25 0.41 0.83 1.64
0 5 8 12 17
Crack free
Crack Back-fill Blank
D ista n ce fr o m fusi on lin e ( ㎛ )
0
100
200
300
400
500
Number of cracks Augmented strain (%)
0.15 0.25 0.41 0.83 1.64
0 5 8 12 17
Crack free
Crack Back-fill Blank
D ista n ce fr o m fusi on lin e ( ㎛ )
Fig. 6 Location and length of the solidification crack formed during the transverse-varestraint test
Crack free 0.15 0.0
0.5 1.0 1.5 2.0
1510 1540 1570 1600 1630 1660 1690
Solidification brittle temperature range (BTR): 37 K
Temperature (K)
BTR
A u gm e n te d s tr a in ( % )
Nominal liquidus temperature Estimated by Thermo-Calc Software (database: SSOL4) : 1688 K
Fig. 7 High-temperature ductility curve of solidification
cracking and BTR obtained from the transverse-
varestraint test
free specimen (in Fig. 5).
The BTR and high-temperature ductility curve for sol- idification cracking were determined for specimens with different amounts of adhered sodium (in Fig. 1(b)).
A plot of the cross-sectional area of the weld metal as a function of the amount of adhered sodium shows that, in general, the former decreased with increasing values
of the latter. In addition, Fig. 9(b) shows that the meas- ured cooling rate varied from 239 to 405 K/s with in- creasing amounts of sodium. Each cooling rate was ap- plied to the corresponding immersed specimen in order to convert the temperature range of the solidification cracking. Moreover, for sodium amounts of 0-2.0 mg/cm 2 (Fig. 10), the BTR expanded by 30 K, from 37 to 67 K,
20 ㎛
20 ㎛ 20 ㎛20 ㎛ 20 ㎛20 ㎛
B A
C
B A
C High
temperature tip
Low temperature tip 5 mm
5 mm 5 mm
NaT-7 (Augmented strain: 1.64%)
Enlarged A Enlarged B Enlarged C
High temperature side Low temperature side
Instantaneous fusion line
100 ㎛
100 ㎛ 100 ㎛100 ㎛
Fig. 8 Appearance and fracture surface, as observed by SEM, after the transverse-varestraint test (for specimens after so- dium immersion test: NaT-7)
NaT-1 NaT-7 NaT-6
NaT-8 NaT-2
NaT-3 NaT-4
NaT-5
0 2 4 6 8 10 12
0 2 4 6 8 10
Amount of sodium (mg/cm
2)
Na free
Cross-se ction a l area of we ld me tal (mm
2)
Na free NaT-1
NaT-7 NaT-6
NaT-8
NaT-2 NaT-3 NaT-4 NaT-5
100 150 200 250 300 350 400 450 500
0 2 4 6 8 10
Co o lin g rat e ( K/s )
Amount of sodium (mg/cm
2)
(a) (b)
Fig. 9 Relationship between the amount of adhered sodium and the (a) cross-sectional area of the weld metal and (b)
cooling rate
but approximately remained constant thereafter.
6. Mechanism of btr enlargement under sodium environment
6.1 Characterization of sodium content
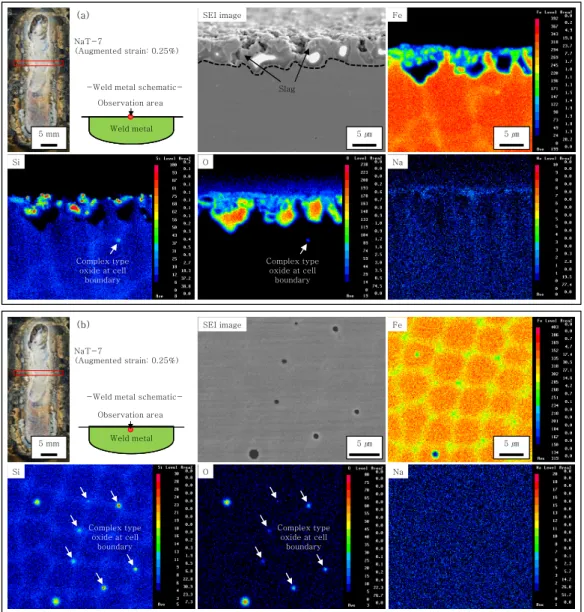
Fig. 11 shows an SEM image of the cross-section and the distribution of elements, as determined by EMPA, of the weld metal after the transverse-Varestraint test.
Small amounts of sodium and slag (oxide composed of alloying elements) were detected in the sub-surface re- gions (Fig. 11(a)) of the specimen. The SEM and EPMA results (Fig. 11(b)) of a region just below the observation area in Fig. 11(a) reveal that the aforementioned oxide is also present at the cell boundaries; however, sodium was not clearly detected in this region. Namely, the re- sults of the microstructural observation of the weld met- al did not clearly confirm the presence of sodium during
2.0 mg/cm2 Na free
NaT-1
NaT-2 NaT-3
NaT-4 NaT-5
NaT-6
NaT-7 NaT-8
0 10 20 30 40 50 60 70 80 90 100
0 2 4 6 8 10
Amount of sodium (mg/cm
2)
Solidif ica tion brit tle t e mpera ture rang e, B T R (K)
Fig. 10 Relationship between the amount of adhered so- dium and the BTR
Weld metal Weld metal
SEI image
5 ㎛ 5 ㎛ Slag
Fe
5 ㎛ Fe
5 ㎛ 5 ㎛
Si
Si O Na
5 mm 5 mm
NaT-7
(Augmented strain: 0.25%)
-Weld metal schematic- Observation area
Complex type oxide at cell
boundary
Complex type oxide at cell
boundary
(a)
Weld metal Weld metal
Na Na Fe
5 ㎛ Fe
5 ㎛ 5 ㎛ SEI image
5 ㎛ SEI image
5 ㎛ 5 ㎛
Si
Si O
5 mm 5 mm
-Weld metal schematic-
Observation area NaT-7
(Augmented strain: 0.25%)
Complex type oxide at cell
boundary
Complex type oxide at cell
boundary
(b)
Fig. 11 EPMA analysis of the (a) sub-surface region and (b) bulk of the specimen after the transverse-varestraint test
weld solidification. Moreover, although the Varestraint test was performed under argon atmosphere, the afore- mentioned oxide may be attributed to the characteristic ability of liquid sodium to easily form oxides under ex- tremely low levels of oxygen 25) .
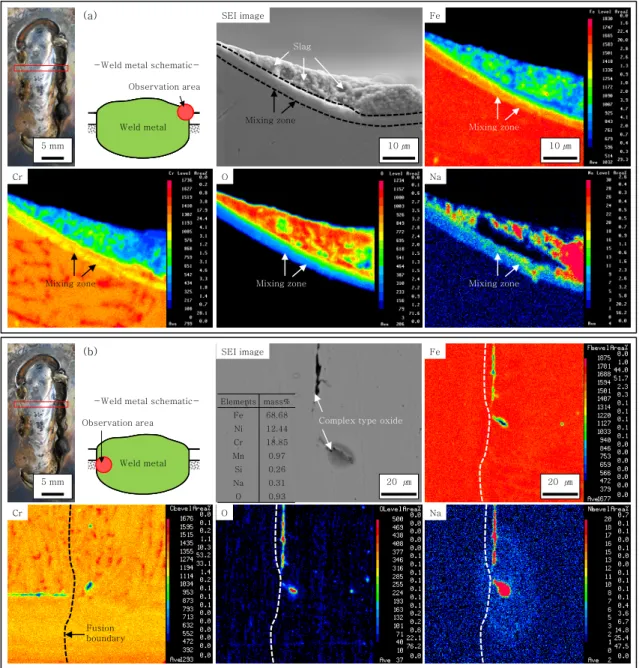
To determine whether sodium is present in the weld metal, Fig. 12 shows the corresponding cross-sectional microstructure of the sodium-trapped specimen (Fig. 3).
Fig. 12(a) shows the SEM and EPMA results obtained from the sub-surface of the specimen. These results confirmed the presence of sodium in the slag layer, which is composed of oxide and alloying elements.
Sodium was also mixed with the weld metal, thereby forming a mixing zone; i.e., an oxide composed of alloying
elements. This mixing zone was easily distinguished from the weld metal and slag layer, owing to its distribution of chromium (Cr), which differs markedly from those of the weld metal and the slag region. Furthermore, this observation suggests that the slight amount of sodium detected (Fig. 11(a)) after the transverse-Varestraint test stems from the formation of the slag and mixing zone.
The SEM and EPMA results obtained from regions near the fusion line in the weld metal show that sodium was also present in the form of complex oxides, which con- sist of Cr, nickel (Ni), manganese (Mn), and silicon (Si). Through these results, it was highly speculated that the sodium-free oxide located at the cell boundaries in Fig. 11(b) also related with sodium during weld solidification.
-Weld metal schematic-
Weld metal Weld metal Weld metal 5 mm
5 mm
Observation area
Cr O Na
Fe
10 ㎛ Fe
10 ㎛ 10 ㎛
SEI image
10 ㎛ 10 ㎛ SEI image
Slag
Mixing zone
Mixing zone
Mixing zone
Mixing zone Mixing zone
(a)
-Weld metal schematic- Observation area
Weld metal Weld metal
Na Fe
20 ㎛ 5 mm
SEI image
20 ㎛
Cr O
Complex type oxide
Fusion boundary
Elements mass%
Fe 68.68 Ni 12.44 Cr 18.85
Mn 0.97
Si 0.26
Na 0.31
O 0.93
(b)
Fig. 12 EPMA analysis of (a) the sub-surface region and (b) near the fusion line after the GTA bead-on-plate welding de-
scribed in Fig. 3
6.2 Theoretical calculation of solid/liquid coex- istence temperature range
Numerous studies have reported that sulfur and phos- phorous increase the susceptibility of stainless steels to solidification cracking; the BTR is especially affected by these elements. Sulfur and phosphorous segregate at the remaining liquid phase between the dendrites, there- by expanding the temperature range of solid/liquid co- existence during the welding solidification 6-8,12,17-21) . Moreover, it is well-established that, in the equilibrium state of the material, this temperature range is almost di- rectly proportional to the BTR 6,7) . Sodium should mix with the weld metal during the welding solidification.
As such, its effect on the temperature range of solid/liquid coexistence was investigated in order to determine the mechanism of BTR expansion in the sodium environment.
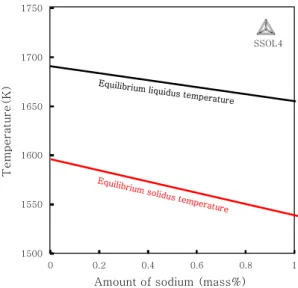
Fig. 13 shows the dependence of the equilibrium liq- uidus and solidus temperatures, as calculated from Thermo- calc software (database: SSOL4), on the amount of so- dium added to the steel. As the figure shows, the equili- brium liquidus and solidus temperatures decreased from 1688.8 to 1655.5 K and 1596.6 to 1538.3 K, respectively, with increasing amounts (0 to 1 mass%) of sodium. In other words, the temperature range of solid/ liquid co- existence in the equilibrium state expanded from 92.2 to 117.2 K (25 K broadening) with increasing amounts of sodium. The expansion of the BTR in the residual so- dium environment was, therefore, attributed to the seg- regation of sodium during the welding solidification;
this solidification, in turn, resulted in an expanded tem- perature range of solid/liquid coexistence.
7. Conclusions
The effect of a metallic sodium environment on the solidification cracking susceptibility (BTR) was quanti- tatively evaluated via a transverse-Varestraint test. The main conclusions of this study can be summarized as follows:
1) The solidification mode of type 316FR stainless steel weld metal was characterized by primary γ with secondary phase δ solidification (AF) mode with di- vorced-eutectic reaction between the two phases; the δ phase constituted an average volume fraction of 3%.
2) A BTR of 37 K was determined from the trans- verse- Varestraint test of the steel weld metal.
3) The BTR expanded from 37 to 67 K with an increase, from 0 to 7.99 mg/cm 2 , in the amount of adhered metal- lic sodium. In other words, the solidification cracking susceptibility of type 316FR stainless steel weld metal increased in the metallic sodium environment.
4) Sodium has the ability to mix with the weld metal, thereby forming a mixing zone in the sub-surface re- gion of the weld metal and forms an oxide with alloying elements in the bulk of the metal. This observation sug- gested that sodium acts as an impurity during the weld- ing solidification.
5) As determined by thermodynamics software, the tem- perature range of solid/liquid coexistence in the equili- brium state expanded from 92.2 to 117.2 K with an in- crease (from 0 to 1 mass%) in the amount of sodium added to the steel.
6) Calculation of the temperature range of the sol- id/liquid coexistence in the equilibrium state revealed the mechanism of the BTR expansion in the residual so- dium environment; this expansion, which was attributed to the segregation of sodium during the welding solid- ification, resulted in an expanded BTR.
Acknowledgment
The present study includes the results of the “Core R&D program for commercialization of the fast breeder reactor by utilizing Monju” entrusted to the University of Fukui by the Ministry of Education, Culture, Sports, Science, and Technology of Japan (MEXT).
References
1. T. Nakazawa et al., Advanced Type Stainless Steel 316FR for Fast Breeder Reactor Structures, Journal of Materials Processing Technology, 143-144 (20) (2003), 905-909
2. K. Aoto, Remodeling of Coolant System, Development
1500 1550 1600 1650 1700 1750
0 0.2 0.4 0.6 0.8 1
SSOL4
Amount of sodium (mass%)
T e mper atur e(K)
Equilibrium liquidus temperature
Equilibrium solidus
temperature