• 검색 결과가 없습니다.

Validation of Food Security Measures for the Korean National Health and Nutrition Examination Survey

N/A
N/A
Protected

Academic year: 2021

Share "Validation of Food Security Measures for the Korean National Health and Nutrition Examination Survey"

Copied!
11
0
0

로드 중.... (전체 텍스트 보기)

전체 글

(1)

− 771 − DOI:10.5720/kjcn.2011.16.6.771

국민건강영양조사 식품안정성 측정 도구의 타당도 조사

김기랑·홍서아·권성옥1)·최보율·김가영1)·오세영1)†

한양대학교 의과대학 예방의학교실·지역사회보건연구소,

1)

경희대학교 식품영양학과, 생활과학연구소

Validation of Food Security Measures for the Korean National Health and Nutrition Examination Survey

Kirang Kim, Seo Ah Hong, Sung Ok Kwon

1)

, Bo Youl Choi, Ga-Young Kim

1)

, Se-Young Oh

1)†

Department of Preventive Medicine, Hanyang University, College of Medicine, Institute for Community Health, Seoul, Korea

1)

Department of Food and Nutrition, Research Institute of Human Ecology, Kyung Hee University, Seoul, Korea

Abstract

The objective of this study was to assess the reliability and validity of food security measures, which was developed based on the US household food security survey module (US HFSSM) with content validity in the Korean population.

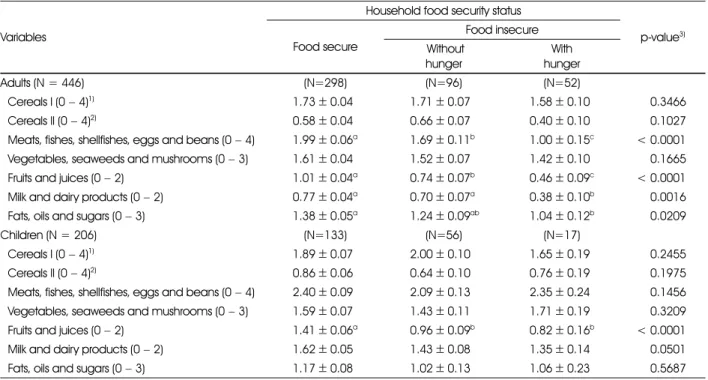
The reliability and validity were assessed by internal consistency, construct validity and criterion-related validity. The study included 446 households. Among those, 46.2% were households with children. The proportion of food insecure households was 33.3%. Among those, 35.4% and 64.6% households were food insecure with hunger and without hunger, respectively. The Cronbach's alpha coefficients were 0.84 and the infit value by the Rasch model analysis ranged from 0.68 to 1.43. The scale item response curves by food insecurity severity explained well the nature and characteristics of food security, indicating the highest proportion of “yes” for the items on diet quality, followed by those with diet quantity. The result of criterion-related validity showed that food insecurity status was significantly related in a dose-response manner with the household income level, food expenditure, subjective health state, subjects' educational level. Household food security status was also related to dietary diversity regarding protein foods, fruits and fruit juice, and milk and dairy product. These findings suggest that the food security instrument is reliable and valid and would be used to assess food security status in the Korean population. (Korean J Community Nutr 16(6) : 771~781, 2011)

KEY WORDS : food security·validity·reliability·measurement·KNHANES

—————————————————————————

서 론

—————————————————————————

국제적으로 식품 빈곤, 이로 인한 배고픔 등과 같은 식품 안정성(food security) 문제는 지난 몇 십 년 동안 저개발 국과 개발도상국가 뿐만 아니라 서구산업국가에서도 중요한 이슈로 대두되고 있다(Food and Agriculture Organi-

zation of the United Nations 2002a). 많은 국가에서 식 품 빈곤으로 인한 배고픔, 식품안정성 문제는 식품의 유용성 (food availability) 뿐만 아니라 식품의 접근성(food accessibility) 문제로 인식하기 시작하였고(Food and Agriculture Organization of the United Nations 2002b; Webb 등 2006), 이러한 문제의 해결도 개인 차원 에 국한하지 않고, 국가 차원의 측정과 모니터링, 다양한 중 재 활동을 통해서만이 가능한 것으로 보고되었다(Coates 등 2006; Swindale & Bilinsky 2006a; Webb 등 2006;

Office of Nutrition Policy and Promotion, Health Products and Food Branch 2007; Temple 2008;

Nord 등 2008). 최근 국내에서도 식품부족, 결식, 불량한 식사로 인한 영양섭취 불균형이 저소득층과 같은 사회경제 적 취약 층에 집중된 것으로 나타났다. 국민건강영양조사 결 과에 따르면 소득 계층에 따라 식생활이 양적, 질적으로 격

접수일: 2011년 10월 01일 접수

수정일: 2011년 10월 24일 수정 채택일: 2011년 12월 02일 채택

*

This research was supported by grants from the Korean Center of Disease and Control(Project No. 2010E0075600, Principal investigator, Se-Young Oh).

Corresponding author: Se-Young Oh, Department of Food and Nutrition, Kyung Hee University, 1 Hoigi-dong, Dongdaemun-gu, Seoul 130-701, Korea

Tel: (02) 961-0649, Fax: (02) 959-0649 E-mail: [email protected]

(2)

차가 있으며, 이러한 계층 간의 격차는 급속히 증가하고 있 다(Korea Health Industry Development Institute 2003; Korea Health Industry Development Institute 2007; Kim 등 2008).

식품안정성은 식품의 유용성(availability), 접근성 (accessibility), 이용성(utilization) 측면을 모두 포함하는 매우 포괄적인 개념이나 기존 연구에서 식품안정성은 식품 의 이용성 측면을 나타내는 식품 또는 영양소 섭취상태, 신 체계측(신장, 체중 등)등으로 주로 조사되었다. 최근 식품안 정성의 핵심 요소인 식품의 접근성 문제를 포괄하는 식품안 정성 측정지표가 미국을 중심으로 국외에서 개발되었다 (Coates 등 2006; Office of Nutrition Policy and Promotion 2007; Temple 2008; Nord 등 2008). 개 발된 식품안정성 측정 지표는 각 국가의 식품안정성 현황 및 모니터링 뿐만 아니라 식품영양지원사업에서 수혜 대상자의 선별 및 사업 평가에도 활용되고, 영양 정책가나 관리자들의 정책 결정에서 근거자료로 제시되었다(Hamilton 등 1997;

Nord 등 2006; Nord 등 2008).

국내의 경우 2005년 국민건강영양조사에서 단일 문항의 식품안정성 측정 지표를 이용하여 국내 식품안정성 현황이 조사된 바 있다(Shim 등 2008; Kim 등 2008). 그러나 이 측정 지표는 단일 문항으로 식품안정성 수준의 정확한 측정 이 어렵고, 타당성도 검증되지 않아 국내 식품안정성의 현황 파악에는 제한이 있다. 일부 국내 연구에서 미국에서 개발된 식품안정성 측정 도구를 이용하여 취약계층을 중심으로 식 품 안정성의 수준을 조사하였으나(Oh & Hong 2003;

Kwon & Oh 2007; Kim 등 2009) 사용된 조사 도구의 타 당도 검증은 이루어지지 않았다. 최근 미국 식품 안정성 조 사 모듈(US Household Food Security Survey Module, US HFSSM)의 국내 적용 가능성을 파악하기 위 해 실시된 연구에서 타당도 검증이 시도되었다(Kim & Kim 2009). 그러나 이 연구는 대상자가 노인과 영유아에만 국한 되어 성인, 아동을 포함한 일반 가구에서의 식품안정성 평가 가 필요하다. 이에 본 연구팀은 국민건강영양조사에서 사용 되고 있는 식품안정성 설문을 개선하기 위하여 국제적으로 활용되고 있는 미국 식품안정성 조사 모듈(US HFSSM)을 근거로 한국형 식품안정성 측정 도구를 개발하여 도구의 타 당도를 검증하였다(Oh 등 2010). 본 논문에서는 측정도구 의 신뢰도 및 타당도 검증 부분을 제시하였다.

—————————————————————————

연구대상 및 방법

—————————————————————————

본 연구는 기존의 식품안정성 측정 도구를 고찰하고 전문

가 자문회의를 실시하여 측정도구를 개발하였다. 개발된 측 정 도구는 질적 연구방법인 인지 면접과 자문회의를 통해 수 정·보완되어 최종 도구로 확정되었다(Oh 등 2010). 최종 확정된 측정 도구는 내적일치도, 구성타당도, 준거타당도 측 면에서 양적 타당도가 다음과 같이 평가되었다.

1. 조사 대상자

식품 불안정 측정도구 개발에는 식품불안정 단계를 모두 포함하여 조사대상자를 선정하는 것이 필요하다. 이에 본 연 구는 지역별, 사회경제적 수준, 연령별에 따른 식품안정성 수 준의 차이를 고려하여 각 특성별로 대상자를 경기도 동북부 와 서울시에서 선정하였다. 경기도 동북부 지역은 2009년 지역사회건강조사를 실시한 5개 지역으로 도시와 농촌의 특 성을 갖춘 지역이다. 본 연구는 소득수준이 최저생계비의 200% 이하인 지역사회건강조사에 참여한 아동 포함 268가 구와 아동비포함 340 가구 가운데 연구 참여 의향이 있는 163 아동포함 가구, 141 아동비포함 가구, 총 304가구를 조사에 포함하였다. 서울특별시에서는 5개 보건소의 방문보 건 대상자와 영양플러스 대상자 중 연구 참여 의향이 있고 소 득수준이 최저생계비의 120% 이하인 아동포함 43가구와 아동비포함 99가구 총 142가구가 선정되었다. 아동의 기준 은 이유식을 하지 않고 본인이 의지를 가지고 다양한 식품을 선택하여 일반식을 할 수 있는 만 4~17세로 정하였다.

성인 조사 대상자의 평균 연령은 47.3세로 40~64세 53.4%, 19~39세 36.1%, 65세 이상 10.5% 순이었다. 성 인의 성별은 남자가 18.2%, 여자가 81.8%였다. 아동의 평 균 연령은 9.2세로 8~12세 46.1%, 4~7세 38.8%, 13~17세 15.1% 순이었고, 남자 51.5%, 여자 48.5%이었 다. 조사대상 가구 중 만 4~17세 아동이 함께 살고 있는 가 구는 46.2%이었다.

2. 조사 내용 및 방법 1) 식품안정성

질적 타당도 검증을 통해 최종 확정된 식품안정성 측정 도

구는 18개의 항목으로 구성되었다. 처음 3개 문항은 가구내

식품불안정에 대한 내용이고 그 다음 7문항은 성인대상, 나

머지 8문항은 아동대상 문항이다. 가구내 식품불안정 설문

은 ‘최근 1년 동안 식비가 부족하여 먹을 것이 떨어질까 바

걱정한 적’, ‘떨어진 적’, ‘균형잡힌 식사를 할 수 없는 적’의

내용을 포함하고, 성인대상 설문은 같은 이유로 ‘먹어야 한

다고 생각하는 양보다 적게 먹은 적’, ‘배가 고픈데도 먹지 못

한 적’, ‘필요한 만큼 먹지 못해서 살이 빠진 적’, ‘하루 종일

굶은 적’ 등으로 이루어졌다. 아동 설문은 ‘영양상 질이 떨어

(3)

지는 값싼 한두 가지 음식만 준 적’, ‘균형 잡힌 식사를 주지 못한 적’, ‘필요한 만큼 주지 못한 적’, ‘식사량을 줄인 적’,

‘ 거른 적’, ‘배가 고픈데도 먹지 못한 적’, ‘하루 종일 굶은 적’

등의 내용으로 구성하였다. 문항 중 1번~3번, 9번~11번 문 항까지는 3점 척도(자주 그랬다, 가끔 그랬다, 전혀 그런 적 이 없다)로 응답, 4-1번, 8-1번, 13-1번 문항(거의 매 달, 몇 달 동안(매달 아님), 한두 달 동안만)은 3점 척도, 나 머지 문항(예, 아니요로 응답)은 2점 척도로 구성하였다. 1 번~3번, 9번~11번 문항까지 ‘자주 그랬다’ 또는 ‘가끔 그 랬다’라고 응답한 경우에는 1점, ‘전혀 그런 적이 없다’는 0 점으로 환산하였고, 4-1번, 8-1번, 13-1번 문항에서 ‘거 의 매달’ 또는 ‘몇 달 동안(매달 아님)’은 1점, ‘한두 달 동안 만’은 0점을 주었다. 나머지 문항에서는 ‘예’는 1점, ‘아니 요’는 0점으로 환산하였다. 아동포함 가구에 대한 내용은 총 18문항으로 최하 0점, 최고 18점, 아동비포함 가구 관련 설 문은 총 10문항으로 최하 0점, 최고 10점이 부여되었다. 총 점수가 높을수록 식품 불안정성을 경험할 가능성이 높은 것 으로, 총 점수가 0점에서 2점 이하인 경우는 식품안정성 확 보, 3점 이상은 식품 불안정성을 의미한다. 아동비포함 가구 는 3점~5점(배고픔이 없는 식품 불안정성 초기단계), 6점

~8점(배고픔을 동반하는 식품 불안정성 중간단계), 9점

~10점(배고픔을 동반하는 식품 불안정성 심화단계)으로 분 류하였고, 아동포함 가구는 3점~7점(배고픔이 없는 식품 불 안정성 초기단계), 8점~12점(배고픔을 동반하는 식품 불안 정성 중간단계), 13점~18점(배고픔을 동반하는 식품 불안 정성 심화단계)으로 분류하였다. 배고픔을 동반하는 식품 불 안정성 심화단계 비율은 1.8%로 낮아, 결과 분석에서는 배 고픔 동반 식품 불안정성 중간단계에 포함하였다.

2) 식품 섭취의 다양성 조사

United States Agency for International Develop- ment(USAID)에서 제시한 가구차원 식사다양성 지표 (Household Dietary Diversity Indicator, HDDI)를 참 고하여 한국인에 맞게 개발한 설문지를 이용하여 성인과 아 동의 조사 하루 전 식품군 섭취를 측정하였다(Swindale &

Bilinsky 2006b; Korean Nutrition Society 2010).

USAID의 식품군은 곡류, 채소류, 과일류, 육류, 생선류, 콩 류, 우유 및 유제품, 유류, 첨가당/꿀, 기호식품(커피, 차) 등 12가지를 포함하나 본 연구에서는 한국인영양섭취기준에 제 시된 식품군 분류를 기준으로 하였다. 식품군은 곡류 및 전 분류 I, II, 육류, 어패류, 난류, 콩류, 채소류, 과일류, 우유, 유제품, 유지류, 견과류, 당류군을 포함하였다. 조사 전날 각 식품군에 따른 섭취에 대하여 ‘예’라고 응답한 경우 1점을

부여하였고 이를 통해 산출된 점수가 높을수록 식이섭취가 다양함을 의미한다. 제시된 식품군 수를 고려하여 곡류군 I, 곡류군 II, 단백질류는 4점, 채소류, 유지 및 당류는 3점, 과 일류와 우유류는 2점을 만점으로 하였다.

3) 사회, 인구학적 특성과 주관적 건강상태

한 달 평균 소득 및 식비, 생계지원사업 수혜 여부, 학력, 직업, 식생활 형편(가구 내 식품 불충분, food insuffi- ciency), 주관적 건강상태 등을 설문에 포함하였다. 경기북 부 5개 보건소 대상자들에서는 2009년 지역사회 건강조사 설문 문항과 중복되는 문항(예. 사회, 인구학적 특성 등)은 별도로 조사하지 않고 지역사회 건강조사 자료를 연계하여 사용하였다. 서울시의 5개 보건소 대상자의 경우는 모든 설 문 문항을 조사하였다.

2009년도 지역사회 건강조사에 참여했던 조사요원 중 일 부는 본 연구를 위해 훈련되었고 조사대상자와의 개별적 면 담을 2010년 6월 14일~7월 26일에 실시하였다. 서울시 5 개 보건소의 방문보건 대상자와 영양플러스 대상자는 방문 보건팀원과 본 연구진들이 직접 방문하여 2010년 9월 1일 부터 9월 15일까지 조사를 진행하였다.

3. 자료 분석

설문구성 항목의 내적 일치도(internal consistency of measures)는 Cronbach's α와 FACETS 프로그램으로 라 쉬모델(Rasch model))의 내적합지수(Infit Mean Square)를 구하여 평가하였다(US Department of Agriculture 2000; Linacre 2004; Gulliford 등 2006).

라쉬모델은 항목문항이론(item response theory)에 근거 하여 식품안정성의 항목별 및 영역별로 표준화 점수를 산출 하는 기법으로, 식품 불안정 문항의 적합도와 대상가구의 식 품 불안정 점수를 연속등간척도로 변환시키는데 가장 적합 한 모형으로 알려져 있다. 내적합지수 1은 일치도 모형 가설 이 완벽하다는 것(complete)을 의미하고, 0.8~1.2는 가설 이 수용됨을(good), 0.7~1.3은 수용가능성이 있음을 제시 한다(Connell 등 2004).

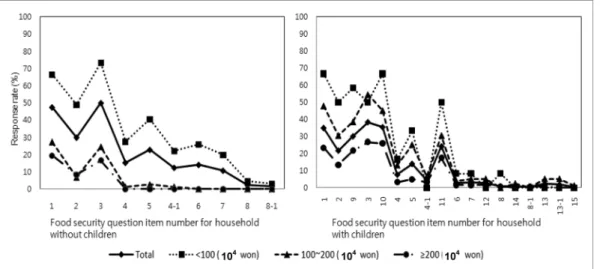
설문 항목이 측정하고자 하는 이론적 개념(theoretical constructs)을 잘 반영하고 있는지를 나타내는 구성 타당도 (construct validity) 평가에는 유사성 패턴 분석을 사용하 였다. 유사성 패턴은 소득수준에 따른 설문문항의 심각도의 유사성(parallelism)을 의미한다. 유사성은 사회경제적 계 층(소득)에 따라 식품 안정성 설문 항목에 ‘예’에 해당하는 백분율을 구하여 분석하였다.

측정하고자 하는 식품안정성의 이론적 개념이 이와 관련

(4)

된 하나 또는 그 이상의 기준(criteria)과의 연관성을 의미 하는 준거타당도(criterion-related validity)는 식품안정 성 수준과 사회경제적 지표(교육수준, 월 가구소득, 한달 식 비, 한달 식비 충분기간), 주관적 건강상태, 식품 섭취의 다 양성과의 상관성을 구하여 평가하였다. 상관성 분석에는 일 반선형모형(general linear model)과 Tukey's test를 사

용하였다. 본 연구는 모든 자료를 SAS 9.1 프로그램(SAS Version 9.1)으로 분석하였다.

—————————————————————————

결 과

—————————————————————————

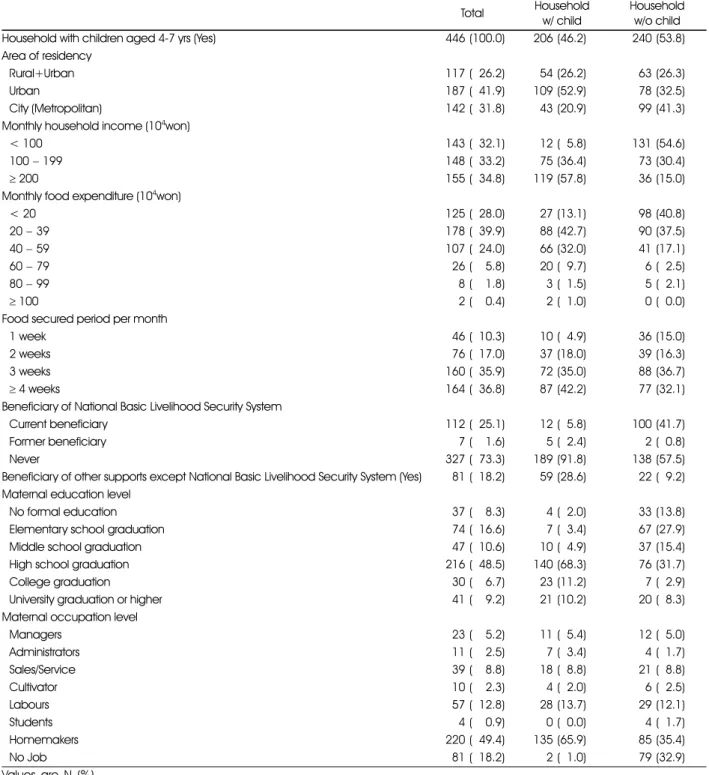
Table 1에 제시한 조사대상 가구의 특성 중 만 4~17세

Table 1. General characteristics of household

Total Household w/ child

Household w/o child

Household with children aged 4-7 yrs (Yes) 446 (100.0) 206 (46.2) 240 (53.8)

Area of residency

Rural+Urban 117 (526.2) 54 (26.2) 63 (26.3)

Urban 187 (541.9) 109 (52.9) 78 (32.5)

City (Metropolitan) 142 (531.8) 43 (20.9) 99 (41.3)

Monthly household income (10

4

won)

< 100 143 (532.1) 12 (55.8) 131 (54.6)

100 − 199 148 (533.2) 75 (36.4) 73 (30.4)

≥ 200 155 (534.8) 119 (57.8) 36 (15.0)

Monthly food expenditure (10

4

won)

< 20 125 (528.0) 27 (13.1) 98 (40.8)

20 − 39 178 (539.9) 88 (42.7) 90 (37.5)

40 − 59 107 (524.0) 66 (32.0) 41 (17.1)

60 − 79 26 (555.8) 20 (59.7) 6 (52.5)

80 − 99 8 (551.8) 3 (51.5) 5 (52.1)

≥ 100 2 (550.4) 2 (51.0) 0 (50.0)

Food secured period per month

1 week 46 (510.3) 10 (54.9) 36 (15.0)

2 weeks 76 (517.0) 37 (18.0) 39 (16.3)

3 weeks 160 (535.9) 72 (35.0) 88 (36.7)

≥ 4 weeks 164 (536.8) 87 (42.2) 77 (32.1)

Beneficiary of National Basic Livelihood Security System

Current beneficiary 112 (525.1) 12 (55.8) 100 (41.7)

Former beneficiary 7 (551.6) 5 (52.4) 2 (50.8)

Never 327 (573.3) 189 (91.8) 138 (57.5)

Beneficiary of other supports except National Basic Livelihood Security System (Yes) 81 (518.2) 59 (28.6) 22 (59.2) Maternal education level

No formal education 37 (558.3) 4 (52.0) 33 (13.8)

Elementary school graduation 74 (516.6) 7 (53.4) 67 (27.9)

Middle school graduation 47 (510.6) 10 (54.9) 37 (15.4)

High school graduation 216 (548.5) 140 (68.3) 76 (31.7)

College graduation 30 (556.7) 23 (11.2) 7 (52.9)

University graduation or higher 41 (559.2) 21 (10.2) 20 (58.3)

Maternal occupation level

Managers 23 (555.2) 11 (55.4) 12 (55.0)

Administrators 11 (552.5) 7 (53.4) 4 (51.7)

Sales/Service 39 (558.8) 18 (58.8) 21 (58.8)

Cultivator 10 (552.3) 4 (52.0) 6 (52.5)

Labours 57 (512.8) 28 (13.7) 29 (12.1)

Students 4 (550.9) 0 (50.0) 4 (51.7)

Homemakers 220 (549.4) 135 (65.9) 85 (35.4)

No Job 81 (518.2) 2 (51.0) 79 (32.9)

Values are N (%)

(5)

아동 포함 가구는 46.2%이었다. 지역 분포는 도시와 농촌의 중간 지역 41.9%, 도시 지역 31.8%, 농촌은 32%였다. 월 평균 가구 소득은 100만원 미만, 100만원~199만원, 200 만원 이상이 각각 1/3에 해당하였다. 한 달 식비는 20~40 만원이 39.9%로 가장 많았고, 20만원 미만이 28.0%, 40~60만원은 24.0%이었다. 한 달을 기준으로 식비가 충 분한 기간은 1주 10.3%, 2주 17.0%, 3주 이상은 72.7%

로 조사되었다. 현재 기초생활수급자 가구가 25.1%, 과거 수급자 가구는 1.6%였고, 기초생활수급자 지원금 외에 정 부나 민간단체로부터 생활도움을 받는 가구는 18.2%에 해 당하였다. 조사대상 성인의 교육수준은 고등학교 졸업자가 48.5%로 가장 많았고, 직업의 종류는 주부가 49.4%, 무직 이 18.2%, 기능직 및 단순노무직이 12.8%의 순이었다.

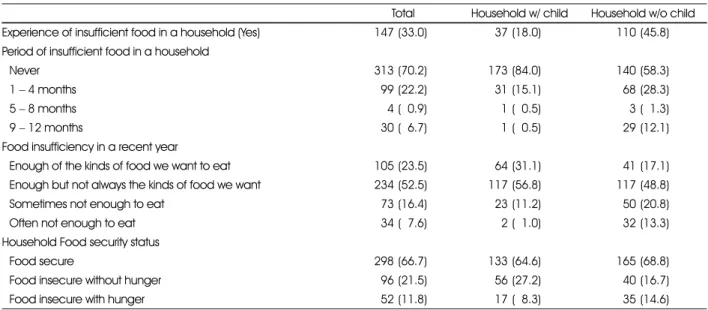
가구 내 식품이 불충분했던 경험이 있다고 응답한 가구가 약 30%였고 식품이 불충분했던 기간은 1~4개월이 22.2%

로 가장 많았다. 최근 1년간 ‘가족 모두가 충분한 양과 다양 한 종류의 음식을 먹었다’고 응답한 비율은 아동포함 가구 31.1%, 아동비포함 가구는 17.1%였고, 아동이 없는 가구

에서 ‘경제적으로 어려워서 가끔 또는 자주 먹을 것이 부족 했다’는 아동비포함 가구는 34.2%로 아동포함 가구 (12.2%)보다 많았다(Table 2). 사용한 식품안정성 측정 도구에 의해 측정된 식품안정성이 확보된 가구 비율은 66.7%

였고, 배고픔을 동반하지 않은 식품 불안정성 시작 단계가 21.5%, 배고픔을 동반하는 식품 불안정 단계는 11.8%였 다. 배고픔을 동반하는 식품 불안정 단계는 아동포함 가구 8.3%, 아동비포함 가구 14.6%로, 아동비포함 가구에서 더 높았다(Table 2).

개발된 식품안정성 측정도구를 기준으로 식생활 형편 문 항을 평가한 결과, 식품 불안정성으로 구분된 가구(148 가 구)에서 ‘경제적으로 어려워서 가끔/자주 먹을 것이 부족했 음’에 해당하는 가구는 56.8%인 반면, 식품안정성으로 구 분된 가구(298 가구)는 문항에서 ‘충분한 양과 다양한 종류 의 음식을 섭취 또는 충분한 양의 음식을 먹을 수 있었으나 다양한 종류의 음식을 먹지 못함’이라고 응답한 가구가 92.3%

이었다. 이러한 결과는 식품안정 가구를 안정 가구로 구분할 수 있는 특이도(specificity)는 높지만 식품 불안정 가구를

Table 3. Sensitivity and specificity of food insufficiency questionnaire with food security status by the developed questionnaire Food security status

p-value

Food insufficiency Food secure Food insecure

Enough of the kinds of food we want to eat OR Enough but not always the

kinds of food we want 275 (592.3) 64 (543.2) < 0.0001

Sometimes or often not enough to eat 23 (557.7) 84 (556.8)

Total 298 (100.0) 148 (100.0)

Sensitivity 56.8

Specificity 92.3

Values are N (%)

Table 2. Household food security status

Total Household w/ child Household w/o child Experience of insufficient food in a household (Yes) 147 (33.0) 37 (18.0) 110 (45.8) Period of insufficient food in a household

Never 313 (70.2) 173 (84.0) 140 (58.3)

1 − 4 months 99 (22.2) 31 (15.1) 68 (28.3)

5 − 8 months 4 (50.9) 1 (50.5) 3 (51.3)

9 − 12 months 30 (56.7) 1 (50.5) 29 (12.1)

Food insufficiency in a recent year

Enough of the kinds of food we want to eat 105 (23.5) 64 (31.1) 41 (17.1)

Enough but not always the kinds of food we want 234 (52.5) 117 (56.8) 117 (48.8)

Sometimes not enough to eat 73 (16.4) 23 (11.2) 50 (20.8)

Often not enough to eat 34 (57.6) 2 (51.0) 32 (13.3)

Household Food security status

Food secure 298 (66.7) 133 (64.6) 165 (68.8)

Food insecure without hunger 96 (21.5) 56 (27.2) 40 (16.7)

Food insecure with hunger 52 (11.8) 17 (58.3) 35 (14.6)

(6)

불안정 가구로 구분할 수 있는 민감도(sensitivity)는 상대 적으로 낮음을 보여준다(Table 3).

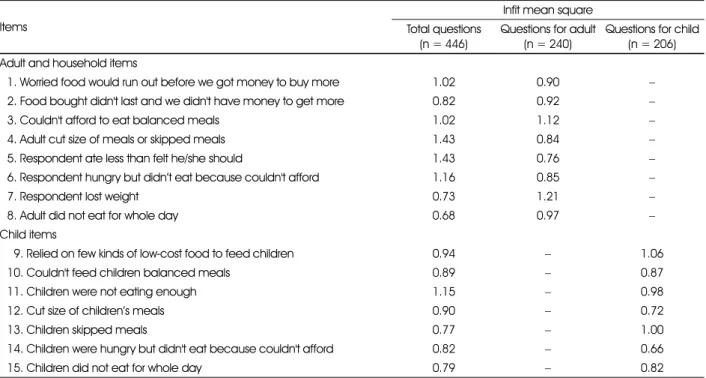
식품 안정성 측정 도구의 내적일치도를 평가한 결과 내적 일치도 계수(Cronbach’s α)는 0.838이고, 특정한 하나의 문항을 제거했을 때의 내적 일치도의 범위는 0.824~0.850 이었다(Table 4). 라쉬모형을 사용하여 측정한 문항의 적

합도는 내적합 지수(infit mean square)로 평가하였을 때, 성인가구와 아동가구에서 전체 15문항은 0.68~1.43 범위 를 나타냈다. 성인 관련 문항(8문항)만으로 분석하였을 때 내적합 지수는 0.76~1.21로 대부분 수용범위(0.8~1.2)에 해당하였다. 아동과 관련 7문항의 내적합 지수의 범위는 0.66~1.06으로, '배고픈데도 먹지 못한 적’의 문항(0.66)

Table 4. Meeting degree coefficient after elimination of questions

Items Response Meeting degree coefficient after

elimination of questions Adult and household items

1. Worried food would run out before we got money to buy more ‘Sometimes’ OR ‘Often’ 0.831 2. Food bought didn't last and we didn't have money to get more ‘Sometimes’ OR ‘Often’ 0.829

3. Couldn't afford to eat balanced meals ‘Sometimes’ OR ‘Often’ 0.831

4. Adult cut size of meals or skipped meals ‘Yes’ 0.826

5. Respondent ate less than felt he/she should ‘Yes’ 0.824

6. Respondent hungry but didn't eat because couldn't afford ‘Yes’ 0.833

7. Respondent lost weight ‘Yes’ 0.832

8. Adult did not eat for whole day ‘Yes’ 0.849

Child items

59. Relied on few kinds of low-cost food to feed children

‘Sometimes’ OR ‘Often’ 0.842

10. Couldn't feed children balanced meals ‘Sometimes’ OR ‘Often’ 0.840

11. Children were not eating enough ‘Sometimes’ OR ‘Often’ 0.841

12. Cut size of children't meals ‘Yes’ 0.848

13. Children skipped meals ‘Yes’ 0.846

14. Children were hungry but didn't eat because couldn't afford ‘Yes’ 0.846

15. Children did not eat for whole day ‘Yes’ 0.850

Total Cronbach's α 0.838

Table 5. Infit mean square using Rasch model

Items

Infit mean square Total questions

(n = 446)

Questions for adult (n = 240)

Questions for child (n = 206) Adult and household items

1. Worried food would run out before we got money to buy more 1.02 0.90 −

2. Food bought didn't last and we didn't have money to get more 0.82 0.92 −

3. Couldn't afford to eat balanced meals 1.02 1.12 −

4. Adult cut size of meals or skipped meals 1.43 0.84 −

5. Respondent ate less than felt he/she should 1.43 0.76 −

6. Respondent hungry but didn’t eat because couldn't afford 1.16 0.85 −

7. Respondent lost weight 0.73 1.21 −

8. Adult did not eat for whole day 0.68 0.97 −

Child items

59. Relied on few kinds of low-cost food to feed children

0.94 − 1.06

10. Couldn't feed children balanced meals 0.89 − 0.87

11. Children were not eating enough 1.15 − 0.98

12. Cut size of children’s meals 0.90 − 0.72

13. Children skipped meals 0.77 − 1.00

14. Children were hungry but didn't eat because couldn't afford 0.82 − 0.66

15. Children did not eat for whole day 0.79 − 0.82

(7)

을 제외한 문항들은 수용가능 범위를 보였다(Table 5).

식품 안정성 설문 문항을 심화단계별로 나열한 후 소득수 준별(100만원 미만, 100~200만원 미만, 200만원 이상) 로 패턴의 유사성으로 구성타당도를 평가한 결과 아동비포 함, 포함 가구 모두에서 소득 수준에 따라 평행된 패턴 결과 를 보였다(Fig. 1). 아동비포함 가구는 ‘질이 낮은 식품의 섭 취 상태’에 해당하는 가구 비율이 가장 높았고, 그 다음은 ‘식 품 부족에 대한 걱정’, ‘충분한 양을 먹지 못한 상태’, 이로 인 한 잠재적인 결과를 가진 상태 순으로 조사되었다. 아동 포 함 가구에서는 ‘질이 낮은 식품의 섭취’, ‘식품 부족에 대한 걱정’, ‘먹을 것이 떨어진 적이 있거나 필요한 만큼 아동에게

주지 못한 적’, ‘먹어야 하는 양보다 적게 먹은 적’, ‘성인에 서 배고픈 상태 경험한 적’, ‘아동에서 배고픈 상태 경험한 적’으로 응답 순위를 보였다.

측정도구의 준거타당도 평가에서 식품 불안정성은 사회, 인구학적 요인, 건강상태, 식사의 다양성과의 관련성을 나타 냈다. 식품 불안정 심각도가 높을수록 성인의 교육수준이 낮 고, 월 가구소득과 식비가 낮았으며, 한 달 식비 충분 기간도 짧았고, 성인과 아동에서 주관적 건강수준도 낮았다(Table 6). 식품 섭취의 다양성과 관련하여 성인은 곡류군 I(곡류, 면류, 떡류, 빵류), 곡류군 II(시리얼류, 감자류, 면류, 견과 류) 그리고 채소류(해조류, 버섯류 포함)를 제외한 나머지

Fig. 1. Assessment of food security questionnaire severity according to household income

1=’Worried food would run out before we got money to buy more.’, 2=’Food bought didn't last and we didn't have money to get more.’, 3=’Couldn't afford to eat balanced meals.’, 4=’Adult cut size of meals or skipped meals.’, 5=’Respondent ate less than felt he/

she should.’, 6=’Respondent hungry but didn't eat because couldn't afford.’, 7=’Respondent lost weight.’, 8=’Adult did not eat for whole day.’, 9=’Relied on few kinds of low-cost food to feed children.’, 10=’Couldn't feed children balanced meals.’, 11=’Children were not eating enough.’, 12=’Cut size of children's meals.’, 13=’Children skipped meals.’, 14=’Children were hungry but didn't eat because couldn't afford.’, 15=’Children did not eat for whole day.’, Questions of 4-1, 8-1, and 13-1 indicate ’how often.’

Table 6. Relations of household food security status with socioeconomic status and level of subjective health state

Variables

Household food security status

p-value

1)

Food secure Food insecure

Without hunger With hunger

Adults (N=446) (N=298) (N=96) (N=52)

Education (years) 10.70 ± 0.24

a

9.80 ± 0.43

ab

8.20 ±

50.58b

0.0002

Monthly household income (10

4

won) 160.00 ± 4.45

a

120.00 ± 7.85

b

76.50 ± 10.70

c

< 0.0001 Monthly food expenditure (10

4

won) 36.10 ± 1.09

a

28.10 ± 1.91

b

22.70 ±

52.60b

< 0.0001 Food secured period per month (week) 3.30 ± 0.05

a

2.63 ± 0.09

b

1.90 ±

50.12c

< 0.0001 Level of subjective health state (0 − 4) 2.25 ± 0.05

a

1.68 ± 0.82

b

1.29 ±

50.11c

< 0.0001

Children (N = 206) (N=133) (N=56) (N=17)

Level of subjective health state (0 − 4) 2.93 ± 0.06

a

2.59 ± 0.09

b

2.47 ±

50.16b

0.0010 Values are Mean ± SE

a, b: Means with different superscript letters are significantly different from each other at p < 0.05 by Tukey's test

1) General linear model test

(8)

식품군(단백질류, 과일 및 주스류, 우유 및 유제품류, 유지류 및 당류)에서 식품 불안정이 심할수록 식품 섭취 빈도가 낮 았다. 아동에서는 과일 및 주스류 섭취가 식품 불안정성이 심 화될수록 낮았고, 이를 제외한 식품군에서는 유의한 차이가 없었다(Table 7).

—————————————————————————

고 찰

—————————————————————————

본 연구는 국민건강영양조사에서의 활용을 고려하여 개발 된 한국형 식품안정성 측정 도구의 신뢰도와 타당도를 평가 하였다. 개발된 한국형 식품안정성 측정 도구는 비교적 높은 내적 일치도와 함께 구성 타당도, 준거 타당도의 적합성을 나 타내 국민건강영양조사에서의 적용 가능성을 보여주었다.

현재 국민건강영양조사에서 사용되고 있는 식품안정성 측정은 미국 NHANES III에서 사용되었던 단일 문항으로 구성된 식품 불충분성 설문 문항(food insufficiency questionnaire)을 이용한 것이다. 이 문항은 경제적 어려움 으로 인한 가구 내 식품 부족 문제 여부를 조사하는 것으로 식품의 유용성, 접근성, 이용성 측면을 고려해야 하는 식품 안정성(식품 공급의 안정성에 대한 걱정, 식품의 질적 및 양 적 섭취의 감소, 결식, 배고픔, 체중 감소) 수준의 적합한 측

정에는 제한이 있다(Anderson 1990). 이에 미국에서는 18개의 설문 문항으로 구성된 미국 식품안정성 조사 모듈 (US HFSSM)의 새로운 식품안정성 지표를 개발하고 타당 도 검증을 거쳐 현재 국가 조사에 사용하고 있다. 기존에 국 민건강영양조사에서 사용되었던 식품안정성 측정 문항과 미 국 식품안정성 조사 모듈(US HFSSM)을 근거로 새로 개발 된 식품안정성 측정 도구와의 관련성을 분석한 이 연구 결과 는 기존의 식품안정성 단일 문항에서 조사된 식품안정성 수 준이 다소 과대추정이 되고 있음을 보여 기존 미국 연구 결 과와 일치하였다(Anderson 1990). 기존의 단일 문항에서 민감도는 56.8%로 식품 불안정성인 경우를 식품 불안정성 으로 구분할 수 있는 정도가 낮은 편이었다.

본 연구는 아동포함, 아동비포함 가구를 구분하여 자료를 분석하였다. 선행 국외연구에서 식품불안정성 수준은 제한 된 경제적 자원으로 인하여 가족 수와 비례하고, 특히 아동 포함 가구는 아동비포함 가구보다 그 수준이 높았다(Office of Nutrition Policy and Promotion 2007; Nord 등 2008; Temple 2008). 그러나 국내에서는 아동포함 가구 가 오히려 식품 불안정성 수준이 상대적으로 낮았는데(Kim 등 2009), 이는 아동포함 가구가 아동비포함 가구에 비해 빈곤율이 더 낮다는 보고와 연관된다(Jeong 등 2005). Lee

Table 7. Relations of household food security status with variety score of diet

Variables

Household food security status

p-value

3)

Food secure

Food insecure Without

hunger

With hunger

Adults (N = 446) (N=298) (N=96) (N=52)

Cereals I (0 − 4)

1)

1.73 ± 0.04 1.71 ± 0.07 1.58 ± 0.10 0.3466

Cereals II (0 − 4)

2)

0.58 ± 0.04 0.66 ± 0.07 0.40 ± 0.10 0.1027

Meats, fishes, shellfishes, eggs and beans (0 − 4) 1.99 ± 0.06

a

1.69 ± 0.11

b

1.00 ± 0.15

c

< 0.0001 Vegetables, seaweeds and mushrooms (0 − 3) 1.61 ± 0.04 1.52 ± 0.07 1.42 ± 0.10 0.1665

Fruits and juices (0 − 2) 1.01 ± 0.04

a

0.74 ± 0.07

b

0.46 ± 0.09

c

< 0.0001

Milk and dairy products (0 − 2) 0.77 ± 0.04

a

0.70 ± 0.07

a

0.38 ± 0.10

b

0.0016

Fats, oils and sugars (0 − 3) 1.38 ± 0.05

a

1.24 ± 0.09

ab

1.04 ± 0.12

b

0.0209

Children (N = 206) (N=133) (N=56) (N=17)

Cereals I (0 − 4)

1)

1.89 ± 0.07 2.00 ± 0.10 1.65 ± 0.19 0.2455

Cereals II (0 − 4)

2)

0.86 ± 0.06 0.64 ± 0.10 0.76 ± 0.19 0.1975

Meats, fishes, shellfishes, eggs and beans (0 − 4) 2.40 ± 0.09 2.09 ± 0.13 2.35 ± 0.24 0.1456 Vegetables, seaweeds and mushrooms (0 − 3) 1.59 ± 0.07 1.43 ± 0.11 1.71 ± 0.19 0.3209

Fruits and juices (0 − 2) 1.41 ± 0.06

a

0.96 ± 0.09

b

0.82 ± 0.16

b

< 0.0001

Milk and dairy products (0 − 2) 1.62 ± 0.05 1.43 ± 0.08 1.35 ± 0.14 0.0501

Fats, oils and sugars (0 − 3) 1.17 ± 0.08 1.02 ± 0.13 1.06 ± 0.23 0.5687

Values are Mean ± SE

a, b: Means with different superscript letters are significantly different from each other at p < 0.05 by Tukey's test 1) Rices, noodles, rice cakes for soups and breads

2) Cereals(corn flake), potatoes, Muk(Korean jellied food), Korean glass noodles, nuts, and rice cakes

3) General linear model test

(9)

등(2006)은 2003년에서 2006년까지 상대적인 빈곤율은 전체가구는 16.1%에서 19.7%로 증가하였으나 아동포함 가구의 경우는 12.6%에서 11.0%로 감소됨을 보고하였다.

본 연구에서도 배고픔을 동반하는 식품 불안정성은 아동포 함 가구는 8.3%로 아동비포함 가구의 14.6%보다 낮았다.

하지만 본 연구의 아동비포함 가구는 아동포함 가구에 비해 가구소득, 가구주 교육수준 등이 낮았다는 것은 결과 해석에 고려되어야 할 것이다.

식품안정성 수준은 가구 특성에 따라 다르기도 하지만 한 가구 내에서도 구성원들 간(아동과 성인)에 차이가 있을 수 있다(Nord & Bickel 2002; Wilde 2004). 식품안정성 도구의 측정 항목은 서열 관계(hierarchical relationship) 로 구성되어 식품불안정 상태가 시작되면, 먼저 가구 내 식 품이 떨어질 것에 대한 걱정, 그 다음은 섭취하는 식품의 질 감소, 이후 상황이 더 악화되면 먹는 식사의 양을 줄이다가 결국 식사를 걸러 배고픔을 느끼는 단계로 가는데, 이 때 식 사의 양을 줄이거나 식사를 거르고, 배고픔을 느끼는 수준은 아동포함 가구는 성인이 먼저 그 단계를 거치고 이후 더욱 상 황이 악화되면 아동이 같은 단계에 이르게 된다(Radimer 등 1990; Habicht 등 2004; National Research Council 2006). 이와 비슷한 단계 패턴은 본 연구에서도 나 타났다. 식품안정성 측정 문항을 심화단계(severity)별로 나열하여 분석한 결과, 식품의 질 감소나 식품이 떨어질 것 에 대한 걱정 비율이 가장 높았고, 다음으로 식품의 양 감소, 배고픔의 경험, 하루 종일 먹지 못한 항목의 순이었다. 유사 한 수준의 식품불안정성 설문에서 아동은 성인에 비해 해당 비율이 낮았다(Fig. 1).

식품 불안정 수준은 사회경제적 수준과 매우 밀접한 관련 성이 있고, 이러한 관련성은 불량한 식품 섭취와 영양 상태, 육체적 및 정신적 불건강 상태를 초래하므로(Anderson 1990; Hamilton 등 1997; Kim 등 2008; Kim 등 2011) 식품안정성 측정 도구의 준거 타당도는 이들 요인간 의 상관성에 근거하여 평가된다(Kendall 등 1995;

Frongillo 1999; Perez-Escamilla 등 2004; Coates 등 2006; Frongillo & Nanama 2006; Gonzalez 등 2008). 이 연구도 식품안정성 수준과 사회경제적 수준, 식 품섭취, 건강 상태와의 상관성을 분석하여 준거 타당도를 평 가하였다. 그 결과, 기존 연구와 같이 식품 불안정은 낮은 월 가구 소득과 교육 수준, 불충분한 한 달 식비 기간, 낮은 주 관적 건강 수준, 식사의 다양성 감소와 상관성을 보였다. 이 러한 상관성은 성인과 아동에서 모두 나타났다. 특히 식품 불 안정성은 식비와 상관성이 있으며 상대적으로 식품 가격에 민감한 과일류, 육류, 유제품의 섭취가 성인, 아동 모두에서

식품불안정 정도가 높을수록 더 낮게 나타나 국외 연구 결과 와도 일맥상통하였다(Perez-Escamilla 등 2004; Melgar- Quinonez 등 2006).

—————————————————————————

요약 및 결론

—————————————————————————

본 연구는 국민건강영양조사에 적용 가능한 측정 도구 로 미국 식품안정성 조사 모듈(US HFSSM)을 기반으로 질 적 타당도가 검증된 측정 도구에 대해 신뢰도 및 타당도 검 증을 실시하였다. 연구 대상은 총 446가구로 아동포함 가구 는 46.2%였다. 연구 결과를 요약하면 다음과 같다.

1. 대상 가구의 식품 안정성 비율은 66.7%가 식품 안정성 단계(food secure), 21.5%가 배고픔을 동반하지 않는 식 품불안정 단계, 11.8%는 배고픔을 동반하는 식품불안정 단 계에 해당하여 전체 식품 불안정(food insecure) 가구는 33.3%로 나타났다.

2. 식품안정성 측정 도구의 신뢰도 평가에서는 0.84의 내 적 일치도 계수(Cronbach's α)를 보였고, 라쉬모델 분석에 서 내적합지수는 0.68~1.43의 범위를 나타내 문항들 간의 일치도가 수용될 수 있음을 제시하였다.

3. 식품안정성 측정 도구의 구성 타당도는 식품 안정성 수 준의 심각도에 따른 항목별 ‘예’ 비율을 분석하였고, 그 결과 식품 안정성의 문항들은 심화 단계에 따라 적절히 구성되었 음을 알 수 있었다.

4. 식품안정성 측정 도구의 준거 타당도 평가에서는 식품 불안정의 심각도가 높을수록 성인의 교육수준이 낮고, 월 가 구소득과 식비가 낮았으며, 한 달 식비 충분 기간도 짧았고, 성인과 아동 모두에서 주관적 건강수준이 낮았다. 식품 섭취 의 다양성과 관련하여, 식품 불안정 가구 대상자는 단백질 류, 과일 및 주스류, 우유 및 유제품류, 유지류 및 당류에서 섭취 빈도가 낮아 측정 도구의 준거 타당도가 적합함을 나타 냈다.

위의 결과는 미국 식품안정성 조사 모듈(US HFSSM)을 근거로 국내 실정에 맞게 개발한 식품 안정성 측정 도구는 신 뢰도와 타당도가 적합한 것으로 나타나 국민건강영양조사에 적용 가능한 것을 보여준다. 그러나 조사대상자 수나 거주지 역이 제한되어 향후 대규모 조사인 국민건강영양조사 참여 자를 대상으로 연구 결과에 대한 검증도 이루어져야 할 것이다.

—————————————————————————

참 고 문 헌

—————————————————————————

Anderson SA (1990): Core indicators of nutritional state for difficult-

to-sample populations. J Nutr 120(Suppl 11): 1559-1600

(10)

Coates J, Frongillo EA, Rogers BL, Webb P, Wilde PE, Houser R (2006): Commonalities in the experience of household food insecurity across cultures: what are measures missing? J Nutr 136(5): 1438S-1448S

Connell CL, Nord M, Lofton KL, Yadrick K (2004): Food security of older children can be assessed using a standardized survey instrument. J Nutr 134: 2566-2572

Food and Agriculture Organization of the United Nations (2002a):

The State of Food Insecurity in the World 2001. Rome: Food and Agriculture Organization of the United Nations

Food and Agriculture Organization of the United Nations (2002b):

Measurement and assessment of food deprivation and undernutrition. International Scientific Symposium, Rome: Food and Agriculture Organization of the United Nations

Frongillo EA (1999): Validation of measures of food insecurity and hunger. J Nutr 129: 506S-509S

Frongillo EA, Nanama S (2006): Development and validation of an experience-based measure of household food insecurity within and across seasons in Northern Burkina Faso. J Nutr 136(5):

1409S-1419S

Gonzalez W, Jimenez A, Madrigal G, Munõoz LM, Frongillo EA (2008): Development and validation of measure of household food insecurity in urban costa rica confirms proposed generic questionnaire. J Nutr 138: 587-592

Gulliford MC, Nunes C, Rock EB (2006): The 18 household food security survey items provide valid food security classifications for adults and children in the Caribbean. BMC Public Health 6:

26

Habicht JP, Pelto G, Frongillo EA, Rose D (2004): Conceptualization and instrumentation of food insecurity. Proceedings of the Workshop on the Measurement of Food Insecurity and Hunger.

National Academy Press, Washington DC

Hamilton WL, Cook JT, Thompson WW, Buron LF, Frongillo EA, Olson CM, Wehler CA (1997): Household food security in the United States in 1995. Summary report of the food security measurement project. US Department of Agriculture, Washington DC

Jeong JH, Hwang DS, Kum JH, Lee BH, Park CY (2005): A study on the working poor in Korea. Report no. 2005-03. Korea Labor Institute, Seoul

Kendall A, Olson CM, Frongillo EA (1995): Validation of the Radimer/Cornell measures of hunger and food insecurity. J Nutr 125: 2793-2801

Kim K, Hong SA, Kim MK (2008): Nutritional status and food insufficiency of Korean population through the life-course by education level based on 2005 National Health and Nutrition Survey. Korean J Nutr 41(7): 667-681

Kim K, Kim MK (2009): Development and validation of food security measure. Korean J Nutr 42(4): 374-385

Kim K, Kim MK, Shin YJ (2009): Household food insecurity and its characteristics in Korea. Health & Soc Welfare Rev 29(2): 268- 292

Kim K, Kim MK, Shin YJ, Lee SS (2011): Factors related to household food insecurity in the Republic of Korea. Public Health Nutr 14(6): 1080-1087

Korea Health Industry Development Institute (2003): Korean National

Health and Nutrition Examination Survey, In depth analysis - Nutrition survey. Ministry of Health and Welfare, Seoul

Korea Health Industry Development Institute (2007): The third(2005) Korean National Health and Nutrition Examination Survey, In depth analysis - Nutrition survey. Ministry of Health and Welfare, Seoul

Korean Nutrition Society (2010): Dietary reference intake for Koreans. Hanarum, Seoul, pp. 23-553

Kwon SO, Oh SY (2007): Associations of household food insecurity with socioeconomic measures, health status and nutrient intake in low income elderly. Korean J Nutr 40(8): 762-768

Lee HJ, Kim MG, Noe DM, Kang SH, Son BD, You JY, Lim WS (2006): The structure of poverty in Korea. Report no. 2006-10.

Korean Institute for Health and Social Affairs, Ministry of Health and Welfare, Seoul

Linacre JM (2004): A user's guide to WINSTEPS MINISTEPS:

Rasch model computer programs. Winsteps.com, Chicago

Melgar-Quinonez HR, Zubieta AC, MkNelly B, Nteziyaremye A, Gerardo MF, Dunford C (2006): Household food insecurity and food expenditure in Bolivia, Burkina Faso, and the Philippines. J Nutr 136(5): 1431S-1437S

National Research Council (2006): Food insecurity and hunger in the United States: An assessment of the measure. Panel to Review U.S. Department of Agriculture's Measurement of Food Insecurity and Hunger, Wunderlich GS, Norwood JL, editors, Committee on National Statistics, Division of Behaviroal and Social Science and Education. The National Academies Press, Washington DC

Nord M, Andrews M, Carlson S (2006): Household Food Security in the United States in 2005. US Department of Agriculture, Washington DC

Nord M, Andrews M, Carlson S (2008): Household Food Security in the United States in 2007. US Department of Agriculture, Washington DC

Nord M, Bickel G (2002): Measuring children's food security in US household, 1995-99. US Department of Agriculture, Economic Research Service, Washington DC

Office of Nutrition Policy and Promotion, Health Products and Food Branch (2007): Canadian Community Health Survey, Cycle 2.2, Nutrition (2004) - Income-related household food security in Canada. Health Canada, Ottawa, Ontario. Available from http://

dsp-psd.pwgsc. gc.ca/collection_2007/hc-sc/H164-42-2007-1E.pdf [cited 2011 January 5]

Oh S-Y, Hong MJ (2003): Food security is associated with dietary intake and body size of Korean children from low-income families in urban area. Eur J Clin Nutr 57(12): 1598-1604

Oh S-Y, Kim K, Kwon SO, Hong SA (2010): Development and validation of Korean food security measures. Center for Disease Control & Prevention, Seoul

Perez-Escamilla R, Segall-Corra AM, Kurdian Maranha L, Sampaio Md Mde F, Marin-Leon L, Panigassi G (2004): An adapted version of the US department of agriculture food insecurity module is a valid tool for assessing household food insecurity in campinas. Brazil J Nutr 134: 1923-1928

Radimer KL, Olson CM, Campbell CC (1990): Development of

indicators to assess hunger. J Nutr 120(Suppl 11): 1544-1548

(11)

Shim JS, Oh K, Nam CM (2008): Association of household food security with dietary intake - Based on the third (2005) Korea National Health and Nutrition Examination Survey (KNHANES III). Korean J Nutr 41(2): 174-183

Swindale A, Bilinsky P (2006a): Development of a universally applicable household food insecurity measurement tool: Process, current status, and outstanding issues. J Nutr 136: 1449S-1452S Swindale A, Bilinsky P (2006b): Household Dietary Diversity Score

(HDDS) for measurement of household food access: Indicator guide. Available from http://www.fantaproject.org/publications [cited 2010 May 5]

Temple JB (2008): Severe and moderate forms of food insecurity in Australia: are they distinguishable? Aust J Soc Issues 43: 649- 668

US Department of Agriculture (2000): Guide to measuring household food security. US Department of Agriculture, Washington DC Webb P, Coates J, Frongillo EA, Rogers BL, Swindale A, Bilinsky P

(2006): Measuring household food insecurity: why it's so important and yet so difficult to do. J Nutr 136(5): 1404S-1408S Wilde PE (2004): Differential response patterns affect food-security

prevalence estimates for households with and without children. J

Nutr 134: 1910-1915

수치

Table 1. General characteristics of household
Table 3. Sensitivity and specificity of food insufficiency questionnaire with food security status by the developed questionnaire  Food security status
Table 5. Infit mean square using Rasch model
Fig. 1. Assessment of food security questionnaire severity according to household income
+2

참조

관련 문서

Impact of age at first childbirth on glucose tolerance status in postmenopausal women: the 2008-2011 Korean National Health and Nutrition Examination

Age-related changes in the prevalence of osteoporosis according to gender and skeletal site: The Korea National Health and Nutrition Examination Survey 2008-2010..

Objective: The purpose of this study is to investigate the relationship between depression and evening meals for adult women by using the National Health and Nutrition Survey

socioeconomic status and thyroid cancer prevalence; Based on the korean National Health and Nutrition Examination Survey2010-2011. Jung YI, Kim

Dong Won Lee, Young Dug Bae, Suk Kwon Kim, Hee Yun Shin, Bong Guen Hong, Hyun Kyu Jung, Yang Il Jung, Jeong Yong Park, Byung Kwon Choi, and Yong Hwan Jeong(KAERI). P07B04

Prevalence of Undiagnosed Diabetes and Related Factors in Korean Postmenopausal Women:.. The 2011-2012 Korean National Health and

Objective: This study was conducted to identify the association between vitamin D and Sarcopenia among all adults in Korea using data from the National Health and

Income security, health and medical care, welfare measures through long-term care and assisted living facilities, social participation by working are the key elements and all