INTRODUCTION
Methylphenidate (MPH), which inhibits dopamine reup- take in the central nervous system, is the most commonly pre- scribed medication for the treatment of attention-deficit/hy- peractivity disorder (ADHD) [1]. It remains unclear whether MPH affects growth in children as a side effect. Previous stud- ies have suggested that MPH may suppress growth in chil- dren with ADHD [2,3]. Other studies, on the contrary, have demonstrated that MPH treatment may not affect growth in
children with ADHD [4,5]. It has also been suggested that the pathophysiology of ADHD itself could suppress growth [6]. Thus, so far, the findings on whether MPH is associated with growth suppression in children with ADHD have been inconclusive. In addition to anthropometric indices such as height and weight, serum biochemical markers of growth could be considered when measuring the growth status of children. Growth hormones and thyroid hormones are di- rectly involved in growth, affecting the synthesis and release of growth factors. Adequate bone mineralization and forma- tion, which are related to the metabolism of calcium, phos- phorus, and vitamin D, are essential to growth [7]. Serum bio- chemical markers representing nutritional status, such as
This is an Open Access article distributed under the terms of the Creative Commons Attribution Non-Commercial License (https://creativecommons.org/licenses/by-nc/4.0) which permits unrestricted non-commercial use, distribution, and reproduction in any medium, provided the original work is properly cited.
Preliminary Investigation of Association between
Methylphenidate and Serum Growth Markers in Children with Attention-Deficit/Hyperactivity Disorder:
A Cross-Sectional Case-Control Study
Woo Jin Kim
1, Young Rong Bang
2, Je-Wook Kang
3, Jae Ho Yoo
4, Seong Hwan Kim
2, and Jae Hong Park
21
Department of Psychiatry, Dong-A University Graduate School of Medicine, Busan, Korea
2
Department of Psychiatry, Dong-A University Hospital, Busan, Korea
3
Department of Psychiatry, Inje University Busan Paik Hospital, Busan, Korea
4
Department of Pediatrics, Dong-A University Hospital, Busan, Korea
Objectives: It remains unclear whether methylphenidate (MPH) has yadverse effects on growth in children. This study aimed to investigate the association of MPH with serum biological markers of growth in children with attention-deficit/hyperactivity disorder (ADHD).
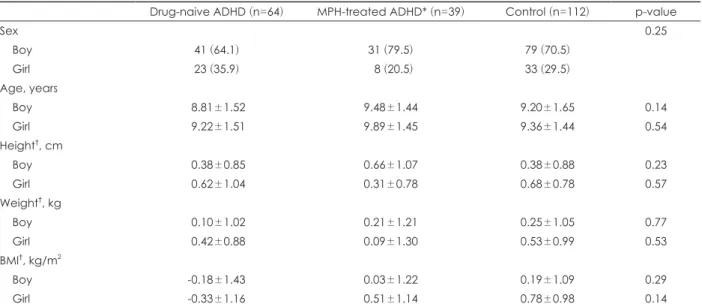
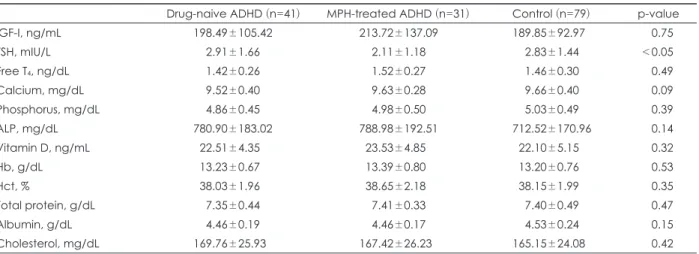
Methods: The present study included 103 children with ADHD (64 drug-naive children, 39 MPH-treated children) and 112 control subjects. Children with ADHD were diagnosed on the basis of a semi-structured interview. Levels of biochemical markers of growth, including insulin-like growth factor-I, thyroid stimulating hormone (TSH), free T
4, calcium, phosphorus, alkaline phosphatase, vitamin D, hemoglobin, total protein, albumin, total cholesterol, and hematocrit were measured in these individuals.
Results: Except in case of TSH, no intergroup differences were found in the levels of the growth markers. The levels of TSH were found to be lower in the MPH-treated boys with ADHD than in the drug-naive and control groups (p<0.05), although the levels of TSH in all the groups were within normal limits.
Conclusion: In this cross-sectional study, no significant association was found between MPH and growth markers. This calls for the need to carry out prospective longitudinal research studies in the future that investigate the effect of MPH on the growth trajectory in children.
Key Words: ADHD; Methylphenidate; Side effect; Growth; Case-control study.
Received: March 19, 2020 / Revision: June 9, 2020 / Accepted: June 15, 2020
Address for correspondence: Jae Hong Park, Department of Psychiatry, Dong-A University Hospital, 26 Daesingongwon-ro, Seo-gu, Busan 49201, Korea
Tel: +82-51-240-5467, Fax: +82-51-253-3542, E-mail: [email protected]
hemoglobin (Hb), hematocrit (Hct), total protein, albumin, and total cholesterol, play an important role in growth [8].
Therefore, the analysis of biochemical growth markers is rel- evant in studies investigating factors that influence the growth of children. Although most studies have focused only on an- thropometric indices, few studies have compared the growth of children with ADHD on the basis of particular biochem- ical markers.
This study aims to investigate differences in the serum bio- chemical markers of growth among MPH-treated children with ADHD, drug-naive children with ADHD, and healthy control subjects.
METHODS
Participants
A cross-sectional case-control study was conducted as part of a broader investigation by the Korea Food and Drug Ad- ministration; this study aimed to examine the association between adverse environmental exposure and neurodevel- opmental disorders [9]. The participants included 215 chil- dren aged 6 to 12 years (64 drug-naive children with ADHD, 39 MPH-treated children with ADHD, and 112 healthy con- trol subjects), who were enrolled at two university hospitals (Dong-A Univerisity Hospital, Inje University Busan Paik Hospital) in Busan, Korea. The ADHD and control subjects were recruited via advertisements at the two university hos- pitals and in the local communities. The study protocol was approved by the Institutional Review Board of the National Cancer Center (NCCNCS13712).
Participants were classified into case and control groups after physical and psychiatric evaluation by pediatricians and child psychiatrists. The inclusion criteria for ADHD cases were as follows: 1) children between the ages of 6 and 12 years, 2) diagnosis of ADHD based on the Diagnostic and Statisti- cal Manual of Mental Disorders, 4th edition (DSM-IV) [10], and 3) provision of written informed consent by the parents and assent from the child. The exclusion criteria were as fol- lows: 1) neurological disorders, such as epilepsy, cerebral pal- sy, mental retardation, or pervasive developmental disorders;
2) congenital malformation, hematological disorders, or chronic physical diseases; 3) acute diseases (including upper respiratory infection, enteritis) at the time of enrolment; and 4) previous history of head injury. Children with ADHD were divided into an MPH-treated ADHD group and a drug-naive group. The control group included healthy subjects who met all the above criteria, except ADHD diagnosis and treatment.
ADHD diagnosis
The screening section and ADHD supplement section of
the Korean version of the Kiddie-Schedule for Affective Dis- orders and Schizophrenia-Present and Lifetime Version (K- SADS-PL-K) [11] were used to diagnose ADHD. The K-SADS- PL-K is a semi-structured interview tool based on DSM-IV.
Anthropometric indices
Height and weight were measured for each child. The body mass index (BMI) was calculated in units of kg/m
2. Then we transformed height, weight, and BMI to age- and sex-correct- ed standard scores (z-score) using norms from the 2017 Ko- rean National Growth Charts for children and adolescents [12].
Biochemical markers of growth
Blood sampling was carried out at the two university hos- pitals. The blood samples were transferred to the Dong-A University Hospital for hematological analysis of biochemi- cal markers.
Measurement of insulin-like growth factor-I levels Although the levels of most growth hormones have diur- nal variations, the levels of insulin-like growth factor-I (IGF-I) are maintained at a constant range. Thus, the serum concen- trations of IGF-I were used as biochemical markers of growth hormone secretion [13]. A one-step sandwich chemilumi- nescence immunoassay was carried out to measure the IGF-I concentrations using the Liaison autoanalyzer (DiaSorin, Saluggia, Italy).
Measurement of thyroid hormone levels
The direct effects of thyroid hormones on growth include stimulation of endochondral ossification, maturation of epiph- yseal plates in bones, linear bone growth, and increase in the maturation and activity of chondrocytes in the growth plate cartilage [14,15]. In the present study, the serum concentra- tions of thyroid stimulating hormone (TSH) and thyroxine (free T
4) were measured using a chemiluminescent micropar- ticle immunoassay (Architect TSH Reagent Kit, Architect Free T
4Reagent Kit; Abbott Ireland Diagnostics Division, Longford, Ireland).
Measurement of calcium, phosphorus, alkaline phosphatase, and vitamin D levels
The bone begins to mineralize about two weeks after the formation of the bone matrix in children [16]. Approximate- ly 50–70% of the bone is composed of minerals [17]; calcium and phosphorus are the chief minerals found in the bone.
Bone mineralization is the process of deposition of minerals
on the bone matrix. In the present study, the bone mineral
density was not evaluated; instead, the serum levels of calci-
um, phosphorus, alkaline phosphatase (ALP), and vitamin D, which serve as indicators of bone mineralization, were mea- sured to indirectly evaluate bone mineralization.
Serum calcium, phosphorus, and ALP levels were mea- sured using an automatic multi-purpose analyzer (TBA200 FR, Toshiba Medical Products, Tokyo, Japan). An enzyme- linked fluorescence assay was carried out to measure the vi- tamin D levels using a Vidas PC autoanalyzer (Biomerieux SA, Lyon France).
Measurement of hemoglobin, hematocrit, total protein, albumin, and total cholesterol levels
To identify anemia and the nutritional status, we measured the levels of Hb, total protein, albumin, total cholesterol, and Hct. Hb and Hct levels were measured using a hematology
analyzer (Sysmex XE-2100, TOA Medical Electronics, Kobe, Japan). The serum levels of total protein, albumin, and total cholesterol were measured using an automatic multi-purpose analyzer (TBA200 FR).
Statistical analysis
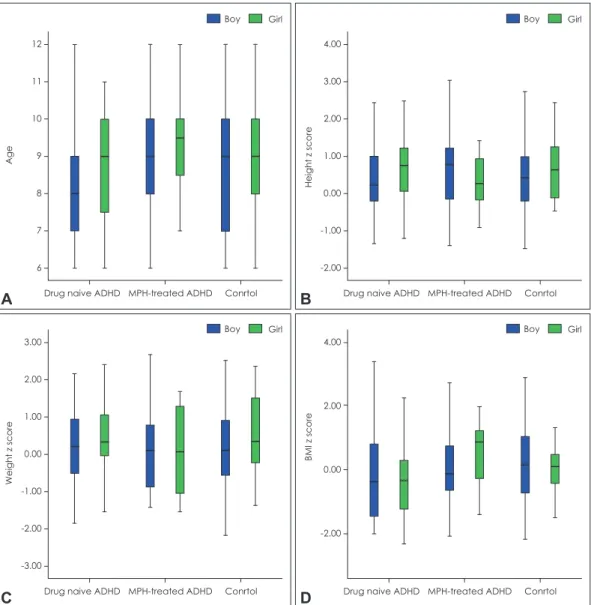
To account for sex-based differences in the normal growth curve and reference values of laboratory tests, we analyzed data from boys and girls separately. Because our data did not show a normal distribution, the data were analyzed using the Kruskal-Wallis test to compare the drug-naive ADHD, MPH- treated ADHD, and control groups. Post-hoc tests were used for comparison among the three groups. All the collected data were analyzed using the SPSS statistics software (ver- sion 22.0, for Windows; IBM Corp., Armonk, NY, USA). The
Fig. 1. Distribution (box plot) of (A) age, (B) height, (C) weight, and (D) BMI in study participants. Data expressed as minimum, 1st quar- tile, median, 3rd quartile, and maximum. Age was presented as years and height, weight, and BMI was presented as z-score. ADHD:
attention-deficit/hyperactivity disorder, BMI: body mass index, MPH: methylphenidate.
12 11 10 9 8 7 6
Age
MPH-treated ADHD Conrtol Drug naive ADHD
Boy Girl
A
3.00 2.00 1.00 0.00 -1.00 -2.00 -3.00
Weight z score
MPH-treated ADHD Conrtol Drug naive ADHD
Boy Girl
C
4.00 3.00 2.00 1.00 0.00 -1.00 -2.00
Height z score
MPH-treated ADHD Conrtol Drug naive ADHD
Boy Girl
B
4.00
2.00
0.00
-2.00
BMI z score
MPH-treated ADHD Conrtol Drug naive ADHD
Boy Girl