INTRODUCTION
The replacement of missing teeth by means of endosseous titanium implants has been proven to be a successful treatment modality for edentulous patients.
Furthermore achievement and maintenance of implant stability are prerequisites for long term positive outcomes for osseointegrated implants. Primary implant stability has long been identified as a prerequisite to achieve osseointegration and many authors also suggested that primary stability may be a useful predictor for osseointegration.1-4
So the application of a simple, clinically applicable noninvasive test to assess implant stability are considered highly desirable. Many tests have been suggested:
percussion, radiographic method, resonance frequency analysis, placement resistance, the Periotest, reverse torque and vibration methods in sonic and ultrasonic ragnes.5
Recently, a clinical instrument was developed to analyze resonance frequency which is calculated into implant stability quotient (ISQ), and it represents bone-implant contact.4,6-9ISQ replaces hertz, which is dependent on the transducer used, and is ranging from 1 to 100, 100 representing the highest degree of stability.9ISQ values for successfully integrated implants are reported from 57 to 82.
Friberg et al.4have reported that the highest correlation was found when comparing the mean torque values of the
upper/crestal portion with the resonance frequency values at implant placement. There was correlation between the cutting resistance and the ISQ values. O’sullivan et al.10 have also reported that there was correlation between the peak insertion torque and ISQ values. But Cunha et al.11 have reported that the correlation between the insertion torque and ISQ values only occurred in some implant designs. So far there is still a controversy about correlation of ISQ values and implant stability.
Therefore, in order to assess implant stability, the development of a new method is critical. It’s possible to assess implant stability by calculating energy and angular momentum during implant installation. Energy is absorbed by bone during implant installation.12,13Angular momentum means load developed to implant during implant insertion.
We developed new program which calculates the energy applied to bone during implant installation. And we measured the correlation between the energy index and maximum insertion torque, ISQ values, removal torques.12,13 The purpose of this study was to evaluate the correlation between energy values and the other parameters.
MATERIALS AND METHODS
1. Implants
Straight type implant: 4.1 × 8.5 mm (Oneplant,
DEVELOPMENT OF PREDICTABLE STABILITY TEST FOR ASSESSMENT OF OPTIMUM LOADING TIME IN DENTAL IMPLANT
Seong-Kyun Kim1, DDS, PhD, Seong-Joo Heo2, DDS, PhD, Jai-Young Koak1, DDS, PhD, Joo-Hee Lee3*, DDS, PhD, Ji-Yong Kwon4, MS
1Associate Professor, 2Professor, Department of Prosthodontics and Dental Research Institute, School of Dentistry, Seoul National University, Korea
3Assistant Professor, Department of Prosthodontics, Asan Medical Center, College of Medicine, University of Ulsan, Korea
4Graduate Student, School of Dentistry, Seoul National University, Korea
Corresponding Author: Joo-Hee Lee
Department of Prosthodontics, Asan Medical Center, College of Medicine, University of Ulsan 388-1 Pungnap-2dong, Songpa-gu, Seoul, 138-736, Korea + 82 2 3010 3831: e-mail, [email protected] Received November 10, 2008 Last Revison November 27, 2008 Accepted November 28, 2008.
*This study was supported by a Grant (2007-434) from the Asan Institute for Life Sciences, Seoul, Korea.
Warentec, Seoul, Korea) was used. Totally 23 implants were installed. Eleven implants were installed to type I bone and 12 were installed to type II bone.
2. Bone preparation
Two different types of pig bone were used (type I and type II bone). Type I bone was retrieved from the distal aspect of the rib, with more cortical bone. Type II bone came from a more proximal region with less cortical components and a higher content of bone marrow and spongeous trabeculae. The bones were firmly attached to a base device.
3. Surgical procedures
Site was prepared with conventional drills followed the protocols provided by company. The point drill was used to penetrate the bone and make the initial mark for the implant location. And also twist drills (2 mm wide and 8.5 mm long), pilot drills (2 to 3 mm wide), and twist drills (3 mm wide and 8.5 mm long) were used. After the installation, ELCOMED (W&H Dentalwork, Burmoos Gmbh, Austria) was inserted to fixture with a calibrated torque of 50 Ncm at determined 20 rpm.
4. Insertion torque measurement
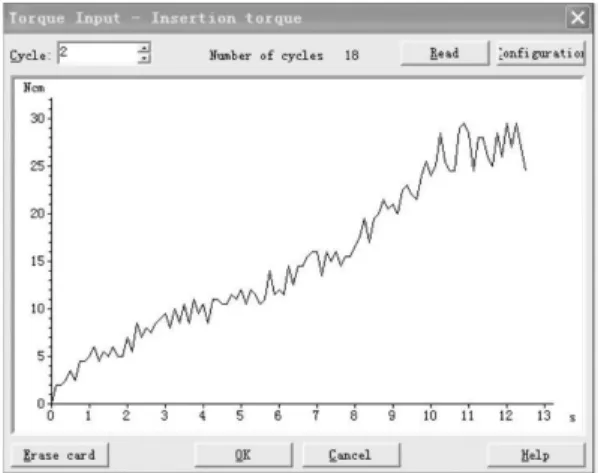
Maximum insertion torque was measured. Maximum insertion torque is the peak insertion torque which reached at the final stage of implant insertion (Table I, Fig .1).
5. Removal torque measurement
The removal torque was measured using a surgical engine (Table I).
6. ISQ value measurement
The stability of fixtures was measured with resonance frequency analyzer (Osstell mentor; Integration Diagnostics AB., Gotenborg, Sweden) at the time of fixture placement.
All measurements were made by the same practitioner. ISQ values were measured parallel and perpendicularly twice.
7. Angular momentum and energy measurement
A new technique was invented to calculate the energy and angular momentum with implant installation which were established in the JAVA program. The titles are ‘Software for measurement of load developed with implant installation’, and ‘Software for measurement of energy absorbed by bone’. Both of them got special permission from the Industrial Property Office of South Korea.12,13 The calculation methods are as follow: first we input the data of insertion torque taken from the smartcard of ELCOMED to the programs. Then the program will calculate angular momentum and energy automatically which were developed during the surgery.12,13 The definitions of measurements are described in Table I.
8. Statistical analysis
Statistical analyses were carried out using SAS statistical package version 9.1.3 (SAS Institute, Cary, NC, USA).
Pearson Correlation test was done to analyze the relation between RFA and maximum insertion torque, mean insertion torque, bone type, energy, removal torque. The correlation is significant at the 0.01 level (2-tailed). And t- test was used to compare the variables in type 1 and type 2 bone.
RESULTS
During the surgical procedure, no identifiable signs of side effects such as burning or carbonization were observed.
Table II shows comparison of t values for removal torque in Fig. 1. Insertion torque graph.
type I and type II bone. Type I bone showed higher removal torque than type II bone.
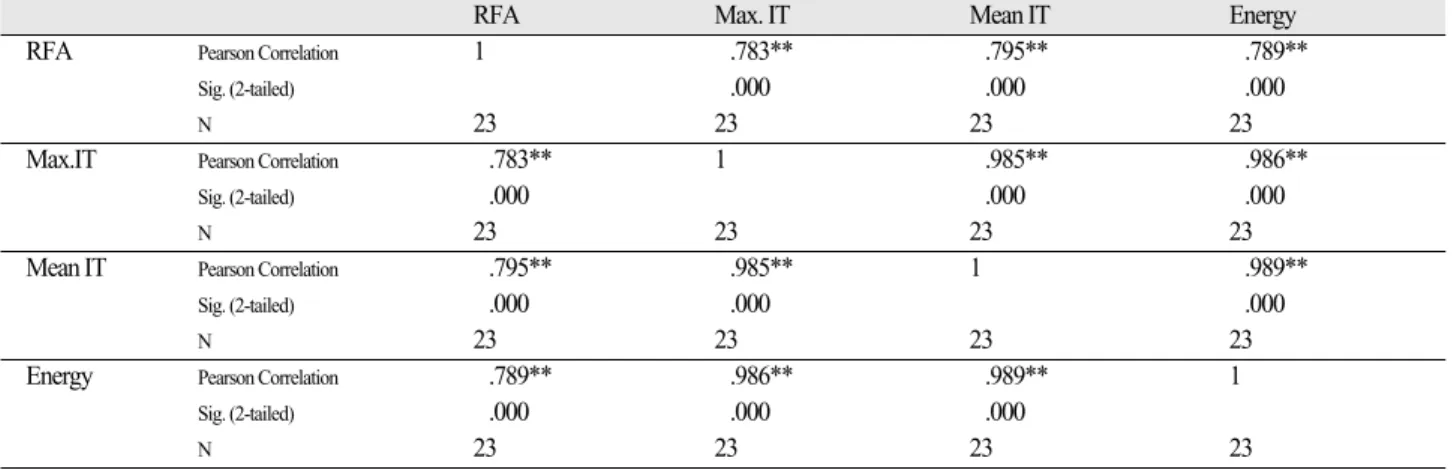
Energy values were significantly correlated with maximum insertion torque and mean insertion torque. RFA values were related with insertion torques but the significance was lower than Energy values (Table III).
DISCUSSION
Many authors agree that primary stability is important for the success and longevity of ossointegrated implants.3,8 Senner by et al. have shown the importance of engaging cortical bone, and they found that implants connected to the cortical bone by only a few threads still had a higher initial holding power than implants completely surrounded by
cancellous bone.14,15In this study, in order to standardize the bone, in type I bone, the upper region of the cortical surface was ground until the spongeous part was 3.5 mm in width, and the total width of the bone was more than 6 mm. By the same method, in type II bone, the upper cortical region was ground until the spongeous region was larger than 6 mm.
There are 3 determinant parameters for achieving primary stability: implant geometry, surgical procedure, and bone quality of the recipient site (in regard to density and stiffness).16In this study, The mean values for variables in type I and type II bone were different significantly (P <
.01). All the variables in type I bone were higher than type II bone.
Clinically maximum insertion torque could be increased when the cortical bone is thick or small area of highly dense bone exists. So the maximum insertion torque is not the critical value to measure the implant stability. And also high values of maximum insertion torque could increase the risk of fracture of the cortical bone or the incidence of bone necrosis.17
Table I. Measurement values and definition used in this study
Measurement Values Unit Definition
Maximum insertion torque N cm The maximum torque value during the beginning to the end of insertion of implants.
Angular momentum N cm sec Load developed to implant during the initial insertion to the maximum insertion torque value.25The angular momentum values are assessed by plotting insertion torque graph to the program.
Total insertion energy J Energy absorbed by bone during the beginning to the maximum torque value of implant insertion.
Maximum removal torque N cm The maximum torque value during the beginning to the end of removal of implants .
Table II. Relationship between the removal torque and types of bone
Type of N Mean removal Standard
bone torque deviation
I 11 8.5 2.7839
II 12 4.208 1.9824
Table III. Correlations between variables
RFA Max. IT Mean IT Energy
RFA Pearson Correlation 1 .783** .795** .789**
Sig. (2-tailed) .000 .000 .000
N 23 23 23 23
Max.IT Pearson Correlation .783** 1 .985** .986**
Sig. (2-tailed) .000 .000 .000
N 23 23 23 23
Mean IT Pearson Correlation .795** .985** 1 .989**
Sig. (2-tailed) .000 .000 .000
N 23 23 23 23
Energy Pearson Correlation .789** .986** .989** 1
Sig. (2-tailed) .000 .000 .000
N 23 23 23 23
** Correlation is significant at the 0.01 level (2-tailed).
And there is still a controversy about correlation of ISQ values and implant stability. So we need the new and reliable method to measure the implant stability.
Torque can informally be thought of as “rotational force”
or “angular force”which causes a change in rotational motion. This force is defined as linear force multiplied by a radius. The SI unit for torque is the newton meter (Nm).
Momentum (SI unit kg∙m/s, or, equivalently, N∙s) is the product of the mass and velocity of an object. In general, the momentum of an object can be conceptually thought of as how difficult it is to stop the object. Momentum is a conserved quantity, meaning that the total momentum of any closed system cannot be changed.
Angular momentum of a particle about some origin is defined as L = r × p (L: angular momentum of the particle, r: the position of the particle expressed as a displacement vector from the origin, p: linear momentum of the particle).
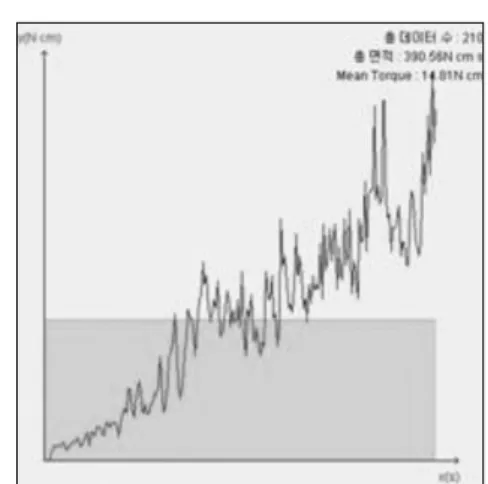
As seen from the definition, the derived SI units of angular momentum are newton∙meter∙seconds (N∙m∙s or kgm2s-1). If a system consists of several particles, the total angular momentum about an origin can be obtained by adding (or integrating) all the angular momentum of the constituent particles (Fig. 2).
Energy (J) is roughly force times distance. But more precisely, it is E=∫ F ds. This says that the energy (E) is equal to the integral (along a certain path) of the force.
Because energy is strictly conserved and is also locally conserved, it is important to remember that by definition of energy the transfer of energy between the “system”and adjacent regions is work.
ΔE = W+Q
(ΔE: the amount of energy transferred, W: the work done
on the system, Q: the heat flow into the system) The energy required to insert an implant was determined by plotting the insertion torque against the angular displacement of the implant in radians.18We assessed the energy values by plotting insertion torque graph to the second program. We got the total energy and each part’s energy.
In this study, energy values were significantly correlated with maximum insertion torque, mean insertion torque and removal torque. Energy values are easy to measure and less sensitive to local factors than maximum insertion torque. So energy values are considered more reliable than the other parameters.
In vivo studies we know that after the implant insertion, bone will undergo remodeling at the implant-bone interface.
So if a high trauma was delivered, stress to the bone would be increased. Then bone remodeling at interface between bone and implant would be delayed. So it is best to decrease the stress to the bone.
Stress can be thought of as the energy applied to the bone.
A technique was invented to calculate energy using insertion torque data.13This energy is related to the load in the bone. In general the energy can be divided into mechanical load and heat to the bone.
Since energy is also lost in the generation of heat within the hand piece, in the generation of noise, and the friction between the components of the hand piece and motor,19so the total energy calculated by insertion torque may be overestimate of the energy imparted to the bone.
Nonetheless if the energy is excessive, the bone will show slow healing or particular necrosis.
With this program, we could guess the stress on the bone, and the amount of bone remodeling. New methods might be a basis of new implant that shows higher implant stability, and lower damage to the bone at the surgery.
CONCLUSION
Within the limitation of this study energy values were significantly correlated with maximum insertion torque and mean insertion torque. So energy values were considered clinically predictable method to measure the implant stability.
Fig. 2. Angular momentum and mean torque.
REFERENCES
1. Adell R, Lekholm U, Rockler B, Bra°nemark PI. A 15-year study of osseointegtated implants in the treatment of the edentulous saw. Int J Oral Surg 1981;10:387-416.
2. Albrektsson T, Bra°nemark PI, Hansson HA, Lindstro¨m J.
Osseointegrated titanium implants: requirements for ensur- ing a long-lasting, direct bone to implant anchorage in man.
Acta Orthop Scand 1981;52:155-70.
3. Meredith N. Assessment of implant stability as a prognos- tic determinanat. Int J Prosthodont 1998;11:491-501.
4. Friberg B, Sennerby L, Linden B, Gro¨ndahl K, Lekholm U. Stability measurements of one-stage Bra°nemark im- plants during healing in mandibles. A clinical resonance frequency analysis study. Int J Oral Maxillofac Surg 1999;28:266-72.
5. Meredith N. A review of nondestructive test methods and their application to measure the stability and osseiontegra- tion of bone anchored endosseous implants. Crit Rev Biomed Eng 1998;26:275-91.
6. Friberg B. Sennerby L. Meredith N. Lekholm U. A com- parison between cutting torque and resonance frequency measurement of maxillary implants: A 20-month clinical study. Int J Oral Maxillofac Surg 1999;28:297-303.
7. Meredith N, Book K, Friberg B, Jemt T, Sennerby L.
Resonance frequency measurements of implant stability in vivo. A cross-sectional and longitudinal study of resonance frequency measurements on implants in the edentulous and partially dentate maxilla. Clin Oral Implants Res 1997;8:
226-33.
8. Meredith N, Alleyne D, Cawley P. Quantitative determina- tion of the stability of the implant-tissue interface using res- onance frequency analysis. Clin Oral Implants Res 1996;7:261-7.
9. Barewal RM, Oates TW, Meredith N, Cochran DL.
Resonance frequency analysis of implant stability in vivo on implants with a sandblasted and acid-etched surfaces.
Int J Oral Maxillofac Implants 2003;18:641-51.
10. O’Sullivan D, Sennerby L, Meredith N. Measurements comparing the initial stability of five designs of dental im- plant: a human cadaver study. Clin Implant Dent Relat Res 200;2:85-92.
11. da Cunha HA, Francischone CE, Filho HN, de Oliveira RC. A comparison between cutting torque and resonance frequency in the assessment of primary stability and final torque capacity of standard and tiunite single-tooth im- plants under immediate loading. Int Oral Maxillofac Implants 2004;19:578-85.
12. Kim SK, Kwon JY, Heo SJ, Koak JY, Lee JH. Software for measurement of load developed with implant installation.
Intellectual property rights 2007-01-199-004156, 2007.
13. Kim SK, Kwon JY, Heo SJ, Koak JY, Lee JH. Software for measurement of energy absorbed by bone. Intellectual property rights 2007-01-199-004155, 2007.
14. Sennerby L, Thomsen P, Ericson LE. A morphometric and biomechanic comparison of titanium implants inserted in rabbit cortical and cancellous bone. Int J Oral Maxillofac Implants 1992;7:62-71.
15. O’sullivan D, Sennerby L, Meredith N. Influence of im- plant taper on the primary and second stability of osseointe- grated titanium implants. Clin Oral Impl Res 2004;15:474- 80.
16. O¨stman PO, Hellman M, Wendelhag I, Sennerby L.
Resonance Frequency Analysis Measurements of Implants at Placement Surgery. Int J Prosthodont 2006;19:77-83.
17. Lim SA, Cha JY, Hwang CJ. Insertion torque of orthodon- tic miniscrews according to changes in shape, diameter, and length. Angle Orthod 2008;78:234-40.
18. Walker J. Applied mechanics London: Hodder and Stoughton; 1972.pp 41-2.
19. O’Sullivan D, Sennerby L, Jagger D, Meredith N. A com- parison of two methods of enhancing implant primary sta- bility. Clin Implant Dent Relat Res 2004;6:48-57.
DEVELOPMENT OF PREDICTABLE STABILITY TEST FOR ASSESSMENT OF OPTI- MUM LOADING TIME IN DENTAL IMPLANT
Seong-Kyun Kim1, DDS, PhD, Seong-Joo Heo2, DDS, PhD, Jai-Young Koak1, DDS, PhD, Joo-Hee Lee3*, DDS, PhD, Ji-Yong Kwon4, MS
1Associate Professor, 2Professor, Department of Prosthodontics and Dental Research Institute, School of Dentistry, Seoul National University, Korea
3Assistant Professor, Department of Prosthodontics, Asan Medical Center, College of Medicine, University of Ulsan, Korea
4Graduate Student, School of Dentistry, Seoul National University, Korea
STATEMENT OF PROBLEM: The application of a simple, clinically applicable noninvasive test to assess implant stability are consid- ered highly desirable. So far there is still a controversy about correlation of various tests and implant stability. PURPOSE: In order to as- sess implant stability, the development of a new method is critical. It’s possible to assess implant stability by calculating energy and angu- lar momentum during implant installation. The purpose of this study is to evaluate the correlation of energy and implant stability.
MATERIAL AND METHODS: Twenty three implants were installed in two different types of pig bone. Type I bone was retrieved from the distal aspect of the rib, with more cortical bone. Type II bone came from a more proximal region with less cortical components and a higher content of bone marrow and spongeous trabeculae. Insertion torque, removal torque, ISQ values and angular momentum and energy were measured. Pearson Correlation test was done to analyze the relation between RFA, maximum insertion torque, mean insertion torque, bone type, energy and removal torque. RESULTS: Type I bone showed higher removal torque than type II bone. Energy value was signifi- cantly correlated with maximum insertion torque and mean insertion torque. RFA values were related with insertion torques but the signifi- cance was lower than Energy value. CONCLUSION: Within the limitation of this study energy values were considered clinically pre- dictable method to measure the implant stability.
KEY WORDS: Stability, Implant, Insertion torque, Removal torque, Resonance frequency, Energy
Corresponding Author: Joo-Hee Lee
Department of Prosthodontics, Asan Medical Center, College of Medicine, University of Ulsan 388-1 Pungnap-2dong, Songpa-gu, Seoul, 138-736, Korea + 82 2 3010 3831: e-mail, [email protected] Article history
Received November 10, 2008 Last Revison November 27, 2008 Accepted November 28, 2008.