Prevalence and Clinical Characteristics of Metabolically Healthy Obesity in Korean Children and Adolescents: Data from the
Korea National Health and Nutrition Examination Survey
Metabolically healthy obesity (MHO) and metabolically unhealthy obesity (MUO) are differentiated by the presence of cardiometabolic risk factors (CMRFs) and insulin resistance (IR). This study aimed to evaluate the prevalence and clinical characteristics of MHO in Korean children and adolescents and to investigate the anthropometric, laboratory, and lifestyle predictors of MHO. This study included data from 530 obese subjects, aged 10–19 years, obtained from the Fourth Korea National Health and Nutrition Examination Survey.
Subjects were classified into MHO and MUO groups according to the presence of CMRF (MHOCMRF/MUOCMRF) and degree of IR (MHOIR/MUOIR). Demographic, anthropometric, cardiometabolic, and lifestyle factors were compared between the groups. Logistic regression analysis and receiver operating characteristic curve analysis were performed to identify factors that predicted MHO. The prevalence of MHOCMRF and MHOIR in obese Korean youth was 36.8% (n = 197) and 68.8% (n = 356), respectively. CMRF profiles were significantly less favorable in MUO children. Longer and more vigorous physical activity and less protein intake were associated with MHOCMRF phenotype. The best predictors of MHOCMRF and MHOIR were waist circumference (odds ratio [OR], 0.82; 95% confidence interval [CI], 0.77–0.88; P < 0.001) and body mass index (BMI) standard deviation score (OR, 0.24; 95% CI, 0.15–0.39; P < 0.001), respectively. The prevalence of MHO differed depending on how it was defined. To adequately manage obesity in youth, the approach to individuals with MHO and MUO should be personalized due to variation in clinical characteristics. Longitudinal studies are needed to evaluate long-term consequences of MHO.
Keywords: Metabolically Healthy Obesity; Prevalence; Children; Korea Da Young Yoon,1 Young Ah Lee,2
Jieun Lee,1 Jae Hyun Kim,3
Choong Ho Shin,2 and Sei Won Yang2
1Department of Pediatrics, Inje University Ilsan Paik Hospital, Goyang, Korea; 2Department of Pediatrics, Seoul National University College of Medicine, Seoul, Korea; 3Department of Pediatrics, Seoul National University Bundang Hospital, Seongnam, Korea
Received: 22 April 2017 Accepted: 29 July 2017 Address for Correspondence:
Jae Hyun Kim, MD
Department of Pediatrics, Seoul National University Bundang Hospital, 82 Gumi-ro 173-beon-gil, Bundang-gu, Seongnam 13620, Republic of Korea
E-mail: [email protected]
https://doi.org/10.3346/jkms.2017.32.11.1840 • J Korean Med Sci 2017; 32: 1840-1847
INTRODUCTION
The increasing prevalence of obesity in children and adolescents is becoming a global concern (1,2). Childhood obesity can lead to obesity in adulthood and increase the risk of hypertension, type 2 diabetes mellitus, hyperlipidemia, cardiovascular dis- ease, psychological morbidity, and premature mortality (3,4).
However, some obese subjects do not have obesity-related co- morbidities (5).
Metabolically healthy obesity (MHO) is described as an obe- sity phenotype without cardiometabolic risk factors (CMRFs) such as insulin resistance (IR), hypertension, and dyslipidemia.
By contrast, metabolically unhealthy obesity (MUO) refers to obesity with CMRFs. The definition of MHO in children and adolescents varies considerably, resulting in a broad range of MHO prevalence reported in obese subjects (between 22% and
68%) (6-9). In previous studies, the MHO phenotype has been associated with favorable metabolic, physical activity (PA), and dietary profiles compared with the MUO phenotype (6,7,10-16).
Despite these positive findings of the MHO phenotype, several studies have reported no differences in PA levels between indi- viduals with MHO and MUO (17-19).
To date, only a few studies have investigated the prevalence and clinical characteristics of MHO in children and adolescents.
Furthermore, previous studies were conducted in limited pop- ulations. Therefore, this study aimed to evaluate the prevalence and clinical characteristics of MHO in obese Korean children and adolescents, to compare the demographic, anthropomet- ric, laboratory, and lifestyle factors of the MHO and MUO phe- notypes, and to investigate the predictors of MHO by using data obtained from the Fourth Korea National Health and Nutrition Examination Survey (KNHANES IV).
Pediatrics
2017-03-16 https://crossmark-cdn.crossref.org/widget/v2.0/logos/CROSSMARK_Color_square.svg
MATERIALS AND METHODS Study population
This study was conducted using data obtained from the KNH- ANES IV (2007–2009). The KNHANES is a cross-sectional survey of the non-institutionalized Korean population. It is a nationally representative survey that has been performed periodically since 1998 by the Division of Chronic Disease Surveillance, Korea Cen- ters for Disease Control and Prevention. A multi-stage clustered probability design was applied to this survey (20).
A total of 24,871 individuals are included in the KNHANES IV.
Among them, 3,364 children and adolescents aged 10–19 years were identified as potential candidates for the present study.
Among the 3,364 subjects, a total of 530 obese youths (321 boys [60.6%] and 209 girls [39.4%]) were included in the present study after excluding non-obese subjects (n = 2,010), subjects who had fasted for less than 8 hours (n = 321) prior to the blood test, and subjects missing test results for any of the components used to evaluate cardiometabolic risk (n = 530).
Anthropometric measurements were obtained for all partici- pants by trained personnel. Height was determined to the near- est 0.1 cm with a portable stadiometer (Seca 225; Seca, Ham- burg, Germany). Weight was measured to the nearest 0.1 kg on a medical balance scale (GL-6000-20; CAS, Seoul, Korea). Body mass index (BMI) was calculated as weight (kg) divided by height squared (m2). Height, weight, and BMI standard deviation score (SDS) was calculated using the 2007 Korean Growth Chart (21).
Waist circumference (WC) was measured at the midpoint be- tween the lowest margin of the rib and the uppermost lateral border of the iliac crest during expiration using a flexible tape (Seca 220; Seca). Waist-height ratio (WHR) was calculated as WC divided by height (%). Blood pressure (BP) was measured on the right arm after the subject had rested for 5 minutes in a seated position using a mercury sphygmomanometer (Bauma- nometer® Desk model 0320; W.A. Baum, Copiague, NY, USA).
Systolic and diastolic BP were measured in triplicate, and the second and third measurements were averaged and used in the analyses.
Blood was taken from each participant by trained medical personnel after overnight fasting. The samples were transport- ed to a central laboratory after preparation and analyzed within 24 hours. Plasma glucose, total cholesterol, high density lipo- protein (HDL) cholesterol, triglyceride (TG), and alanine trans- aminase (ALT) were measured using an ADIVIA 1650 analyzer (Siemens, Washington, D.C., USA) in 2007 and a Hitachi Auto- matic Analyzer 7600 (Hitachi, Tokyo, Japan) in 2008 and 2009.
Insulin was measured by an immunoradiometric assay (INS- IRMA; Biosource, Nivelles, Belgium) using a 1470 WIZARD gam- ma-counter (PerkinElmer, Turku, Finland). IR was evaluated by the homeostatic model assessment of insulin resistance (HOMA- IR), which was calculated as (22):
HOMA-IR = fasting insulin (mIU/mL) × fasting glucose (mmol/L)/22.5
All subjects and their parents or legal guardians were inter- viewed for surveys of PA and nutrition. For the PA survey, data on the duration and frequency of moderate PA, vigorous PA, and walking were collected. Structured questionnaires on PA were self-administered in a mobile examination center. Parents or legal guardians of children aged 10–11 years completed the questionnaires for their children. Questionnaires included ques- tions about participation in vigorous and moderate PA, as well as how often the subject had walked for at least 10 minutes in the past 7 days. The total PA was calculated as the sum of vigor- ous PA, moderate PA, and walking expressed as minutes per day. Vigorous PA was defined as PA that caused large increases in breathing or heart rate. Moderate PA was defined as PA that caused a slight to moderate increase in breathing or heart rate.
For the nutritional survey, the 24-hour dietary recall method was used to collect data on daily food intake. Average daily nu- trient intake including carbohydrates, protein, and lipids was recorded by trained personnel.
Definition of CMRFs and IR
Obesity was defined by BMI ≥ 95th percentile for sex and age, or ≥ 25 kg/m2 (21). CMRFs were defined using the components of metabolic syndrome defined by the International Diabetes Federation (23): systolic or diastolic BP ≥ 130/85 mmHg; fasting plasma glucose ≥ 100 mg/dL; TG ≥ 150 mg/dL; HDL choles- terol < 40 mg/dL in boys aged 10–19 years and girls aged 10–15 years and < 50 mg/dL in girls aged between 16–19 years. IR was defined as HOMA-IR ≥ 95th percentile for age and sex using Korean reference data (24).
MHO and MUO phenotypes were classified according to two different criteria, which were the presence/absence of CMRF(s) and the degree of IR. Obese subjects without any CMRF was defined as having MHO by risk factors (MHOCMRF), and those with one or more CMRF was defined as having MUO by risk factors (MUOCMRF) (7,13,25). Obese subjects without IR was de- fined as having MHO by IR (MHOIR), and those with IR as hav- ing MUO by IR (MUOIR).
Statistical analysis
Statistical analyses were performed with Stata 14.2 software (StataCorp LP, College Station, TX, USA). Data were analyzed using Stata survey tools appropriate for the KNHANES sampling design. Results are expressed as the weighted mean ± standard error (SE) or number of cases (weighted percent). We compared the average values of demographic, anthropometric, cardiomet- abolic, and lifestyle factors between MHO and MUO subjects.
Multiple logistic regression analysis was performed to determine the odds ratio (OR) with 95% confidence interval (CI) for asso- ciation between MHO phenotype and anthropometry-, diet-,
and PA -related variables with adjustment for age and sex. Back- ward stepwise elimination with a significance level for removal from the model of 0.1 was applied for selection of the best sub- set of variables. Receiver operating characteristic (ROC) curve analysis was performed to identify the area under the curve (AUC) and its 95% CI for predicting MUO using anthropometric vari- ables. P values of < 0.05 were considered statistically significant.
Ethics statement
All participants in the KNHANES IV provided informed con- sent. The protocol of the KNHANES IV was approved by the In- stitutional Review Board of the Korea Centers for Disease Con- trol and Prevention (2007-02CON-04-P, 2008-04EXP-01-C, and 2009-01-CON-03-2C). Our study was approved by the Institu- tional Review Board of Inje University Ilsan Paik Hospital (2015-
08-004). All procedures were performed in accordance with the Declaration of Helsinki.
RESULTS
Clinical characteristics of study participants
Among 530 obese subjects, 193 (36.8%) were classified as hav- ing MHOCMRF and 356 (68.8%) as having MHOIR (Table 1). Sub- jects were older in the MHOIR group than in the MUOIR group (15.2 ± 0.2 vs. 14.5 ± 0.3, P = 0.019). No differences in age or sex were observed between the MHOCMRF and MUOCMRF groups. Val- ues of all anthropometric parameters were significantly higher in the MUO group (all P < 0.001). The levels of CMRFs (BP, total cholesterol, TG, fasting glucose, ALT, insulin, and HOMA-IR) were significantly lower in the MHOCMRF group. HDL cholester- Table 1. Demographic, anthropometric, CMRF, PA, and dietary characteristics of children and adolescents with MHO and MUO defined according to different definitions of MHO
Variables
CMRFs HOMA-IR
MHOCMRF
(n = 197, 36.8%)
MUOCMRF
(n = 333, 63.2%) P value MHOIR
(n = 356, 68.8%)
MUOIR
(n = 174, 31.2%) P value Demography and anthropometry
Age, yr 14.8 ± 0.2 15.1 ± 0.2 0.160 15.2 ± 0.2 14.5 ± 0.3 0.019
Sex, boys (%) 112 (60.0) 209 (66.1) 0.225 216 (64.9) 105 (61.6) 0.523
Height SDS 0.35 ± 0.08 0.68 ± 0.06 0.002 0.44 ± 0.06 0.80 ± 0.07 < 0.001
Weight SDS 1.11 ± 0.04 1.59 ± 0.04 < 0.001 1.27 ± 0.04 1.73 ± 0.05 < 0.001
BMI SDS 1.14 ± 0.03 1.51 ± 0.03 < 0.001 1.26 ± 0.03 1.62 ± 0.05 < 0.001
WC, cm 77.3 ± 0.5 84.7 ± 0.6 < 0.001 80.8 ± 0.5 84.5 ± 0.9 < 0.001
WHR, % 47.3 ± 0.2 51.0 ± 0.3 < 0.001 48.9 ± 0.2 51.3 ± 0.5 < 0.001
CMRFs
Systolic BP, mmHg 105.9 ± 0.8 111.1 ± 0.8 < 0.001 108.5 ± 0.7 110.8 ± 0.8 0.025
Diastolic BP, mmHg 66.2 ± 0.6 69.0 ± 0.7 0.002 67.5 ± 0.6 69.0 ± 0.8 0.110
Total cholesterol, mg/dL 159.7 ± 2.3 166.5 ± 2.0 0.013 163.0 ± 2.0 166.3 ± 2.5 0.293
HDL cholesterol, mg/dL 50.2 ± 0.7 43.4 ± 0.5 < 0.001 46.6 ± 0.5 44.5 ± 0.9 0.030
TG, mg/dL 78.5 ± 2.4 129.5 ± 6.7 < 0.001 95.9 ± 3.6 143.4 ± 11.8 < 0.001
Insulin, mIU/L 14.5 ± 0.4 18.9 ± 0.7 < 0.001 12.8 ± 0.2 26.9 ± 0.9 < 0.001
Glucose, mg/dL 88.6 ± 0.4 91.0 ± 0.5 < 0.001 88.5 ± 0.3 93.6 ± 0.8 < 0.001
HOMA-IR 3.2 ± 0.1 4.3 ± 0.2 < 0.001 2.8 ± 0.0 6.3 ± 0.2 < 0.001
ALT, IU/L 18.1 ± 1.1 24.9 ± 1.2 < 0.001 19.6 ± 0.9 28.5 ± 2.1 < 0.001
PA
Moderate PA, min/day 14.8 ± 2.5 13.2 ± 1.7 0.620 15.2 ± 1.9 10.7 ± 1.6 0.078
Vigorous PA, min/day 26.5 ± 4.3 18.5 ± 2.2 0.077 22.0 ± 2.4 20.2 ± 4.3 0.687
Walk, min/day 46.2 ± 5.1 47.5 ± 5.1 0.858 51.5 ± 4.9 36.7 ± 3.9 0.015
Total PA, min/day 87.5 ± 8.2 79.3 ± 6.0 0.390 88.7 ± 6.6 67.6 ± 6.8 0.025
Diet
Energy intake, kcal/day 1,945.9 ± 66.4 2,023.8 ± 66.0 0.413 2,031.0 ± 62.3 1,918.6 ± 68.2 0.225
Carbohydrate intake, g/day 308.2 ± 9.5 314.5 ± 10.0 0.644 316.0 ± 9.2 304.0 ± 11.1 0.404
Carbohydrate intake, % 64.2 ± 0.7 63.5 ± 0.7 0.441 63.7 ± 0.7 63.8 ± 0.9 0.917
Protein intake, g/day 66.1 ± 2.3 73.8 ± 2.5 0.029 72.1 ± 2.3 68.6 ± 2.9 0.351
Protein intake, % 13.8 ± 0.3 14.6 ± 0.2 0.054 14.3 ± 0.2 14.2 ± 0.4 0.833
Fat intake, g/day 48.9 ± 2.7 51.9 ± 2.5 0.431 52.2 ± 2.5 47.7 ± 2.3 0.176
Fat intake, % 22.0 ± 0.6 21.9 ± 0.5 0.868 21.9 ± 0.5 22.0 ± 0.7 0.936
Water intake, g/day 768.1 ± 41.8 852.0 ± 39.4 0.142 847.4 ± 39.8 765.3 ± 34.0 0.113
Fiber intake, g/day 5.6 ± 0.3 5.9 ± 0.3 0.430 5.7 ± 0.3 6.0 ± 0.5 0.572
Data are expressed as weighted mean ± standard error or number of cases (weighted percent).
PA = physical activity, MHO = metabolically healthy obesity, MUO = metabolically unhealthy obesity, CMRF = cardiometabolic risk factor, IR = insulin resistance, SDS = standard deviation score, BMI = body mass index, WC = waist circumference, WHR = waist-height ratio, BP = blood pressure, HDL = high-density lipoprotein, TG = triglyceride, HOMA- IR = homeostatic model assessment of insulin resistance, ALT = alanine transaminase.
ol was significantly higher in the MHOCMRF group (P < 0.001).
Diastolic BP and total cholesterol did not significantly differ be- tween the MHOIR and MUOIR groups. In the MUOIR group, 37.8%, 19.6%, 4.4%, and 1.4% of subjects had one, two, three, and four CMRFs, respectively (Fig. 1). The proportion of subjects with two or more CMRFs was lower in the MHOIR group than in the
MUOIR group (Fig. 1). In subjects with the MUOCMRF phenotype, 45.2% had low HDL cholesterol, 28.0% had high TG, 16.5% had high BP, and 13.6% had elevated fasting glucose (Fig. 2). In the MUOIR group, the proportion of subjects with high TG and high fasting glucose was higher than that in the MHOIR group (Fig. 2).
No factors associated with PA significantly differed between
Fig. 1. Distribution of the number of CMRFs by MHO and MUO phenotype defined according to different criteria.
MHO = metabolically healthy obesity, MUO = metabolically unhealthy obesity, CMRF
= cardiometabolic risk factor, IR = insulin resistance.
Weighted percent (%)
Number of cardiometabolic risk factors 0 1 2 3 4 50
40 30 20 10 0
36.8 42.6
23.9 37.8 38.7
35.8
19.6 16.1
27.4
4.4 2.0
9.7
1.4 0.6 3.2 MHO/MUOCMRF
MHOIR
MUOIR
Fig. 2. Proportion of CMRFs in children and adolescents with MUO.
MHO = metabolically healthy obesity, MUO = metabolically unhealthy obesity, CMRF
= cardiometabolic risk factor, IR = insulin resistance, HDL = high density lipoprotein.
Weighted percent (%)
High blood pressure
High fasting glucose
High triglyceride
Low HDL cholesterol 50
40 30 20 10 0
16.5
11.8 7.4
13.6
3.0 20.9
28.0
10.8 32.9
45.2
28.9 27.7 MUOCMRF
MHOIR
MUOIR
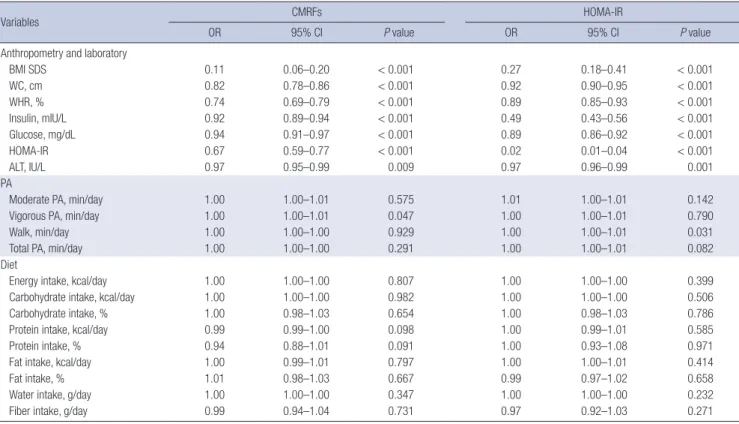
Table 2. Associations between individual anthropometry-, diet-, and PA-related variables and MHO phenotype* according to different definitions of MHO
Variables CMRFs HOMA-IR
OR 95% CI P value OR 95% CI P value
Anthropometry and laboratory
BMI SDS 0.11 0.06–0.20 < 0.001 0.27 0.18–0.41 < 0.001
WC, cm 0.82 0.78–0.86 < 0.001 0.92 0.90–0.95 < 0.001
WHR, % 0.74 0.69–0.79 < 0.001 0.89 0.85–0.93 < 0.001
Insulin, mIU/L 0.92 0.89–0.94 < 0.001 0.49 0.43–0.56 < 0.001
Glucose, mg/dL 0.94 0.91–0.97 < 0.001 0.89 0.86–0.92 < 0.001
HOMA-IR 0.67 0.59–0.77 < 0.001 0.02 0.01–0.04 < 0.001
ALT, IU/L 0.97 0.95–0.99 0.009 0.97 0.96–0.99 0.001
PA
Moderate PA, min/day 1.00 1.00–1.01 0.575 1.01 1.00–1.01 0.142
Vigorous PA, min/day 1.00 1.00–1.01 0.047 1.00 1.00–1.01 0.790
Walk, min/day 1.00 1.00–1.00 0.929 1.00 1.00–1.01 0.031
Total PA, min/day 1.00 1.00–1.00 0.291 1.00 1.00–1.01 0.082
Diet
Energy intake, kcal/day 1.00 1.00–1.00 0.807 1.00 1.00–1.00 0.399
Carbohydrate intake, kcal/day 1.00 1.00–1.00 0.982 1.00 1.00–1.00 0.506
Carbohydrate intake, % 1.00 0.98–1.03 0.654 1.00 0.98–1.03 0.786
Protein intake, kcal/day 0.99 0.99–1.00 0.098 1.00 0.99–1.01 0.585
Protein intake, % 0.94 0.88–1.01 0.091 1.00 0.93–1.08 0.971
Fat intake, kcal/day 1.00 0.99–1.01 0.797 1.00 1.00–1.01 0.414
Fat intake, % 1.01 0.98–1.03 0.667 0.99 0.97–1.02 0.658
Water intake, g/day 1.00 1.00–1.00 0.347 1.00 1.00–1.00 0.232
Fiber intake, g/day 0.99 0.94–1.04 0.731 0.97 0.92–1.03 0.271
All ORs were adjusted for sex and age.
CMRF = cardiometabolic risk factor, PA = physical activity, MHO = metabolically healthy obesity, HOMA-IR = homeostatic model assessment of insulin resistance, OR = odds ratio, CI = confidence interval, BMI = body mass index, SDS = standard deviation score, WC = waist circumference, WHR = waist-height ratio, ALT = alanine transaminase.
*Reference variable: MUO, outcome variable: MHO.
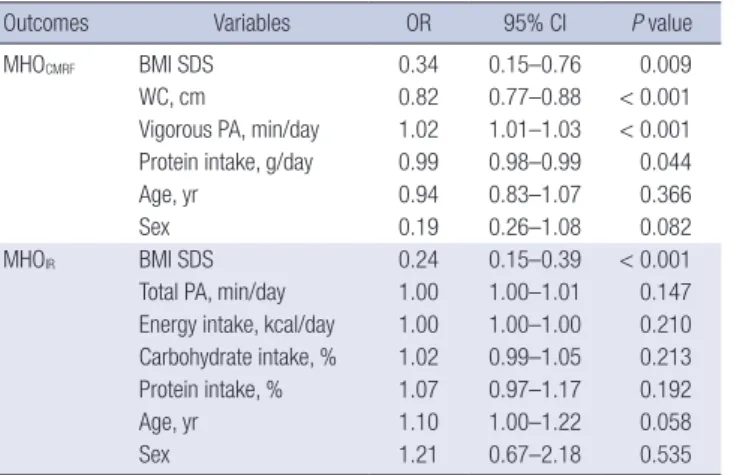
Table 3. Multiple logistic regression analysis for the association of anthropometric and lifestyle-related variables with MHO phenotype defined by either set of criteria
Outcomes Variables OR 95% CI P value
MHOCMRF BMI SDS 0.34 0.15–0.76 0.009
WC, cm 0.82 0.77–0.88 < 0.001
Vigorous PA, min/day 1.02 1.01–1.03 < 0.001 Protein intake, g/day 0.99 0.98–0.99 0.044
Age, yr 0.94 0.83–1.07 0.366
Sex 0.19 0.26–1.08 0.082
MHOIR BMI SDS 0.24 0.15–0.39 < 0.001
Total PA, min/day 1.00 1.00–1.01 0.147 Energy intake, kcal/day 1.00 1.00–1.00 0.210 Carbohydrate intake, % 1.02 0.99–1.05 0.213 Protein intake, % 1.07 0.97–1.17 0.192
Age, yr 1.10 1.00–1.22 0.058
Sex 1.21 0.67–2.18 0.535
MHO = metabolically healthy obesity, OR = odds ratio, CI = confidence interval, BMI = body mass index, SDS = standard deviation score, WC = waist circumference, PA = physical activity, CMRF = cardiometabolic risk factor, IR = insulin resistance.
Table 4. Associations of MHO phenotype with various factors using multiple logistic regression analysis
Variables MHOCMRF MUOIR
P value
AUC 95% CI AUC 95% CI
BMI SDS 0.699 0.698–0.700 0.676 0.675–0.677 < 0.001 WHR, % 0.744 0.743–0.745 0.635 0.634–0.636 < 0.001 WC, cm 0.761 0.760–0.761 0.593 0.592–0.594 < 0.001 MHO = metabolically healthy obesity, CMRF = cardiometabolic risk factor, MUO = meta- bolically unhealthy obesity, IR = insulin resistance, AUC = area under the curve, CI = confidence interval, BMI = body mass index, SDS = standard deviation score, WHR = waist-height ratio, WC = waist circumference.
Fig. 3. ROC curve for BMI SDS, WHR, and WC to detect MUO by definition. (A) MUOC- MRF with an AUC (95% CI) of 0.699 (0.698–0.700) for BMI SDS, 0.744 (0.743–0.745) for WHR, and 0.761 (0.760–0.761) for WC (P < 0.001), (B) MUOIR with an AUC (95%
CI) of 0.676 (0.675–0.677) for BMI SDS, 0.635 (0.634–0.636) for WHR, and 0.593 (0.592–0.594) for WC (P < 0.001).
ROC = receiver operating characteristic, BMI = body mass index, SDS = standard deviation score, WHR = waist-height ratio, WC = waist circumference, MUO = meta- bolically unhealthy obesity, CMRF = cardiometabolic risk factor, AUC = area under the curve, CI = confidence interval, IR = insulin resistance.
(A)
Sensitivity
1-Specificity
0 0.25 0.50 0.75 1.00
1.00
0.75
0.50
0.25
0
Body mass index SDS Waist-height ratio Waist circumference
Fig. 3. A
(B)
Sensitivity
1-Specificity
0 0.25 0.50 0.75 1.00
1.00
0.75
0.50
0.25
0
Body mass index SDS Waist-height ratio Waist circumference
B
the MHOCMRF and MUOCMRF groups (Table 1). However, total PA and walking time were significantly greater in the MHOIR group.
Among dietary factors including food intake habits (protein, car- bohydrate, fat, fiber, and calorie intake), only daily protein in- take (g/day) was significantly lower in the MHOCMRF group (P = 0.029). No variables significantly differed between the MHOIR
and MUOIR groups.
Logistic regression analysis of clinical variables for the prediction of MHO
In the age and sex-adjusted logistic regression analysis, WC, WHR, glucose, insulin level, HOMA-IR, and ALT were signifi- cantly associated with the MHOCMRF and MHOIR phenotypes (Table 2). Among the factors related to PA, vigorous PA was as- sociated with MHOCMRF (OR, 1.00; 95% CI, 1.00–1.01; P = 0.047) and walking with MHOIR (OR, 1.00; 95% CI, 1.00–1.01; P = 0.031).
No dietary factors, including food intake habits (protein, carbo- hydrate, fat, fiber, and calorie intake), demonstrated a significant association with MHOCMRF or MHOIR.
In the multiple logistic regression analysis, MHOCMRF was in- dependently associated with BMI SDS, WC, vigorous PA, pro- tein intake, and sex, whereas MHOIR was associated with BMI SDS (OR, 0.24; 95% CI, 0.15–0.39; P < 0.001) (Table 3).
ROC curve analysis for the detection of MUO
In the ROC curve analysis of the anthropometric factors associ- ated with MHO (BMI SDS, WC, and WHR), the factor with the largest AUC was WC for MUOCMRF (AUC, 0.761; 95% CI, 0.760–
0.761) and BMI SDS for MUOIR (AUC, 0.676; 95% CI, 0.675–0.677) (Table 4, Fig. 3).
DISCUSSION
The objective of the present study was to investigate the preva- lence of MHO in obese Korean children and adolescents and to compare the anthropometric, laboratory, and lifestyle factors between MHO and MUO. In this study, the prevalence of MHO in obese Korean children and adolescents was 36.8% (n = 197) for CMRF criteria and 68.8% (n = 356) for IR criteria. Longer time spent in vigorous PA and less protein intake was associated
with the MHOCMRF phenotype. The best predictors of MUOCMRF
and MUOIR were WC and BMI SDS, respectively.
Previous studies that defined MHO as obesity with no CMRFs reported a prevalence of MHO between 21.5% and 49.0% in pe- diatric populations (7,8,25,26). A study involving a Canadian pediatric population aged 8–17 years reported a different prev- alence of MHO based on two different definitions of the phe- notype (i.e., obesity with no CMRFs and obesity with a HOMA- IR of ≥ 3.16). The prevalence of MHO according to these two definitions was 31.5% and 21.5%, respectively (7). The preva- lence of MHO among obese adolescents in the United States was 68%, based on nationally representative data, which de- fined MHO as obesity with 0 or 1 abnormal CMRF (9). Because there is currently no established definition of MHO for adults and children, MHO prevalence differs widely between studies and populations (12). In the present study, the prevalence of MHO among obese youth differed depending on how it was defined. Moreover, the present results differ from the study car- ried out Prince and colleagues (7), although the same defini- tions of MHO were applied, in that the difference of MHO prev- alence defined by HOMA-IR was higher in our study. One pos- sible reason for this discrepancy may be the different cutoff lev- els of HOMA-IR for IR used by the studies. In the present study, the cutoff was the 95th percentile of HOMA-IR for age and sex (3.52–5.01 for boys and 3.80–5.65 for girls). However, a HOMA- IR of 3.16 was applied in the previous study, which corresponds to approximately the 75–90th percentile of the Korean reference data (24). When applying the cutoff value of 3.16 for MHO to the subjects in the present study, the prevalence of MHO among obese Korean youth was 46.3%, which is closer to that reported by Prince and colleagues (data not shown) (7).
In the current study, CMRFs including systolic BP, TG, glu- cose, ALT, insulin, HOMA-IR, and HDL cholesterol were signifi- cantly more favorable in MHO subjects, which is consistent with previous studies. The most common laboratory abnormalities were low HDL cholesterol (45.2%) in the MUOCMRF group and high TG (32.9%) in the MUOIR group. In particular, significantly lower HOMA-IR levels were observed in the MHOCMRF group than in the MUOCMRF group, indicating higher rates of IR in the MUO group. Previous studies also reported IR in pediatric MUO populations. Vukovic et al. (27) reported that obese children in a lower quartile of HOMA-IR demonstrated a more favorable metabolic profile than those in a higher quartile of HOMA-IR.
Preserved insulin sensitivity was observed in the MHO group.
Moreover, the same research group suggested a HOMA-IR cut- off value of ≥ 2.85 for diagnosing MUO, with 82% sensitivity and 60% specificity (6).
PA was not significantly different in the MHO and MUO groups (Table 1). However, after multiple logistic regression analysis (Table 3), vigorous PA was associated with MHOCMRF (OR, 1.02;
P < 0.001). Total PA was not associated with MHOIR (OR, 1.00;
P = 0.147). Consistent with the present study, Prince and col- leagues (7) reported a difference in lifestyle factors (PA and screen time) in children and adolescents aged 8–17 years. They revealed that vigorous PA was an independent predictor for MHO defined by CMRFs and moderate-to-vigorous PA was an independent predictor for MHO defined by HOMA-IR. By contrast, another study found that PA was not associated with MHO and MUO phenotype in the pediatric population in the United States (9).
In adult populations, there have been conflicting results regard- ing the association between MHO/MUO phenotype and level of PA (9,14,17-19).
The discordance between result regarding PA might be the results of different methods employed across studies. Adult stu- dies used various self-reporting questionnaires, the validity of which may not have been confirmed. Pediatric studies used self-reported questionnaires or parental responses (17). In one prospective study, PA was actually observed and recorded by a trained researcher over several days, as opposed to relying on self-reporting questionnaires (7), which may infer a higher level of validity for the results of that study.
In the present study, lower protein intake (g/day) was associ- ated with the MHOCMRF phenotype, while dietary factors were not related to the MHOIR phenotype. Interestingly, dietary fat intake was not a predictor of MHO status in the present study population. Dietary fat consumption was previously reported to be a predictor of MHO defined using HOMA-IR, indicating that dietary fat might cause IR (7). A high-fat diet was also asso- ciated with IR in African Americans (28).
The difference in associations between MHO phenotype and dietary factors might be caused by the methods used to collect daily food consumption. For the nutritional survey in the pres- ent study, the 24-hour dietary recall method was used, which might lead to recall bias. Prince et al. (7) used prospective col- lection of food records for the evaluation of nutritional intake.
Moreover, daily macronutrient intake differs between Korea and western countries. According to dietary reference intakes for Korean children, daily energy intake was 55%–65% carbohy- drate, 15%–30% fat, and 7%–20% protein (29). However, in the United States, the proportion of carbohydrate, fat, and protein consumption per day was 45%–60%, 25%–35%, and 10%–35%, respectively (30). Further studies on the association between dietary factors and MHO phenotype are needed.
A previous study reported that WC can explain obesity-asso- ciated risks better than BMI (31). However, another study found that the BMI SDS was superior to WC for predicting cardiovas- cular risk factors (26). In the present study, the best anthropo- metric predictor for MUOCMRF was WC, and that for MUOIR was BMI SDS. However, in the present study, body composition could not be considered due to a lack of data. Applying these results to clinical settings, measurement of BMI SDS and WC could con- tribute to the detection of MUO.
There have been only a few longitudinal studies of the MHO/
MUO phenotype in children and adolescents. A 1-year follow- up study of obese children revealed that pubertal stage is relat- ed to MHO and MUO status, and classification as MHO or MUO is unclear at least during the pubertal stage (26). A pilot study among obese adolescents showed that an earlier onset and a longer duration of obesity was associated with unhealthy meta- bolic characteristics in boys and not in girls (32).
There has been much skepticism around the existence of MHO. Based on an adult population study, MHO individuals showed increased mortality rates and cardiovascular risks com- pared to normal-weight individuals with normal metabolic pro- files (33). However, it is well known that obesity during child- hood and adolescence is linked to obesity in adulthood, and metabolically unhealthy adults clearly demonstrate higher mor- bidity and mortality rates. Therefore, children and adolescents with the MUO phenotype may have higher risk of cardiovascu- lar problems and mortality compared to those with the MHO phenotype when they reach adulthood. Further longitudinal studies comparing morbidity and mortality rates between MUO and MHO groups are needed.
There were several limitations in the present study. First, due to the cross-sectional design of this study, it is difficult to identi- fy causal relationships. Second, birth weight, puberty, family history, and body composition were not considered in the anal- ysis due to a lack of data. However, to the best of our knowledge, this study is the first to investigate the prevalence and clinical features of MHO phenotype using different definitions in Kore- an children and adolescents with nationally representative data.
In conclusion, the prevalence of MHO in obese Korean chil- dren and adolescents was 36.8% as defined by CMRFs and 68.8%
as defined by HOMA-IR. There were no differences between the MHO and MUO groups according to sex. The cardiometabolic profile was significantly less favorable in MUO children. The best anthropometric predictor of MUO was WC for MUOCMRF
and BMI SDS for MUOIR. To adequately manage obesity in chil- dren and adolescents, the approach to individuals with MHO and MUO subjects should be personalized due to their differ- ent clinical characteristics. Longitudinal studies of Korean MHO/
MUO youth are needed to evaluate long-term consequences of MHO.
DISCLOSURE
The authors have no potential conflicts of interest to disclose.
AUTHOR CONTRIBUTION
Conceptualization: Kim JH. Data curation: Kim JH. Formal anal- ysis: Lee J, Kim JH. Investigation: Yoon DY, Lee YA, Kim JH. Writ- ing - original draft: Yoon DY, Kim JH. Writing - review & editing:
Lee YA, Lee J, Shin CH, Yang SW.
ORCID
Da Young Yoon https://orcid.org/0000-0002-9604-554X Young Ah Lee https://orcid.org/0000-0001-9179-1247 Jieun Lee https://orcid.org/0000-0002-9776-4204 Jae Hyun Kim https://orcid.org/0000-0002-0203-7443 Choong Ho Shin https://orcid.org/0000-0002-9813-1134 Sei Won Yang https://orcid.org/0000-0002-5304-5750 REFERENCES
1. Ng M, Fleming T, Robinson M, Thomson B, Graetz N, Margono C, Mulla- ny EC, Biryukov S, Abbafati C, Abera SF, et al. Global, regional, and na- tional prevalence of overweight and obesity in children and adults dur- ing 1980–2013: a systematic analysis for the Global Burden of Disease Study 2013. Lancet 2014; 384: 766-81.
2. Oh K, Jang MJ, Lee NY, Moon JS, Lee CG, Yoo MH, Kim YT. Prevalence and trends in obesity among Korean children and adolescents in 1997 and 2005. Korean J Pediatr 2008; 51: 950-5.
3. Reilly JJ. Descriptive epidemiology and health consequences of childhood obesity. Best Pract Res Clin Endocrinol Metab 2005; 19: 327-41.
4. Ebbeling CB, Pawlak DB, Ludwig DS. Childhood obesity: public-health crisis, common sense cure. Lancet 2002; 360: 473-82.
5. Sims EA. Are there persons who are obese, but metabolically healthy?
Metabolism 2001; 50: 1499-504.
6. Vukovic R, Milenkovic T, Mitrovic K, Todorovic S, Plavsic L, Vukovic A, Zdravkovic D. Preserved insulin sensitivity predicts metabolically healthy obese phenotype in children and adolescents. Eur J Pediatr 2015; 174:
1649-55.
7. Prince RL, Kuk JL, Ambler KA, Dhaliwal J, Ball GD. Predictors of metabol- ically healthy obesity in children. Diabetes Care 2014; 37: 1462-8.
8. Weghuber D, Zelzer S, Stelzer I, Paulmichl K, Kammerhofer D, Schnedl W, Molnar D, Mangge H. High risk vs. “metabolically healthy” phenotype in juvenile obesity - neck subcutaneous adipose tissue and serum uric acid are clinically relevant. Exp Clin Endocrinol Diabetes 2013; 121: 384- 90.
9. Camhi SM, Waring ME, Sisson SB, Hayman LL, Must A. Physical activity and screen time in metabolically healthy obese phenotypes in adoles- cents and adults. J Obes 2013; 2013: 984613.
10. Plourde G, Karelis AD. Current issues in the identification and treatment of metabolically healthy but obese individuals. Nutr Metab Cardiovasc Dis 2014; 24: 455-9.
11. Primeau V, Coderre L, Karelis AD, Brochu M, Lavoie ME, Messier V, Sladek R, Rabasa-Lhoret R. Characterizing the profile of obese patients who are metabolically healthy. Int J Obes 2011; 35: 971-81.
12. Blüher S, Schwarz P. Metabolically healthy obesity from childhood to adult- hood - does weight status alone matter? Metabolism 2014; 63: 1084-92.
13. Mangge H, Zelzer S, Puerstner P, Schnedl WJ, Reeves G, Postolache TT, Weghuber D. Uric acid best predicts metabolically unhealthy obesity with increased cardiovascular risk in youth and adults. Obesity (Silver Spring) 2013; 21: E71-7.
14. Velho S, Paccaud F, Waeber G, Vollenweider P, Marques-Vidal P. Metabol-
ically healthy obesity: different prevalences using different criteria. Eur J Clin Nutr 2010; 64: 1043-51.
15. Yoo HK, Choi EY, Park EW, Cheong YS, Bae RA. Comparison of metabolic characteristics of metabolically healthy but obese (MHO) middle-aged men according to different criteria. Korean J Fam Med 2013; 34: 19-26.
16. Phillips CM, Dillon C, Harrington JM, McCarthy VJ, Kearney PM, Fitzger- ald AP, Perry IJ. Defining metabolically healthy obesity: role of dietary and lifestyle factors. PLoS One 2013; 8: e76188.
17. Lee K. Metabolically obese but normal weight (MONW) and metaboli- cally healthy but obese (MHO) phenotypes in Koreans: characteristics and health behaviors. Asia Pac J Clin Nutr 2009; 18: 280-4.
18. Brochu M, Tchernof A, Dionne IJ, Sites CK, Eltabbakh GH, Sims EA, Poehl- man ET. What are the physical characteristics associated with a normal metabolic profile despite a high level of obesity in postmenopausal wom- en? J Clin Endocrinol Metab 2001; 86: 1020-5.
19. Jennings CL, Lambert EV, Collins M, Joffe Y, Levitt NS, Goedecke JH. De- terminants of insulin-resistant phenotypes in normal-weight and obese Black African women. Obesity (Silver Spring) 2008; 16: 1602-9.
20. Kweon S, Kim Y, Jang MJ, Kim Y, Kim K, Choi S, Chun C, Khang YH, Oh K.
Data resource profile: the Korea National Health and Nutrition Examina- tion Survey (KNHANES). Int J Epidemiol 2014; 43: 69-77.
21. Moon JS, Lee SY, Nam CM, Choi JM, Choe BK, Seo JW, Oh K, Jang MJ, Hwang SS, Yoo MH, et al. 2007 Korean National Growth Charts: review of developmental process and an outlook. Korean J Pediatr 2008; 51: 1-25.
22. Matthews DR, Hosker JP, Rudenski AS, Naylor BA, Treacher DF, Turner RC. Homeostasis model assessment: insulin resistance and beta-cell func- tion from fasting plasma glucose and insulin concentrations in man. Dia- betologia 1985; 28: 412-9.
23. Zimmet P, Alberti KG, Kaufman F, Tajima N, Silink M, Arslanian S, Wong G, Bennett P, Shaw J, Caprio S, et al. The metabolic syndrome in children and adolescents - an IDF consensus report. Pediatr Diabetes 2007; 8: 299- 306.
24. Yi KH, Hwang JS, Kim EY, Lee SH, Kim DH, Lim JS. Prevalence of insulin resistance and cardiometabolic risk in Korean children and adolescents:
a population-based study. Diabetes Res Clin Pract 2014; 103: 106-13.
25. Sénéchal M, Wicklow B, Wittmeier K, Hay J, MacIntosh AC, Eskicioglu P, Venugopal N, McGavock JM. Cardiorespiratory fitness and adiposity in metabolically healthy overweight and obese youth. Pediatrics 2013; 132:
e85-92.
26. Reinehr T, Wolters B, Knop C, Lass N, Holl RW. Strong effect of pubertal status on metabolic health in obese children: a longitudinal study. J Clin Endocrinol Metab 2015; 100: 301-8.
27. Vukovic R, Mitrovic K, Milenkovic T, Todorovic S, Soldatovic I, Sipetic-Gru- jicic S, Zdravkovic D. Insulin-sensitive obese children display a favorable metabolic profile. Eur J Pediatr 2013; 172: 201-6.
28. Weigensberg MJ, Ball GD, Shaibi GQ, Cruz ML, Gower BA, Goran MI. Di- etary fat intake and insulin resistance in black and white children. Obes Res 2005; 13: 1630-7.
29. Ministry of Health and Welfare (KR); The Korean Nutrition Society. Di- etary Reference Intakes for Koreans 2015. Sejong, Ministry of Health and Welfare, 2016.
30. National Institutes of Health (US). Nutrient recommendations: dietary ref- erence intakes (DRI) [Internet]. Available at https://ods.od.nih.gov/Health_
Information/Dietary_Reference_Intakes.aspx [accessed on 1 June 2017].
31. Janssen I, Katzmarzyk PT, Ross R. Waist circumference and not body mass index explains obesity-related health risk. Am J Clin Nutr 2004; 79: 379- 84.
32. Zamrazilova H, Weiss R, Hainer V, Aldhoon-Hainerová I. Cardiometabol- ic health in obese adolescents is related to length of obesity exposure: a pilot study. J Clin Endocrinol Metab 2016; 101: 3088-95.
33. Kramer CK, Zinman B, Retnakaran R. Are metabolically healthy overwei- ght and obesity benign conditions?: a systematic review and meta-analy- sis. Ann Intern Med 2013; 159: 758-69.