Using the National Health Information Database of the National Health Insurance Service in Korea for Monitoring Mortality and Life Expectancy at National and Local Levels
This study explores whether the National Health Information Database (NHID) can be used to monitor health status of entire population in Korea. We calculated the crude mortality rate and life expectancy (LE) at birth across the national, provincial, and municipal levels using the NHID eligibility database from 2004 to 2015, and compared the results with the corresponding values obtained from the Korean Statistical Information Service (KOSIS) of Statistics Korea. The study results showed that the ratio of crude mortality rate between the two data was 0.99. The absolute difference between the LE of the two data was not more than 0.5 years, and did not exceed 0.3 years in gender specific results. The concordance correlation coefficients (CCC) between the crude mortality rates from NHID and the rates from KOSIS ranged 0.997–0.999 among the municipalities. For LE, the CCC between the NHID and KOSIS across the municipalities were 0.990 in 2004–2009 and 0.985 in 2010–2015 among men, and 0.952 in 2004–2009 and 0.914 in 2010–2015 among women, respectively. Overall, the NHID was a good source for monitoring mortality and LE across national, provincial, and municipal levels with the population
representativeness of entire Korean population. The results of this study indicate that NHID may well contribute to the national health promotion policy as a part of the health and health equity monitoring system.
Keywords: Life Expectancy; National Health Information Database; National Health Insurance Service; Statistics Korea; Mortality; Population
Jinwook Bahk,1,2 Yeon-Yong Kim,3 Hee-Yeon Kang,2 Jeehye Lee,4
Ikhan Kim,4 Juyeon Lee,5 Sung-Cheol Yun,6 Jong Heon Park,3 Soon-Ae Shin,7 and Young-Ho Khang2,4
1Department of Public Health, Keimyung University, Daegu, Korea; 2Institute of Health Policy and Management, Seoul National University Medical Research Center, Seoul, Korea; 3Big Data Steering Department, National Health Insurance Service, Wonju, Korea; 4Department of Health Policy and Management, Seoul National University College of Medicine, Seoul, Korea; 5The People’s Health Institute, Seoul, Korea; 6Department of Clinical Epidemiology and Biostatistics, University of Ulsan College of Medicine, Asan Medical Center, Seoul, Korea; 7Gwanak Branch Office, National Health Insurance Service, Seoul, Korea
Received: 27 May 2017 Accepted: 14 August 2017 Address for Correspondence:
Young-Ho Khang, MD, PhD
Department of Health Policy and Management, Seoul National University College of Medicine, 103 Daehak-ro, Jongno-gu, Seoul 03080, Korea
E-mail: [email protected]
Funding: This research was funded and administratively supported by the National Health Insurance Service of Korea (2016-2-0010; NHIS-2017-1-149). Young-Ho Khang was also supported by the National Research Foundation of Korea (NRF) grant funded by the Ministry of Science, ICT and Future Planning (MSIP) (NRF-2014R1A2A1A11051392).
https://doi.org/10.3346/jkms.2017.32.11.1764 • J Korean Med Sci 2017; 32: 1764-1770
INTRODUCTION
The National Health Insurance Service (NHIS) in Korea is the compulsory health insurance scheme covering the whole Ko- rean population. The National Health Information Database (NHID) provided by NHIS can produce various health statistics.
The NHID consists of sub-database (DB) including the eligibility DB, healthcare utilization DB, health screening DB, and health- care provider DB (1). The eligibility DB and healthcare utiliza- tion DB can be used to calculate the life expectancy (LE) and to produce health indicators that represent entire Korean popula- tion. Sociodemographic patterns of health-related factors such as health behaviors and bio-clinical risk factors can be identi- fied through linkage of eligibility DB and health screening DB.
In addition, the NHID is linkable to multiple national second-
ary data maintained by other governmental agencies, including registries of births, deaths, and cancer using 13-digit unique personal identification numbers.
Moreover, using the NHID, municipal level (i.e., si, gun, gu) estimates of health status, health-related factors, and morbidity and mortality measures can be obtained. In Korea, the Korea National Health and Nutrition Examination Survey (KNHANES) and the Community Health Survey (CHS) are the exemplary representative nationwide health surveys. However, the sample size of KNHANES is not enough large to conduct municipal level analysis, although KNHANES, if the data are combined across several years, may provide provincial level data. With re- spect to the CHS, it is possible to calculate the indicators at the municipal level, but the available variables are limited to health behaviors and self-reported health status. While, the NHID al- Occupation & Environmental Medicine
2017-03-16 https://crossmark-cdn.crossref.org/widget/v2.0/logos/CROSSMARK_Color_square.svg
lows researchers to measure the various indicators related to bio-clinical factors, health behaviors, morbidity, and mortality at the municipal level with large sample size and objectively measured data. Furthermore, the National Health Insurance (NHI) premiums are available as a socioeconomic position in- dicator, and thus the NHID can be used as a valuable data source for health inequality monitoring across the nation, metropoli- tan areas, and municipalities. Only a few countries monitor the health of the entire population across the national and local levels using comprehensive data linked to demographic char- acteristics, income, medical use, health behaviors, and death of the whole population (2). If the validity and availability of NHID are ensured, it is expected to be used in various fields other than health and health equity monitoring of population.
In Korea, the residential registration data from the Korean Statistical Information Service (KOSIS) of Statistics Korea offi- cially provide numbers of population and deaths at the national and local levels. Although the NHID also covers whole popula- tion, it is uncertain how much the numbers of population and deaths between NHID and KOSIS are similar especially at the local level. The residential registration data do not include for- eigners while NHID does. In residential registration data, the numbers of military soldiers are counted to population num- bers of districts where the soldiers originally resided. The NHID use the administrative residential information for soldiers. How- ever, until now, no research effort has been made to compare the population and mortality statistics between NHID and KO- SIS.
This study explores whether the NHID DB can be used to monitor health status of entire population in Korea across the national and local levels. For this purpose, we calculate the mor- tality rate and LE at birth across the national, provincial, and municipal levels using the NHID eligibility DB from 2004 to 2015.
Then, we compare the results with the mortality rate and LE calculated using the population data based on resident regis- tration and death certificate data provided by the KOSIS of Sta- tistics Korea.
MATERIALS AND METHODS
The individual data linkage to mortality data was made under agreement between the NHIS and Statistics Korea. After inter- nal linkage processes in Statistics Korea, aggregate data without any personal identifiers were transferred to the researchers of this paper for final analyses.
NHID DB
The numbers of deaths (numerator) and population (denomi- nator) in NHID were obtained from the eligibility DB from 2004 to 2015. Death certificate data were collected by Statistics Korea and were individually linked to the eligibility DB. This data link-
age using the eligibility DB from the NHIS was performed inter- nally in Statistics Korea using unique 13-digit personal identifi- cation numbers. The NHIS constructed 1-year follow-up datas- et using a person-year approach for the numbers of population and deaths. From the NHIS, we obtained aggregate data on the numbers of deaths and population denominators within the calendar years (2004 to 2015), gender, age (0, 1–4, 5–9, 10–11, …, 85+), and regions (national, provincial, and municipal levels).
KOSIS data
The numbers of deaths and population according to the calen- dar years (2004 to 2015), gender, age (0, 1–4, 5–9, 10–11, …, 85+), and regions (national, provincial, and municipal levels) were obtained from death certificate data and resident registration data, respectively, provided by the KOSIS. Mid-year estimates of resident population were used as population denominators.
From the KOSIS web page (3), we collected annual life tables at national level from 2004 to 2015 and life tables at 17 provinces in 2014 (which were the most recent available year at the time of the study).
Statistical analysis
Crude mortality rates per 100,000 across the national, provin- cial, and municipal levels were calculated for both NHID DB and KOSIS data. We calculated LE at birth using life table meth- od. Annual life tables at national level from 2004 to 2015 and life tables at 17 provinces in 2014 were constructed using NHID DB.
For municipal levels, we used six-year (2004–2009 and 2010–
2015) aggregate data for population and deaths to calculate sta- ble LE for municipal areas. Previous studies reported that the minimum population required for stable LE was 5,000 (4-6). Thus, municipal level life tables were constructed using the 6-year probabilities of death by municipal regions for the six year peri- ods 2004–2009 and 2010–2015 for both NHID DB and KOSIS data. Separate life tables were constructed for men and women.
We employed the Kannisto-Thatcher method to expand the open-ended age interval 85+ to estimate the probability of dy- ing for each age group of five-year age groups 85–89, 90–94, …, 120–124, 125+ (7,8). The average proportion of each 5-year age range lived by those who die in the age range was estimated us- ing the iterative method described by Preston et al. (9).
We reclassified some municipal regions where the adminis- trative areas were not exactly matched between the NHID and KOSIS during study periods (2004 to 2015). The administrative districts of NHID DB were divided into 17 provinces and 252 municipal regions based on the 2014 administrative districts in Korea. Sejong Special Provincial Municipality, which was es- tablished in 2012, was reclassified using the previous adminis- trative district (the ‘Dong’ unit) to maintain the consistency of administrative district classification in the NHID DB. However, the administrative classification provided by KOSIS reflected
the actual administrative area of each year. It was necessary to reclassify administrative districts in order to match municipal classification between the two data. Therefore, when there was an inconsistency in the administrative area between the NHID and KOSIS due to a change in the administrative district during the study period, it was reconstructed based on the most com- prehensive administrative district classification. For example, four districts belonging to Cheongju (Sangdang-gu, Seowon- gu, Heungduk-gu, and Cheongwon-gu) and Cheongwon-gun in Chungbuk province were integrated into Cheongju.
We compared number of population, number of deaths, and crude mortality rate per 100,000 between NHID and KOSIS ac-
cording to calendar year and sex. In addition, we evaluated agree- ments of crude mortality rate and LE at municipal level using concordance correlation coefficients (CCC). The CCC was rec- ommended by Lin (10) for assessing agreement of continuous variables. The CCC measures the agreement between two mea- sures while the Pearson correlation coefficient measures their relationship. The CCC ranges between −1 and 1. If the mean difference between the two measures is zero, the CCC will be 1.
Analyses were conducted separately for men and women. All analyses were conducted using SAS V.9.4 (SAS Institute, Cary, NC, USA).
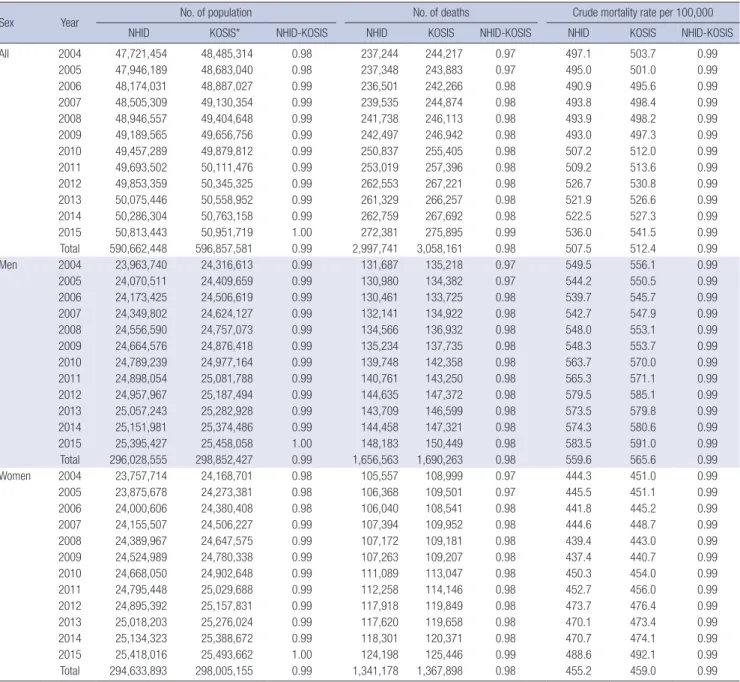
Table 1. Annual comparison of number of population, number of deaths, and crude mortality rate per 100,000 between the NHID and the KOSIS by sex
Sex Year No. of population No. of deaths Crude mortality rate per 100,000
NHID KOSIS* NHID-KOSIS NHID KOSIS NHID-KOSIS NHID KOSIS NHID-KOSIS
All 2004 47,721,454 48,485,314 0.98 237,244 244,217 0.97 497.1 503.7 0.99
2005 47,946,189 48,683,040 0.98 237,348 243,883 0.97 495.0 501.0 0.99
2006 48,174,031 48,887,027 0.99 236,501 242,266 0.98 490.9 495.6 0.99
2007 48,505,309 49,130,354 0.99 239,535 244,874 0.98 493.8 498.4 0.99
2008 48,946,557 49,404,648 0.99 241,738 246,113 0.98 493.9 498.2 0.99
2009 49,189,565 49,656,756 0.99 242,497 246,942 0.98 493.0 497.3 0.99
2010 49,457,289 49,879,812 0.99 250,837 255,405 0.98 507.2 512.0 0.99
2011 49,693,502 50,111,476 0.99 253,019 257,396 0.98 509.2 513.6 0.99
2012 49,853,359 50,345,325 0.99 262,553 267,221 0.98 526.7 530.8 0.99
2013 50,075,446 50,558,952 0.99 261,329 266,257 0.98 521.9 526.6 0.99
2014 50,286,304 50,763,158 0.99 262,759 267,692 0.98 522.5 527.3 0.99
2015 50,813,443 50,951,719 1.00 272,381 275,895 0.99 536.0 541.5 0.99
Total 590,662,448 596,857,581 0.99 2,997,741 3,058,161 0.98 507.5 512.4 0.99
Men 2004 23,963,740 24,316,613 0.99 131,687 135,218 0.97 549.5 556.1 0.99
2005 24,070,511 24,409,659 0.99 130,980 134,382 0.97 544.2 550.5 0.99
2006 24,173,425 24,506,619 0.99 130,461 133,725 0.98 539.7 545.7 0.99
2007 24,349,802 24,624,127 0.99 132,141 134,922 0.98 542.7 547.9 0.99
2008 24,556,590 24,757,073 0.99 134,566 136,932 0.98 548.0 553.1 0.99
2009 24,664,576 24,876,418 0.99 135,234 137,735 0.98 548.3 553.7 0.99
2010 24,789,239 24,977,164 0.99 139,748 142,358 0.98 563.7 570.0 0.99
2011 24,898,054 25,081,788 0.99 140,761 143,250 0.98 565.3 571.1 0.99
2012 24,957,967 25,187,494 0.99 144,635 147,372 0.98 579.5 585.1 0.99
2013 25,057,243 25,282,928 0.99 143,709 146,599 0.98 573.5 579.8 0.99
2014 25,151,981 25,374,486 0.99 144,458 147,321 0.98 574.3 580.6 0.99
2015 25,395,427 25,458,058 1.00 148,183 150,449 0.98 583.5 591.0 0.99
Total 296,028,555 298,852,427 0.99 1,656,563 1,690,263 0.98 559.6 565.6 0.99
Women 2004 23,757,714 24,168,701 0.98 105,557 108,999 0.97 444.3 451.0 0.99
2005 23,875,678 24,273,381 0.98 106,368 109,501 0.97 445.5 451.1 0.99
2006 24,000,606 24,380,408 0.98 106,040 108,541 0.98 441.8 445.2 0.99
2007 24,155,507 24,506,227 0.99 107,394 109,952 0.98 444.6 448.7 0.99
2008 24,389,967 24,647,575 0.99 107,172 109,181 0.98 439.4 443.0 0.99
2009 24,524,989 24,780,338 0.99 107,263 109,207 0.98 437.4 440.7 0.99
2010 24,668,050 24,902,648 0.99 111,089 113,047 0.98 450.3 454.0 0.99
2011 24,795,448 25,029,688 0.99 112,258 114,146 0.98 452.7 456.0 0.99
2012 24,895,392 25,157,831 0.99 117,918 119,849 0.98 473.7 476.4 0.99
2013 25,018,203 25,276,024 0.99 117,620 119,658 0.98 470.1 473.4 0.99
2014 25,134,323 25,388,672 0.99 118,301 120,371 0.98 470.7 474.1 0.99
2015 25,418,016 25,493,662 1.00 124,198 125,446 0.99 488.6 492.1 0.99
Total 294,633,893 298,005,155 0.99 1,341,178 1,367,898 0.98 455.2 459.0 0.99
NHID = National Health Information Database, KOSIS = Korean Statistical Information Service.
*Mid-year estimates of resident population.
Ethics statement
The present study protocol was reviewed and approved by the Seoul National University Hospital Institutional Review Board (IRB No. E-1605-006-758). Informed consent was exempted by the board.
RESULTS
Over the period 2004–2015, the number of population, the num- ber of deaths, and the crude mortality rate per 100,000 in NHID closely approximated to those in KOSIS. The population num- ber of NHID was 98%–100% of the mid-year estimates of resi- dent population in KOSIS. The number of deaths of NHID was 97%–99% of KOSIS. The ratio of crude mortality rate between the two data was 0.99 all over the study period (Table 1).
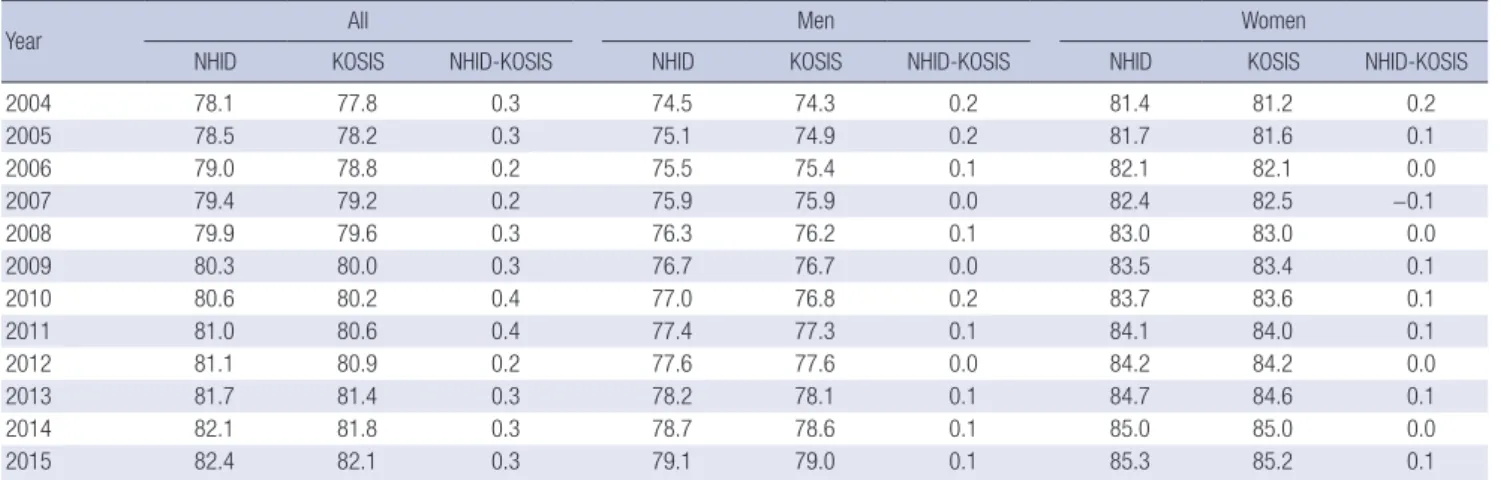
Table 2 shows the annual comparison of the gender-specific
LE calculated in this study using the NHID and the LE provided by KOSIS. The absolute differences between the LEs from the two data were neither more than 0.5 years, nor exceeded 0.3 years in gender specific results. Overall, the LE of the NHID was slightly higher than the KOSIS (Table 2).
The LE from NHID in 2014 was compared with the LE from KOSIS in 2014 at the provincial level. The absolute differences in LE between the two data were between 0.0 and 0.6 years. The difference was the greatest in men of Sejong Special Self-Gov- erning City where the population size among provinces was the smallest. Overall, the LE of the NHID was lower than that of KO- SIS (Table 3).
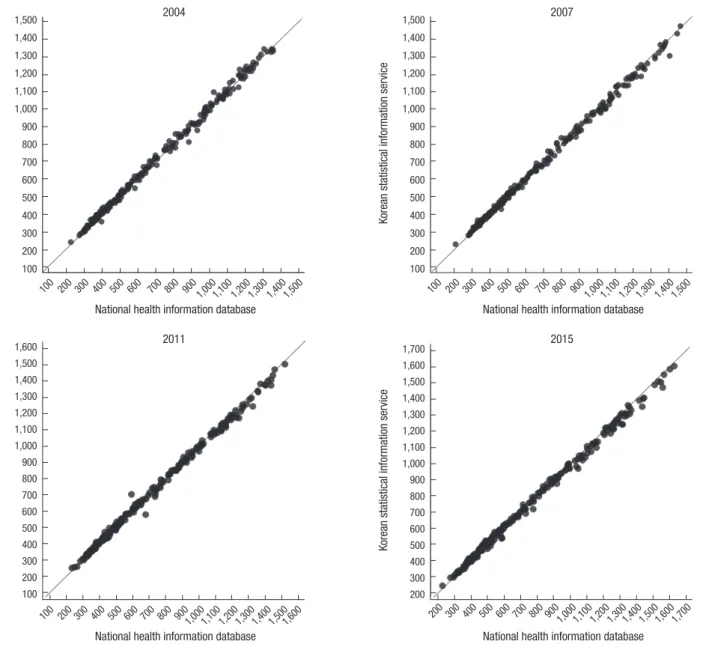
Fig. 1 shows plots comparing the crude mortality rates per 100,000 at the municipal level from NHID with those from KO- SIS in 2004, 2007, 2011, and 2015. Most of the municipalities were located close to the diagonal line y = x where the crude Table 2. Annual comparison of LE at birth between the NHID and the KOSIS according to sex
Year All Men Women
NHID KOSIS NHID-KOSIS NHID KOSIS NHID-KOSIS NHID KOSIS NHID-KOSIS
2004 78.1 77.8 0.3 74.5 74.3 0.2 81.4 81.2 0.2
2005 78.5 78.2 0.3 75.1 74.9 0.2 81.7 81.6 0.1
2006 79.0 78.8 0.2 75.5 75.4 0.1 82.1 82.1 0.0
2007 79.4 79.2 0.2 75.9 75.9 0.0 82.4 82.5 −0.1
2008 79.9 79.6 0.3 76.3 76.2 0.1 83.0 83.0 0.0
2009 80.3 80.0 0.3 76.7 76.7 0.0 83.5 83.4 0.1
2010 80.6 80.2 0.4 77.0 76.8 0.2 83.7 83.6 0.1
2011 81.0 80.6 0.4 77.4 77.3 0.1 84.1 84.0 0.1
2012 81.1 80.9 0.2 77.6 77.6 0.0 84.2 84.2 0.0
2013 81.7 81.4 0.3 78.2 78.1 0.1 84.7 84.6 0.1
2014 82.1 81.8 0.3 78.7 78.6 0.1 85.0 85.0 0.0
2015 82.4 82.1 0.3 79.1 79.0 0.1 85.3 85.2 0.1
LE = life expectancy, NHID = National Health Information Database, KOSIS = Korean Statistical Information Service.
Table 3. Comparison of LE at birth in 2014 between the NHID of the NHIS and the KOSIS of Statistics Korea according to province and sex
Province All Men Women
NHID KOSIS NHID-KOSIS NHID KOSIS NHID-KOSIS NHID KOSIS NHID-KOSIS
Seoul 83.5 83.6 −0.1 80.4 80.6 −0.2 86.0 86.3 −0.3
Busan 81.3 81.6 −0.3 78.1 78.2 −0.1 84.1 84.6 −0.5
Daegu 81.9 82.0 −0.1 78.8 78.8 0.0 84.5 84.8 −0.3
Incheon 81.8 82.0 −0.2 78.6 78.7 −0.1 84.5 85.0 −0.5
Gwangju 82.0 82.0 0.0 78.7 78.8 −0.1 84.8 84.9 −0.1
Daejeon 82.3 82.6 −0.3 79.3 79.6 −0.3 84.7 85.2 −0.5
Ulsan 81.0 81.3 −0.3 78.3 78.5 −0.2 83.2 83.6 −0.4
Sejong 81.2 81.8 −0.6 76.9 78.2 −1.3 85.4 85.4 0.0
Gyeonggi 82.5 82.9 −0.4 79.3 79.7 −0.4 85.1 85.7 −0.6
Gangwon 81.1 81.4 −0.3 77.3 77.6 −0.3 84.4 85.1 −0.7
Chungbuk 81.3 81.7 −0.4 77.5 78.0 −0.5 84.8 85.3 −0.5
Chungnam 81.8 81.8 0.0 78.0 78.2 −0.2 85.3 85.3 0.0
Jeonbuk 81.7 82.0 −0.3 77.9 78.3 −0.4 85.1 85.5 −0.4
Jeonnam 81.1 81.7 −0.6 77.0 77.5 −0.5 84.7 85.7 −1.0
Gyeongbuk 81.3 81.8 −0.5 77.5 78.0 −0.5 84.8 85.2 −0.4
Gyeongnam 81.2 81.6 −0.4 77.3 77.8 −0.5 84.5 85.0 −0.5
Jeju 82.6 82.8 −0.2 78.3 78.7 −0.4 85.9 86.4 −0.5
LE = life expectancy, NHID = National Health Information Database, NHIS = National Health Insurance Service, KOSIS = Korean Statistical Information Service.
Korean statistical information service
National health information database 100 200 300 400 500 600 700 800 900 1,0001,100 1,2001,300 1,4001,500 1,500
1,400 1,300 1,200 1,100 1,000 900 800 700 600 500 400 300 200 100
2004
Korean statistical information service
National health information database 100 200 300 400 500 600 700 800 900 1,0001,100 1,2001,300 1,4001,500 1,500
1,400 1,300 1,200 1,100 1,000 900 800 700 600 500 400 300 200 100
2007
Fig. 1. Comparison of local districts' crude mortality rate between the NHID and the KOSIS in selected years among overall population.
NHID = National Health Information Database, KOSIS = Korean Statistical Information Service.
Korean statistical information service
National health information database 100 200 300 400 500 600 700 800 9001,0001,1001,2001,3001,4001,5001,600 1,600
1,500 1,400 1,300 1,200 1,100 1,000 900 800 700 600 500 400 300 200 100
2011
Korean statistical information service
National health information database 200 300 400 500 600 700 800 900 1,0001,1001,2001,3001,4001,5001,6001,700 1,700
1,600 1,500 1,400 1,300 1,200 1,100 1,000 900 800 700 600 500 400 300 200
2015
Table 4. Correlation coefficient and concordance correlation of local districts’ crude mortality rate per 100,000 in NHID and crude mortality rate in the KOSIS Year No. of
districts
All Men Women
Correlation coefficient (95% CI)
Concordance correlation (95% CI)
Correlation coefficient (95% CI)
Concordance correlation (95% CI)
Correlation coefficient (95% CI)
Concordance correlation (95% CI) 2004 241 0.999 (0.998–0.999) 0.998 (0.998–0.999) 0.998 (0.998–0.999) 0.998 (0.998–0.999) 0.997 (0.996–0.998) 0.997 (0.996–0.997) 2005 243 0.998 (0.998–0.999) 0.998 (0.998–0.999) 0.998 (0.997–0.998) 0.997 (0.997–0.998) 0.997 (0.996–0.998) 0.997 (0.996–0.998) 2006 245 0.999 (0.999–0.999) 0.999 (0.999–0.999) 0.999 (0.999–0.999) 0.999 (0.999–0.999) 0.998 (0.997–0.998) 0.998 (0.997–0.998) 2007 245 0.999 (0.999–0.999) 0.999 (0.998–0.999) 0.998 (0.998–0.999) 0.998 (0.998–0.998) 0.998 (0.997–0.998) 0.998 (0.997–0.998) 2008 246 0.999 (0.999–0.999) 0.999 (0.998–0.999) 0.999 (0.998–0.999) 0.999 (0.998–0.999) 0.997 (0.997–0.998) 0.997 (0.996–0.998) 2009 246 0.999 (0.999–0.999) 0.999 (0.999–0.999) 0.999 (0.998–0.999) 0.999 (0.998–0.999) 0.998 (0.998–0.999) 0.998 (0.998–0.999) 2010 248 0.998 (0.998–0.999) 0.998 (0.997–0.998) 0.998 (0.997–0.998) 0.998 (0.997–0.998) 0.998 (0.997–0.998) 0.997 (0.997–0.998) 2011 248 0.999 (0.998–0.999) 0.998 (0.998–0.999) 0.998 (0.998–0.999) 0.998 (0.997–0.998) 0.998 (0.997–0.998) 0.997 (0.996–0.998) 2012 249 0.999 (0.999–0.999) 0.998 (0.998–0.999) 0.999 (0.998–0.999) 0.998 (0.998–0.999) 0.998 (0.998–0.999) 0.997 (0.996–0.998) 2013 249 0.999 (0.998–0.999) 0.998 (0.997–0.998) 0.998 (0.998–0.999) 0.997 (0.997–0.998) 0.998 (0.997–0.998) 0.997 (0.996–0.997) 2014 249 0.999 (0.998–0.999) 0.998 (0.998–0.998) 0.999 (0.998–0.999) 0.998 (0.998–0.999) 0.998 (0.997–0.998) 0.997 (0.996–0.997) 2015 252 0.999 (0.998–0.999) 0.998 (0.997–0.998) 0.999 (0.998–0.999) 0.998 (0.998–0.998) 0.998 (0.997–0.998) 0.997 (0.996–0.998) NHID = National Health Information Database, KOSIS = Korean Statistical Information Service, CI = confidence interval.
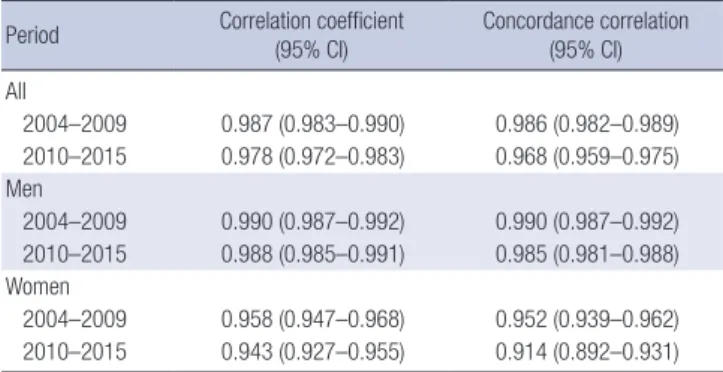
Table 5. Correlation coefficient and concordance correlation of local districts’ LE at birth in NHID and LE at birth in the KOSIS
Period Correlation coefficient
(95% CI) Concordance correlation (95% CI) All
2004–2009 0.987 (0.983–0.990) 0.986 (0.982–0.989) 2010–2015 0.978 (0.972–0.983) 0.968 (0.959–0.975) Men
2004–2009 0.990 (0.987–0.992) 0.990 (0.987–0.992) 2010–2015 0.988 (0.985–0.991) 0.985 (0.981–0.988) Women
2004–2009 0.958 (0.947–0.968) 0.952 (0.939–0.962) 2010–2015 0.943 (0.927–0.955) 0.914 (0.892–0.931) LE = life expectancy, NHID = National Health Information Database, KOSIS = Korean Statistical Information Service, CI = confidence interval.
mortality rates from NHID and KOSIS were the same (Fig. 1).
The CCC between NHID and KOSIS ranged from 0.997 to 0.999 according to sex for crude mortality rates among the munici- palities in all years (Table 4). For LE, the CCC between the NHID and KOSIS across the municipalities was 0.990 in 2004–2009 and 0.985 in 2010–2015 among men, while 0.952 in 2004–2009 and 0.914 in 2010–2015 among women, respectively (Table 5).
LE in municipalities were generally fitted to the diagonal line in both periods 2004–2009 and 2010–2015 (Fig. 2).
DISCUSSION
The results of this study showed that the agreement rate for the crude mortality rate and LE between NHID and KOSIS were substantial. The numbers of both population denominators and mortality numerators from NHID were very close to the numbers from KOSIS and the mortality rates and LEs from two different data were about the same. Considering that the data
Korean statistical information service
National health information database
75 76 77 78 79 80 81 82 83 84 84
83 82 81 80 79 78 77 76 75
2004–2009
Korean statistical information service
National health information database
78 79 80 81 82 83 84 85 86 87 87
86 85 84 83 82 81 80 79 78
2010–2015
Fig. 2. Comparison of local districts' LE at birth between the NHID and the KOSIS in 2004–2009 and 2010–2015 among overall population.
LE = life expectancy, NHID = National Health Information Database, KOSIS = Korean Statistical Information Service.
from KOSIS reflect the official information on Korean popula- tion and mortality rates, the results of this study indicate that the NHID is a good source for monitoring mortality and LE across the national, provincial, and municipal levels with representing the entire Korean population. Therefore, this study provided evidence that it would be possible to perform monitoring of health status and health equity by using the NHID sub-DB in- cluding the eligibility DB, the healthcare utilization DB, and the health screening DB.
Since the eligibility DB is highly consistent with the KOSIS, it can be used to monitor the health status at the national, provin- cial, and municipal levels as well as to monitor the health equi- ty. For example, using the healthcare utilization DB linked to the eligibility DB, it would be possible to employ the outpatient and inpatient utilization data for the study of the disease preva- lence after considering the characteristics of each disease. More- over, it would be also possible to use the health screening DB linked to the eligibility DB as a monitoring data source of health behaviors and related disparities within and between the mu- nicipalities considering the large sample size of the health screen- ing DB. Furthermore, more sophisticated epidemiologic stud- ies such as studies of temporal trends and retrospective cohort studies which might be useful in the construction of the etiology or validation of associations between risk factors and outcome (mortality and morbidity) would be possible using the NHID.
With the nationwide health surveys, such as the KNHANES and CHS, it is possible to conduct an ecological study that reveals the link between the area characteristics and the relevant health gaps across regions.
In addition, using the NHI premium as an income proxy vari- able, it would be possible to establish a monitoring system for health inequality across the national, provincial, and municipal
levels (11). To this end, the NHID can be used to expand health equity indicators and to evaluate the health equity goal of the National Health Plan 2020. Health inequalities in various health outcome indicators according to income level, occupations, and disability status can be described, and health disparities can be shown at the sub-group level covering the municipal units. Thus, in the long term, NHID can contribute to setting a policy agenda for health equity and identifying intervention strategies. In addition, wider use of NHID may well contribute to the national health promotion policy as being a part of the health and health equity monitoring system.
DISCLOSURE
The authors have no potential conflicts of interest to disclose.
AUTHOR CONTRIBUTION
Conceptualization: Khang YH. Data curation: Bahk J, Kim YY.
Formal analysis: Bahk J. Writing - original draft: Bahk J, Khang YH. Writing - review & editing: Bahk J, Kim YY, Kang HY, Lee J, Kim I, Lee J, Yun SC, Park JH, Shin SA, Khang YH.
ORCID
Jinwook Bahk https://orcid.org/0000-0002-7715-9955 Yeon-Yong Kim https://orcid.org/0000-0003-2179-8931 Hee-Yeon Kang https://orcid.org/0000-0001-8530-8087 Jeehye Lee https://orcid.org/0000-0002-9522-1919 Ikhan Kim https://orcid.org/0000-0002-6428-4159 Juyeon Lee https://orcid.org/0000-0001-6235-6043 Sung-Cheol Yun https://orcid.org/0000-0001-8503-109X Jong-Heon Park https://orcid.org/0000-0002-4749-5878 Soon-Ae Shin https://orcid.org/0000-0001-8858-0801 Young-Ho Khang https://orcid.org/0000-0002-9585-8266
REFERENCES
1. Seong SC, Kim YY, Khang YH, Heon Park J, Kang HJ, Lee H, Do CH, Song JS, Bang JH, Ha S, et al. Data resource profile: the National Health Infor- mation Database of the National Health Insurance Service in South Ko- rea. Int J Epidemiol 2017; 46: 799-800.
2. Chetty R, Stepner M, Abraham S, Lin S, Scuderi B, Turner N, Bergeron A, Cutler D. The association between income and life expectancy in the Unit- ed States, 2001–2014. JAMA 2016; 315: 1750-66.
3. Statistics Korea. Korean Statistical Information Service [Internet]. Avail- able at http://kosis.kr/statisticsList/statisticsList_01List.jsp?vwcd=MT_
ZTITLE&parmTabId=M_01_01 [accessed on 25 December 2016].
4. Jonker MF, van Lenthe FJ, Congdon PD, Donkers B, Burdorf A, Macken- bach JP. Comparison of Bayesian random-effects and traditional life ex- pectancy estimations in small-area applications. Am J Epidemiol 2012;
176: 929-37.
5. Scherbov S, Ediev D. Significance of life table estimates for small popula- tions: simulation-based study of estimation errors. Demogr Res 2011; 24:
527-50.
6. Eayres D, Williams ES. Evaluation of methodologies for small area life ex- pectancy estimation. J Epidemiol Community Health 2004; 58: 243-9.
7. Wilmoth JR, Andreev K, Jdanov D, Glei DA, Boe C, Bubenheim M, Phili- pov D, Shkolnikov V, Vachon P. Methods protocol for the human mortali- ty database, version 5 [Internet]. Available at http://mortality.org [accessed on 25 December 2016].
8. Thatcher AR, Kannisto V, Vaupel JW. The Force of Mortality at Ages 80 to 120. Odense, Odense University Press, 1998.
9. Preston SH, Heuveline P, Guillot M. Demography: Measuring and Model- ing Population Processes. Malden, MA, Blackwell Publishers, 2001.
10. Lin LI. A concordance correlation coefficient to evaluate reproducibility.
Biometrics 1989; 45: 255-68.
11. Khang YH, Bahk J, Yi N, Yun SC. Age- and cause-specific contributions to income difference in life expectancy at birth: findings from nationally representative data on one million South Koreans. Eur J Public Health 2016; 26: 242-8.