Received: November 12, 2018 Revised: December 26, 2018 Accepted: December 28, 2018 CliniCAl
neurophysiology
Correspondence to Jong Chul Won
Department of Internal Medicine, Cardiovas- cular and Metabolic Disease Center, Sang- gye Paik Hospital, Inje University College of Medicine, 1342 Dongil-ro, Nowon-gu, Seoul 01757, Korea
Tel: +82-2-950-8860 Fax: +82-2-2091-1464 E-mail: drwonjc@gmail.com
Associations of nerve conduction study variables with clinical symptom scores in patients with type 2 diabetes
Joong Hyun Park1, Jae Hyeon Park1, and Jong Chul Won2
1Department of Neurology, Sanggye Paik Hospital, Inje University College of Medicine, Seoul, Korea
2Department of Internal Medicine, Cardiovascular and Metabolic Disease Center, Sanggye Paik Hospital, Inje University College of Medicine, Seoul, Korea
Background: Diabetic peripheral polyneuropathy (DPN) is associated with a variety of symptoms. Nerve conduction studies (NCSs) are considered to be the gold standard of nerve damage assessments, but these studies are often dissociated from the subjective symptoms observed in DPN patients. Thus, the aim of the present study was to investigate the correla- tions between NCS parameters and neuropathic symptoms quantified using the Michigan Neuropathy Screening Instrument (MNSI).
Methods: Patients with type 2 diabetes mellitus (T2DM) with or without symptoms of neu- ropathy were retrospectively enrolled. Demographic data, clinical laboratory data, MNSI score, and NCS results were collected for analysis; DPN was diagnosed based on the MNSI score (≥ 3.0) and abnormal NCS results. Pearson’s correlation coefficients were used to evaluate the relationships between MNSI score and NCS variables.
Results: The final analyses included 198 patients (115 men and 83 women) with a mean age of 62.6 ± 12.7 years and a mean duration of diabetes of 12.7 ± 8.4 years. The mean MNSI score was 2.8 (range, 0.0–9.0), and 69 patients (34.8%) were diagnosed with DPN. The MNSI score was positively correlated with the median motor nerve latency and negatively correlated with the median motor, ulnar sensory, peroneal, tibial, and sural nerve conduction velocities (NCVs).
When the patients were categorized into quartiles according to MNSI score, peroneal nerve conduction velocity was significantly lower in the second MNSI quartile than in the first MNSI quartile (p = 0.001). A multivariate analysis revealed that the peroneal NCV was independently associated with MNSI score after adjusting for age, sex, and glycosylated hemoglobin A1c (HbA1c) levels.
Conclusions: The present results indicate that a decrease in peroneal NCV was responsible for early sensory deficits in T2DM patients.
Keywords: Diabetic peripheral neuropathy; Nerve conduction study; Michigan Neuropathy Screening Instrument; Peroneal nerve
ORCID
Joong Hyun Park
http://orcid.org/0000-0001-6118-4833 Jae Hyeon Park
http://orcid.org/0000-0003-4523-9384 Jong Chul Won
http://orcid.org/0000-0002-2219-4083
Associations of nerve conduction study variables with clinical symptom scores in patients with type 2 diabetes
Joong Hyun Park1, Jae Hyeon Park1, and Jong Chul Won2
1Department of Neurology, Sanggye Paik Hospital, Inje University College of Medicine, Seoul, Korea
2Department of Internal Medicine, Cardiovascular and Metabolic Disease Center, Sanggye Paik Hospital, Inje University College of Medicine, Seoul, Korea
Background: Diabetic peripheral polyneuropathy (DPN) is associated with a variety of symptoms. Nerve conduction studies (NCSs) are considered to be the gold standard of nerve damage assessments, but these studies are often dissociated from the subjective symptoms observed in DPN patients. Thus, the aim of the present study was to investigate the correla- tions between NCS parameters and neuropathic symptoms quantified using the Michigan Neuropathy Screening Instrument (MNSI).
Methods: Patients with type 2 diabetes mellitus (T2DM) with or without symptoms of neu- ropathy were retrospectively enrolled. Demographic data, clinical laboratory data, MNSI score, and NCS results were collected for analysis; DPN was diagnosed based on the MNSI score (≥ 3.0) and abnormal NCS results. Pearson’s correlation coefficients were used to evaluate the relationships between MNSI score and NCS variables.
Results: The final analyses included 198 patients (115 men and 83 women) with a mean age of 62.6 ± 12.7 years and a mean duration of diabetes of 12.7 ± 8.4 years. The mean MNSI score was 2.8 (range, 0.0–9.0), and 69 patients (34.8%) were diagnosed with DPN. The MNSI score was positively correlated with the median motor nerve latency and negatively correlated with the median motor, ulnar sensory, peroneal, tibial, and sural nerve conduction velocities (NCVs).
When the patients were categorized into quartiles according to MNSI score, peroneal nerve conduction velocity was significantly lower in the second MNSI quartile than in the first MNSI quartile (p = 0.001). A multivariate analysis revealed that the peroneal NCV was independently associated with MNSI score after adjusting for age, sex, and glycosylated hemoglobin A1c (HbA1c) levels.
Conclusions: The present results indicate that a decrease in peroneal NCV was responsible for early sensory deficits in T2DM patients.
Keywords: Diabetic peripheral neuropathy; Nerve conduction study; Michigan Neuropathy Screening Instrument; Peroneal nerve
IntroductIon
Diabetic peripheral neuropathy (DPN), which is the most common and disabling complication associated with type 2 diabetes mellitus (T2DM), affects up to approximately half of the T2DM patient population.1 Recent evidence suggests that DPN begins during the initial stages of T2DM;2 thus, in terms of both short-term and long-term morbidity, its detec- tion during the early course of diabetes is crucial for a better prognosis and the prevention of subsequent complications, such as diabetic foot ulcers, amputation, and/or disability.3,4
Nerve conduction studies (NCSs) are considered the gold standard for the detection of nerve damage,5 but the results are often dissociated from the subjective symptoms of DPN in patients.6 It is not uncommon to encounter diabetic pa- tients with severe neuropathic symptoms but normal NCS parameters because the results of NCSs primarily reflect the function of large myelinated nerve fibers.7 However, some studies have shown that the early functional worsening of peripheral nerves in diabetes precedes objective criteria for abnormal NCS findings or even a clinical diagnosis of DPN.8-10 A variety of clinical scoring methods have been developed as quantitative instruments to document the presence and severity of DPN.11 For example, the Michigan Neuropathy Screening Instrument (MNSI) has been used for the early detection of diabetic neuropathy.12 This tool was designed to be used in ambulatory care situations because it can be administered in a relatively short time period (4–5 minutes). Additionally, the MNSI is useful for the evaluation of diabetic neuropathy symptoms and has been validated as a screening test. The specificity of the MNSI for outpatients is 92%, and its reliability and accuracy have been discussed previously.13
However, few studies have assessed the relationship between the MNSI score and NCS results. Specifically, no studies have investigated the correlations between these variables using quantitative evaluations of conduction ve- locity, latency, and amplitude in different nerves. Thus, the aim of the present study was to investigate the correlations between NCS parameters and the neuropathic symptoms quantified using the MNSI.
MaterIals and Methods
subjects
The Research Ethics Committee of Inje University Sanggye Paik Hospital approved the present study (2017-08–025). The requirement for informed consent was waived because the database was accessed only for purposes of analysis; person- al information was not used. This study was a retrospective review of the medical records of consecutive T2DM patients who visited the Diabetes Clinic of Inje University Sanggye Paik Hospital for the management of hyperglycemia and an evaluation of complications between January 2014 and December 2016. Of the consecutive T2DM patients who either did or did not exhibit symptoms of neuropathy, those who were examined at least once and had both NCS and the MNSI performed within three weeks of each other were retrospectively enrolled in the present study. The exclusion criteria were as follows: a history consistent with exposure to medications or toxins that could provoke peripheral neu- ropathy, medical conditions that could potentially develop into peripheral neuropathy (e.g., alcohol consumption, renal failure, hypothyroidism, infections, and/or malignant neo- plasms), or suspected carpal tunnel syndrome. Demographic data, previous medical history, vascular risk factors, duration of diabetes mellitus, standard blood tests, NCS variables, and MNSI data were assessed through a retrospective review of medical records. Hypertension was defined as blood pres- sure ≥ 140/90 mmHg or the use of antihypertensive medi- cations, and body mass index (BMI) was calculated as weight in kilograms divided by the square of the height in meters.
Conventional electrophysiological studies
When possible, the NCS assessment was carried out under conditions in which the patient’s skin temperature was above 32°C. Eligible patients were evaluated using routine procedures, which included motor and sensory NCSs on the unilateral upper and lower extremities with more pro- nounced neuropathic symptoms. When nerve conduction was not testable on one side, the NCS was performed on the other side. Electromyography was performed using the Si- erra Wave EMG system (Cadwell Industries, Kennewick, WA, USA). A single well-trained technician performed all NCS as- sessments using standard techniques for surface stimulation and recording.14
The NCSs included measurement of the conduction ve- locity, latency, and amplitude of the reactions. For the motor conduction studies, an electrical stimulus was delivered to the skin overlying a motor nerve, and the motor responses were recorded from the muscles supplied by each stimu- lated nerve. For the sensory nerve tests, conduction studies were directly assessed by recording a sensory nerve action potential (SNAPs) proximal to the site of stimulation. The measured NCS parameters included the following variables:
compound muscle action potentials (CMAPs); conduction velocities and distal latencies in the median, ulnar, tibial, and peroneal motor nerves; SNAPs; and conduction velocities of the median, ulnar, and sural sensory nerves. The latencies and amplitudes were automatically calculated, and the tech- nician calculated the motor and sensory conduction veloci- ties by measuring the distance between the two stimulating sites and the difference between the latency onsets of the resultant CMAPs. The measured parameters were compared with the normal values used in the laboratories of our re- search group. The normal ranges of each tested nerve in our laboratories are shown in supplementary Table 1. The NCS results were considered to be abnormal if the latency, ampli- tude, or velocity of each nerve was not within 2.0 standard deviations from the mean for healthy age-matched controls in two or more separate nerves.
MNSI
The well-validated Korean version of the self-reported MNSI was used to evaluate the severity of neuropathic symp- toms.15 The MNSI is a screening and assessment tool for patients with diabetes mellitus who have suspected distal symmetrical peripheral neuropathy.12 Of the two separate assessments included in this measure (a 15-item question- naire and a lower extremity examination), only the 15-item questionnaire was used to compare the NCS parameters with the neuropathic symptoms in the present study. The MNSI consists of items for evaluating foot sensation, includ- ing assessments of pain, temperature, tingling, numbness, cramps, and muscle weakness.12 The responses are added to obtain a total score with a maximum of 13; ‘Yes’ responses to items 1-3, 5-6, 8-9, 11-12, and 14-15 and ‘No’ responses to items 7 and 13 are scored as a single point each; items 4 and 10 (for the measurement of impaired circulation) were not included in the final calculation. A score ≥ 3 was considered
to be abnormal in this study.
Statistical analyses
All data are expressed as a mean ± standard deviation (SD).
Pearson’s correlation coefficients were used to evaluate the relationships between the MNSI score and NCS variables.
After categorizing the patients into quartiles according to MNSI score, the differences in the mean values of the NCS variables and prevalence rates of DPN among the four groups were assessed using one-way analysis of variance (ANOVA). Linear regression analyses were performed to con- firm the correlation between MNSI score and NCS variables as dependent variables after adjusting for age, sex, and gly- cosylated hemoglobin (HbA1c) levels. All data were analyzed using SPSS version 23 statistical software (IBM Corp., Armonk, NY, USA). p < 0.05 were considered to indicate statistical sig- nificance.
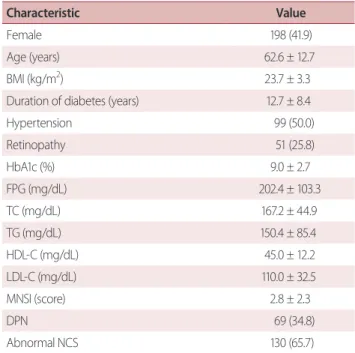
Table 1. Clinical characteristic of study subjects
Characteristic Value
Female 198 (41.9)
Age (years) 62.6 ± 12.7
BMI (kg/m2) 23.7 ± 3.3
Duration of diabetes (years) 12.7 ± 8.4
Hypertension 99 (50.0)
Retinopathy 51 (25.8)
HbA1c (%) 9.0 ± 2.7
FPG (mg/dL) 202.4 ± 103.3
TC (mg/dL) 167.2 ± 44.9
TG (mg/dL) 150.4 ± 85.4
HDL-C (mg/dL) 45.0 ± 12.2
LDL-C (mg/dL) 110.0 ± 32.5
MNSI (score) 2.8 ± 2.3
DPN 69 (34.8)
Abnormal NCS 130 (65.7)
Values are expressed as means ± standard deviation for continuous vari- ables and frequency (%) for categorical variables.
BMI, body mass index; HbA1c, glycosylated hemoglobin; FPG, fasting plasma glucose; TC, total cholesterol; TG, triglyceride; HDL-C, high density lipoprotein-cholesterol; LDL-C, low density lipoprotein-cholesterol; MNSI, Michigan Neuropathy Screening Instrument; DPN, diabetic peripheral neuropathy; NCS, nerve conduction study.
results
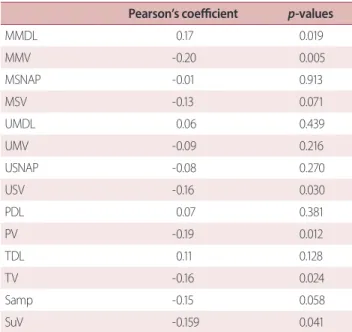
The final analyses in the present study included 198 (115 men and 83 women) of the initial 259 T2DM patients who were referred to the Diabetes Clinic of Sanggye Paik Hospital during the study period. The mean age of the sample was 62.6 ± 12.7 years, the mean HbA1c level was 9.0 ± 2.7%, the mean duration of diabetes was 12.7 ± 8.4 years, and the mean MNSI score was 2.8 ± 2.3 (interquartile range [IQR], 1.5-5.4). The NCSs revealed abnormal values in 65.7% (n = 130) of the sample. When the criteria issued by the Toronto Diabetic Neuropathy Expert Group for DPN were used (MNSI score ≥ 3 and abnormal NCS),4 the prevalence of DPN was 34.8% (Table 1). Abnormal NCS results were confirmed in 75.3% (n = 78/104) of patients with an MNSI score ≥ 3 (n = 104), whereas 64.8% (n = 61/94) of patients with an MNSI score < 3.0. The relationships among MNSI score and the NCS variables were assessed with univariate correlation analyses (Table 2) and revealed that the MNSI score was pos- itively correlated with the median motor nerve latency (p <
0.019) and negatively correlated with the median motor (p = 0.005), ulnar sensory (p = 0.003), peroneal (p = 0.012), tibial (p
= 0.024), and sural (p = 0.041) NCVs.
When the patients were categorized into quartiles accord- ing to their MNSI score, of the demographic characteristics or laboratory values, only age differed significantly among the four groups. Patients in the second and third MNSI quar- tiles were significantly older than those in the first and fourth quartiles (Table 3). The percentages of abnormal NCS results in the first, second, third, and fourth MNSI quartiles were 58.1%, 70.6%, 63.0%, and 69.8%, respectively, but there were no significant differences among the groups. Although the measured NCS parameters did not reach statistical signifi- cance, most of parameters, except for distal motor latency, tended to decrease as the MNSI quartiles increased. Table 3 highlights the significant decrease in peroneal nerve con- duction velocity in the second MNSI quartile in comparison with the first MNSI quartile (p = 0.001). A linear regression analysis revealed that peroneal nerve conduction velocity was independently associated with MNSI score after adjust- ing for age, sex, and HbA1c level (Table 4).
dIscussIon
The present study investigated the relationships among NCS variables and MNSI scores to determine which of the NCS variables were the most sensitive indicators of neuropathic symptom severity. In this study, most of the NCS indices were strongly correlated with the MNSI score, and there was a significant decrease in peroneal NCVs in patients with relatively low symptom scores (first and second MNSI quar- tiles). The results of this study indicate that the relationship between peroneal NCVs and clinical symptom scores is independent of age, sex, duration of diabetes, and glycemic status (Table 4).
In clinical practice, a DPN diagnosis is typically made using a combination of relevant clinical symptoms and sensory nerve examinations. Recently, a consensus report from the American Academy of Neurology, the joint meeting of the 19th annual Diabetic Neuropathy Study Group of the Euro-
table 2. Correlation between MNSI score and NCS variable Pearson’s coefficient p-values
MMDL 0.17 0.019
MMV -0.20 0.005
MSNAP -0.01 0.913
MSV -0.13 0.071
UMDL 0.06 0.439
UMV -0.09 0.216
USNAP -0.08 0.270
USV -0.16 0.030
PDL 0.07 0.381
PV -0.19 0.012
TDL 0.11 0.128
TV -0.16 0.024
Samp -0.15 0.058
SuV -0.159 0.041
MNSI, Michigan Neuropathy Screening Instrument; NCS, nerve conduc- tion study; MMDL, median motor distal latency; MMV, median motor conduction velocity; MSNAP, median sensory nerve action potential amplitude; MSV, median sensory conduction velocity; UMDL, ulnar mo- tor distal latency; UMV, ulnar motor conduction velocity; USNAP, ulnar sensory nerve action potential amplitude; USV, ulnar sensory conduction velocity; PDL, peroneal distal latency; PV, peroneal conduction velocity;
TDL, tibial distal latency; TV, tibial conduction velocity; Samp, sural ampli- tude; SuV, sural conduction velocity.
Table 3. Clinical characteristics and NCS variables according to the quartiles of MNSI score Variable
Quartiles of MNSI score
p-value for trend Q1 (0)
(n = 43)
Q2 (1-2) (n =51)
Q3 (3-4) (n =61)
Q4 (5-9) (n =43)
MNSI score 0 (0) 1 (1-1.6) 3 (3-3.5) 6 (5.8-6.6) < 0.001
Female 13 (30.2) 22 (43.1) 23 (37.7) 25 (58.1) 0.057
Age (years) 59.4 ± 12.8 65.3 ± 11.0 65.1 ± 12.8 59.4 ± 1.3± 0.013±
BMI (kg/m2) 23.7 ± 3.9 23.4 ± 3.2 24.0 ± 3.0 23.6 ± 11.7 0.765
Duration of diabetes (years) 12.0 ± 6.6 11.6 ± 8.3 14.3 ± 9.2 12.3 ± 3.3 0.322±
Hypertension 18 (41.9) 26 (51.0) 31 (50.8) 24 (55.8) 0.624
Retinopathy 11 (37.9) 13 (37.1) 18 (43.9) 9 (37.5) 0.989±
HbA1c (%) 8.5 ± 2.6 8.9 ± 2.2 9.1 ± 3.0 9.2 ± 8.8 0.654
FPG (mg/dL) 149.6 ± 26.5 175.6 ± 53.6 210.0 ± 146.0 284.7 ± 2.8 0.062±
TC (mg/dL) 162.3 ± 42.2 171.2 ± 39.0 167.4 ± 48.7 167.2 ± 82.9 0.879
TG (mg/dL) 146.9 ± 86.0 141.0 ± 98.3 152.5 ± 79.2 164.1 ± 48.4 0.741±
HDL-C (mg/dL) 44.1 ± 11.3 44.2 ± 11.9 46.2 ± 14.0 45.2 ± 75.8 0.882
LDL-C (mg/dL) 102.2 ± 29.1 108.5 ± 31.8 113.6 ± 32.6 114.9 ± 11.5 0.433±
Abnormal NCS 25 (58.1) 36 (70.6) 39 (63.0) 30 (69.8) 0.566
DPN 0 (0.0) 0 (0.0) 39 (63.9) 30 (69.8) < 0.001±
MMDL (ms) 3.6 ± 0.7 3.7 ± 0.5 3.8 ± 0.7 3.9 ± 0.3 0.168
MMV (m/sec) 52.2 ± 4.0 50.4 ± 5.4 50.7 ± 4.8 49.3 ± 8.3 0.074
MSNAP (μV) 15.7 ± 7.3 15.6 ± 8.8 16.2 ± 8.8 16.4 ± 5.4 0.964
MSV (m/sec) 43.1 ± 6.6 40.3 ± 5.8 41.0 ± 6.5 40.1 ± 10.9 0.103
UMDL (ms) 2.7 ± 0.4 2.8 ± 0.5 2.8 ± 0.5 2.8 ± 6.5 0.520
UMV (m/sec) 50.6 ± 6.6 51.3 ± 6.1 50.9 ± 7.2 49.8 ± 0.4 0.733
USNAP (μV) 13.4 ± 7.6 12.7 ± 6.2 12.4 ± 7.2 12.3 ± 7.3 0.897
USV (m/sec) 42.8 ± 5.1 41.7 ± 4.8 41.1 ± 5.2 40.4 ± 6.2 0.212
PDL (ms) 3.7 ± 0.9 4.1 ± 0.7 4.1 ± 0.9 3.9 ± 0.5 0.063
PV (m/sec) 45.0 ± 6.3 40.3 ± 4.8 40.9 ± 5.6 41.0 ± 0.7 0.001
TDL (ms) 3.9 ± 0.7 4.1 ± 0.8 4.0 ± 0.6 4.2 ± 0.6 0.388
TV (m/sec) 42.3 ± 4.9 40.5 ± 6.3 40.4 ± 5.3 39.1 ± 0.6 0.098
Samp (μV) 15.5 ± 9.0 12.9 ± 7.1 11.9 ± 6.2 12.5 ± 6.6 0.135
SuV (m/sec) 37.2 ± 5.2 35.7 ± 3.9 35.2 ± 4.5 35.2 ± 7.5 0.203
Values are presented as mean ± standard deviation or median (interquatile range) for continuous variables and frequency (%) for categorical variables.
Q1/Q2/Q3/Q4, first, second, third, and fourth quartiles, respectively; MNSI, Michigan Neuropathy Screening Instrument; BMI, body mass index; HbA1c, gly- cosylated hemoglobin; FPG, fasting plasma glucose; TC, total cholesterol; TG, triglyceride; HDL-C, high density lipoprotein-cholesterol; LDL-C, low density lipoprotein-cholesterol; NCS, nerve conduction study; DPN, diabetic peripheral neuropathy; MMDL, median motor distal latency; MMV, median motor conduction velocity; MSNAP, median sensory nerve action potential amplitude; MSV, median sensory conduction velocity; UMDL, ulnar motor distal latency; UMV, ulnar motor conduction velocity; USNAP, ulnar sensory nerve action potential amplitude; USV, ulnar sensory conduction velocity; PDL, pero- neal distal latency; PV, peroneal conduction velocity; TDL, tibial distal latency; TV, tibial conduction velocity; Samp, sural amplitude; SuV, sural conduction velocity.
pean Association for the Study of Diabetes (NEURODIAB), and the 8th International Symposium on Diabetic Neurop- athy in Toronto (Canada) proposed that a combination of DPN symptom assessments and NCS results yields a more accurate DPN diagnosis.4,5 Although NCS is thought to be the gold standard for the assessment of nerve damage, there are often discrepancies between patient symptoms and NCS results in clinical practice.10
Findings from the EURODIAB Prospective Complications Study (EPCS), which included 456 patients with type 1 di- abetes, showed that peroneal NCVs decrease in patients with neuropathy, nephropathy (both microalbuminuria and macroalbuminuria), and retinopathy (both non-proliferative and proliferative), and that these relationships remain signif- icant after adjusting for age, sex, height, research participant center, diabetes duration, and HbA1c levels.16 Additionally, the authors of the study suggested that patients with a clin- ical suspicion of microvascular complications should be as- sessed using NCSs to determine the likelihood of subclinical DPN. However, the EPCS was based on a young population of Caucasian Europeans with type 1 diabetes; therefore, the findings may not be generalizable to T2DM patients or other populations. Additional studies investigating the cohort from the Rochester Diabetic Neuropathy Study (RDNS) found that a diagnosis of DPN based on the worsening of NCS variables is superior to a diagnosis made based on clinical symptoms or quantitative sensory nerve tests, even before the criteria
for abnormal NCS have been met. Furthermore, the wors- ening of NCS variables is evident in patients with microal- buminuria and may be an early indicator of microvascular complications.10,17
Although it is difficult to compare the findings of the EPCS and RNDS with those of the present study, our study has similar implications in terms of emphasizing the early evalu- ation of DPN with NCSs. The results of the present study in- dicate that a significant correlation was found between the MNSI score and NCS variables. Another interesting finding is that the peroneal nerve conduction velocity was signifi- cantly lower in patients in the second MNSI quartile than in the first MNSI quartile. Therefore, it is possible that NCSs may be considered when screening for neuropathy, especially in patients with subclinical DPN. Moreover, peroneal NCVs among the NCS indices may be a useful indicator of early nerve damage in T2DM patients.
Previous studies have shown that age, sex, height, dura- tion of diabetes, and glycemic control status (HbA1c) are related to NCS measures.18 The Diabetes Control and Com- plications Trial (DCCT) showed that a poor glycemic control status is associated with deficits in NCS variables,19 and the Early Diabetes Intervention Trial found that the duration of diabetes and height are related to the severity of DPN.20 However, in the present study, the relationship between the clinical symptom score and peroneal NCV was independent of age, sex, and HbA1c levels. Because the present study did not address this relationship using detailed indices of other microvascular (retinopathy or nephropathy) or macrovascu- lar complications or measures of parameters such as height or BMI, further studies will be necessary to confirm which nerve tests are the most appropriate early and accurate indi- cators for the evaluation of functional nerve deficits during the development of clinical DPN. Additionally, the present study enrolled patients who were referred from clinics or hospitals for the proper management of uncontrolled diabe- tes; this may limit the generalizability of the present results.
Nonetheless, the prevalence of DPN (34.8%) in the present study was similar to the rate found in a previous study (33.5%) that assessed large numbers of patients from 40 secondary or tertiary hospitals in Korea.21 Furthermore, the present study showed that 43.9% of patients with abnormal NCS were subclinical (MNSI < 3), which is comparable to a pre- vious study showing that 44% of patients with a negative Table 4. Multivariate analysis for the relationship between
clinical and NCS parameters and MNSI score Unstandardized
coefficients
Standardized
coefficients p-value
β SE β
Constant 0.654 1.918 0.001
Age -0.017 0.014 -0.096 0.223
Sex (female) 0.490 0.333 0.111 0.143
HbA1c (%) 0.022 0.069 0.026 0.745
PV -0.008 0.003 -0.206 0.009
Adjusted R2 0.08
Adjusted for age, sex, glycosylated hemoglobin and peroneal conduc- tion velocity.
NCS, nerve conduction study; MNSI, Michigan Neuropathy Screening Instrument; SE, standard error; HbA1c, glycosylated hemoglobin; PV, pe- roneal conduction velocity.
Neuropathy Deficit Score had normal sensory and motor signs but abnormal NCS results.22 Therefore, the present findings may be representative of actual clinical situations involving T2DM patients.
The pathological and electrophysiological features of nerve damage in DPN include reduced numbers of nerve fibers, decreased conduction amplitudes, and profound decreases in conduction velocities.23,24 Additionally, many of these features are typically more prominent in the lower than the upper extremities. Of the nerves that are damaged during the course of DPN, the peroneal nerve is highly vul- nerable to these alterations relative to the sural, median, and ulnar nerves.8 Therefore, measurements of peroneal NCVs during the early diagnostic window is an effective method for detecting electrophysiological abnormalities in asymp- tomatic DPN patients.22 Consistent with these previous findings, the present correlation analysis revealed that more NCS variables in the lower extremities were prominently related to the clinical symptom score than in the upper ex- tremities (Table 2). Furthermore, although NCVs declined in most of the nerves tested, conduction in the peroneal nerve exhibited a significant decrease even after adjusting for co- variates.24 Despite the exact mechanisms by which diabetes selectively damages the peroneal nerve remain unknown, the fact that peroneal nerve conduction velocity is the most affected electrophysiological parameter among the NCS pa- rameters suggests that distal sensory motor polyneuropathy due to ‘dying back’ axonal degeneration is the primary clini- cal manifestation of DPN.
It has been suggested that neuropathy is an early indica- tor of microvascular complications.25 Currently, NCSs are the most reliable quantitative method available for the objec- tive diagnosis of DPN4 because these tests can identify the slowing of the NCVs, prolongation of latencies, and reduc- tions in nerve action potential amplitudes. For patients with concomitant microvascular complications, a long duration of diabetes, and/or poor diabetes control, NCSs or peroneal NCV assessments may be useful for the detection of nerve damage, even in subclinical cases. Despite recent advances in the understanding of the pathophysiology and natural history of DPN, no breakthroughs regarding the prevention or cure of DPN have been made.23 On the other hand, many studies have shown that strict blood glucose control can prevent the progression of DPN and that the early detection
of DPN during regular follow-up visits can be achieved with appropriate screening and accurate diagnostic tests.11
In conclusion, the present study’s finding of a consider- able correlation between the MNSI score and NCVs may improve physicians’ understanding of the clinical course and neuropathic symptoms of patients with T2DM. Furthermore, of the abnormal NCS parameters identified, decreases in pe- roneal NCVs might be indicative of early sensory deficits in T2DM patients. Thus, the results support a more stratified or personalized management approach to T2DM patients.
Conflicts of Interest
No potential conflict of interest relevant to this article was reported.
Acknowledgment
This work was supported by the grant from the Priority Re- search Centers Program and Basic Science Research Program through the National Research Foundation of Korea funded by the Ministry of Education, Science, and Technology (NRF- 2010-0020224, NRF-2015R1A2A1A13001900).
references
1. Tesfaye S, Selvarajah D. Advances in the epidemiology, patho- genesis and management of diabetic peripheral neuropathy.
Diabetes Metab Res Rev 2012;28 Suppl 1:8-14.
2. Malik RA, Tesfaye S, Newrick PG, Walker D, Rajbhandari SM, Sid- dique I, et al. Sural nerve pathology in diabetic patients with minimal but progressive neuropathy. Diabetologia 2005;48:578- 585.
3. Caputo GM, Cavanagh PR, Ulbrecht JS, Gibbons GW, Karchmer AW. Assessment and management of foot disease in patients with diabetes. N Engl J Med 1994;331:854-860.
4. Tesfaye S, Boulton AJ, Dyck PJ, Freeman R, Horowitz M, Kempler P, et al. Diabetic neuropathies: update on definitions, diagnostic criteria, estimation of severity, and treatments. Diabetes Care 2010;33:2285-2293.
5. England JD, Gronseth GS, Franklin G, Miller RG, Asbury AK, Car- ter GT, et al. Distal symmetric polyneuropathy: a definition for clinical research: report of the American Academy of Neurology, the American Association of Electrodiagnostic Medicine, and the American Academy of Physical Medicine and Rehabilitation.
Neurology 2005;64:199-207.
6. Pastore C, Izura V, Geijo-Barrientos E, Dominguez JR. A compari- son of electrophysiological tests for the early diagnosis of diabet- ic neuropathy. Muscle Nerve 1999;22:1667-1673.
7. Malik RA, Veves A, Tesfaye S, Smith G, Cameron N, Zochodne D, et al. Small fibre neuropathy: role in the diagnosis of diabetic sen- sorimotor polyneuropathy. Diabetes Metab Res Rev 2011;27:678- 684.
8. Dyck PJ, Karnes JL, Daube J, O’Brien P, Service FJ. Clinical and neu- ropathological criteria for the diagnosis and staging of diabetic polyneuropathy. Brain 1985;108(Pt 4):861-880.
9. Dyck PJ, Karnes JL, O’Brien PC, Litchy WJ, Low PA, Melton LJ 3rd.
The Rochester Diabetic Neuropathy Study: reassessment of tests and criteria for diagnosis and staged severity. Neurology 1992;42:1164-1170.
10. Dyck PJ, O’Brien PC, Litchy WJ, Harper CM, Klein CJ. Monotonicity of nerve tests in diabetes: subclinical nerve dysfunction precedes diagnosis of polyneuropathy. Diabetes Care 2005;28:2192-2200.
11. Perkins BA, Olaleye D, Zinman B, Bril V. Simple screening tests for peripheral neuropathy in the diabetes clinic. Diabetes Care 2001;24:250-256.
12. Feldman EL, Stevens MJ, Thomas PK, Brown MB, Canal N, Greene DA. A practical two-step quantitative clinical and electrophys- iological assessment for the diagnosis and staging of diabetic neuropathy. Diabetes Care 1994;17:1281-1289.
13. Lunetta M, Le Moli R, Grasso G, Sangiorgio L. A simplified diag- nostic test for ambulatory screening of peripheral diabetic neu- ropathy. Diabetes Res Clin Pract 1998;39:165-172.
14. Johnsen B, Fuglsang-Frederiksen A. Electrodiagnosis of polyneu- ropathy. Neurophysiol Clin 2000;30:339-351.
15. Kim SS, Won JC, Kwon HS, Kim CH, Lee JH, Park TS, et al. Prev- alence and clinical implications of painful diabetic peripheral neuropathy in type 2 diabetes: results from a nationwide hos- pital-based study of diabetic neuropathy in Korea. Diabetes Res Clin Pract 2014;103:522-529.
16. Charles M, Soedamah-Muthu SS, Tesfaye S, Fuller JH, Arezzo JC, Chaturvedi N, et al. Low peripheral nerve conduction velocities
and amplitudes are strongly related to diabetic microvascular complications in type 1 diabetes: the EURODIAB Prospective Complications Study. Diabetes Care 2010;33:2648-2653.
17. Mauer SM, Goetz FC, McHugh LE, Sutherland DE, Barbosa J, Na- jarian JS, et al. Long-term study of normal kidneys transplanted into patients with type I diabetes. Diabetes 1989;38:516-523.
18. lbers JW, Herman WH, Pop-Busui R, Martin CL, Cleary P, Waberski B. Subclinical neuropathy among Diabetes Control and Compli- cations Trial participants without diagnosable neuropathy at trial completion: possible predictors of incident neuropathy? Diabe- tes Care 2007;30:2613-2618.
19. Diabetes Control and Complications Trial (DCCT): results of feasi- bility study. The DCCT Research Group. Diabetes Care 1987;10:1- 19.
20. Tkac I, Bril V. Glycemic control is related to the electrophysiologic severity of diabetic peripheral sensorimotor polyneuropathy.
Diabetes Care 1998;21:1749-1752.
21. Won JC, Kwon HS, Kim CH, Lee JH, Park TS, Ko KS, et al. Preva- lence and clinical characteristics of diabetic peripheral neurop- athy in hospital patients with type 2 diabetes in Korea. Diabet Med 2012;29:e290-e296.
22. Baba M, Ozaki I. Electrophysiological changes in diabetic neurop- athy: from subclinical alterations to disabling abnormalities. Arch Physiol Biochem 2001;109:234-240.
23. Dyck PJ, Karnes JL, O’Brien P, Okazaki H, Lais A, Engelstad J. The spatial distribution of fiber loss in diabetic polyneuropathy sug- gests ischemia. Ann Neurol 1986;19:440-449.
24. Albers JW, Brown MB, Sima AA, Greene DA. Nerve conduction measures in mild diabetic neuropathy in the Early Diabetes In- tervention Trial: the effects of age, sex, type of diabetes, disease duration, and anthropometric factors. Tolrestat Study Group for the Early Diabetes Intervention Trial. Neurology 1996;46:85-91.
25. Binns-Hall O, Selvarajah D, Sanger D, Walker J, Scott A, Tesfaye S.
One-stop microvascular screening service: an effective model for the early detection of diabetic peripheral neuropathy and the high-risk foot. Diabet Med 2018;35:887-894.