R E S E A R C H A R T I C L E Open Access
The relationship between self-rated health and objective health status: a population-based study
Shunquan Wu † , Rui Wang † , Yanfang Zhao, Xiuqiang Ma, Meijing Wu, Xiaoyan Yan and Jia He *
Abstract
Background: Self-rated health (SRH), a subjective assessment of health status, is extensively used in the public health field. However, whether SRH can reflect the objective health status is still debatable. We aim to reveal the relationship between SRH and objective health status in the general population.
Methods: We assessed the relationship between SRH and objective health status by examining the prevalence of diseases, laboratory parameters, and some health-related factors in different SRH groups. Data were collected from 18,000 residents randomly sampled from the general population in five cities of China (3,600 in each city). SRH was assessed by a single-item health measure with five options: “very good,” “good,” “fair,” “bad,” and “very bad.” The differences in prevalence of diseases, laboratory parameters, and health-related factors between the “healthy” (very good plus good), “relatively healthy” (fair), and “unhealthy” (bad plus very bad) groups were examined. The odds ratios (ORs) referenced by the healthy group were calculated using logistic regression analysis.
Results: The prevalence of all diseases was associated with poorer SRH. The tendency was more prominent in cardio-cerebral vascular diseases, visual impairment, and mental illnesses with larger ORs. Residents with
abnormalities in laboratory parameters tended to have poorer SRH, with ORs ranging from 1.62 (for triglyceride) to 3.48 (for hemoglobin among men) in a comparison of the unhealthy and healthy groups. Most of the health- related factors regarded as risks were associated with poorer SRH. Among them, life and work pressure, poor spiritual status, and poor quality of interpersonal relationships were the most significant factors.
Conclusions: SRH is consistent with objective health status and can serve as a global measure of health status in the general population.
Keywords: Self-rated health, Health status, Disease prevalence, Laboratory parameters, Health-related factors
Background
Self-rated health (SRH) (also known as self-assessed health or self-perceived health) refers to a single-item health measure in which individuals rate the current sta- tus of their own health on a four- or five-point scale from excellent to poor. It is popular for its simplicity and has been extensively studied in Western populations. A series of national and international analyses has consist- ently shown that SRH is a good predictor of mortality of various diseases [1-3]. Furthermore, many researchers have attempted to investigate the factors related to SRH and have found that SRH is strongly associated with
morbidity and disability [4-6]. Economic or social factors are also its main determinants [7-9].
SRH is a subjective reflection of health status, called
“perceived” or “subjective” health. It has been widely studied in survey research [3,7,8]. However, most of the studies concerning SRH have focused on specific age groups, sex groups, or patient groups [10-12]. Studies reporting SRH among the general population are few.
Relative to SRH, some indicators provide direct evidence to the health status of individuals, including previous and current diseases (diagnosed by physicians), and clinical parameters measured in the hospital; these have been termed as “actual” or “objective” health. Some health-related factors, such as demographic characteris- tics, health history, life habit, life stress and work strain, are closely associated with objective health.
* Correspondence: [email protected]
†
Equal contributors
Department of Health Statistics, Second Military Medical University, No.800 of XiangYin Road, Shanghai 200433, China
© 2013 Wu et al.; licensee BioMed Central Ltd. This is an Open Access article distributed under the terms of the Creative
Commons Attribution License (http://creativecommons.org/licenses/by/2.0), which permits unrestricted use, distribution, and
reproduction in any medium, provided the original work is properly cited.
There is a complex relationship between subjective and objective health [13]. Some studies reported that old people perceived their health in positive terms and tended to over-estimate their health [14-16], while other studies found that old people tended to report poorer health than others who were with similar objective health conditions [15,17,18]. Is subjective health consist- ent with objective health? Can SRH serve as a global measure of health status in the general population? The answers are still debatable. Thus, the assessment of the relationship between SRH and objective health status is important, for this determines whether SRH can serve as an indicator of objective health status.
Methods
This study examined the association between SRH and objective health status through a comprehensive collec- tion of data on disease prevalence, laboratory parame- ters, and health-related factors in a randomly selected sample from five cities of China: Shanghai, Beijing, Xi’an, Wuhan and Guangzhou. We attempted to determine the relationship between SRH and objective health status in this population sample and to identify the factors that best discriminate the different SRH groups.
Study design and sample
We used a part of the data from our previous epidemio- logical survey on gastrointestinal diseases in five cities of China. The details of the methodology of the survey have been published elsewhere [19], and are briefly de- scribed here. The survey was administered to 18,000 res- idents aged 18–80 years (3,600 in each city) from April 2007 to January 2008. Eligibility criteria were based on age and the mental and physical ability of subjects to participate in the survey. Residents who were illiterate, not in the 18–80 age group, or suffering from psychiatric illnesses or other disabilities were excluded from the study. They were sampled using a randomized, stratified, multiple-stage sampling method, with the age/gender distribution of the sample in accord with the distribution of local population according to the population census statistics published by the government. Thus, the sample would not be affected by the original impetus of the sur- vey. In the first stage, one or more districts from the urban stratum and one or more counties from the rural stratum were randomly selected from each region. In the second stage, one or more blocks from the urban districts and one or more townships from the rural counties were randomly selected. In the third stage, one or more residential areas from the urban blocks and one or more villages from the rural townships were ran- domly sampled. Questionnaires were self-completed, with trained interviewers giving explanation on any
unclear questions. The entire procedure was overseen by the supervisors to ensure the quality of the survey.
Measurements
Demographic information were gathered on gender, age, weight, height, marital status (married, unmarried, di- vorced, or widowed), educational level (less than primary school, completed only primary school, completed sec- ondary school, completed high school, completed college/
pre-university/university, master’s degree, or doctoral de- gree), total family monthly income (<RMB 2,000, RMB 2,000–4,999, RMB 5,000–9,999, or ≥RMB 10,000), etc.
We used a single-item measure of subjective health—“In general, how would you rate your current health sta- tus?”—to assess self-ratings of health. Five options, which were recommended by the World Health Organization (WHO) [20] and the European Network for the Calcula- tion of Health Expectancies (Euro-PEVES) 2 group [21], were listed: “very good,” “good,” “fair,” “bad,” or “very bad.”
To assess the relationship between SRH and objective health status, subjects were asked to report whether they had been diagnosed with chronic diseases, including hypertension, cerebrovascular disorder, diabetes mellitus, and chronic bronchitis. Blood sampling was carried out after overnight fasting at the Second Military Medical University Changhai Hospital in Shanghai, but this was not done in the other four cities. The following parame- ters were measured to assess the subjects’ health status:
red blood cell (RBC), hemoglobin (HGB), aspartate ami- notransferase (AST), total cholesterol (TC), triglyceride (TG), low-density lipoprotein cholesterol (LDL-C), and fasting plasma glucose (FPG). RBC and HGB indicate the body’s ability to transport oxygen to tissues. AST and TC are indicators that mainly reflect hepatic dysfunc- tion. High levels of TG and LDL-C are two major risk factors for cardiovascular and cerebral diseases. Plasma glucose provides the energy cells require and must be maintained at a certain level in order to sustain the body’s needs. Body mass index (BMI) was calculated as weight in kilograms divided by the square of height in meters, and the WHO criterion for Asian populations was used to classify subjects as obese, overweight, nor- mal weight, and underweight [22]. Data on some health- related factors were also collected, including body weight five years ago, tobacco use, frequency of physical activity, life stress, work strain, spiritual status, and quality of interpersonal relationships. Tobacco use was measured with a single question: “Do you currently smoke?” Six options were given: “no,” “1–5 cigarettes/day,” “6–10 cigarettes/day,” “11–15 cigarettes/day,” “16–20 ciga- rettes/day,” or “≥21 cigarettes/day.” Frequency of phys- ical activity was measured with the following question:
“How often do you engage in physical activities (e.g.,
physically active work, walking, riding a bike, and doing
exercises)?” Four options were given: “never,” “<4 times per month,” “at least once a week,” or “at least once a day.” Life stress was measured by asking “Overall, do you feel stress in your daily life?” and work strain was measured by asking “Overall, do you feel stress in your daily work?” Life stress and work strain were assessed on a five-point scale: “no,” “a little,” “moderate,” “quite a lot,” and “extreme.” Spiritual status was measured by asking “Overall, how would you rate your spirituality?”
and quality of interpersonal relationships was measured by asking “Overall, how would you rate your quality of interpersonal relationships?” Spiritual status and quality of interpersonal relationships were assessed by “very good,” “good,” “moderate,” “bad,” or “very bad.” Women were also asked to answer their ages at menopause.
Statistical analysis
All the data were doubly input into the database by two independent professional data processors using EpiData 3.1. Statistical Analysis System (SAS) 9.1.3 was used for analyzing the survey data. Data are expressed as mean
±standard deviation (SD). For statistical comparison, the differences among the “healthy” (very good plus good),
“relatively healthy” (fair), and “unhealthy” (bad plus very bad) groups were examined, because it was difficult to determine whether “fair” should be defined as “good health” or “poor health,” and because only a few subjects rated their health as very good (1,770 subjects) or very bad (58 subjects). Statistical significance for laboratory parameters among different groups was determined by using an analysis of variance with Bonferroni’s multiple- comparison tests. The odds ratios (ORs) and 95% confi- dence intervals (CIs) for the “relatively healthy” and
“unhealthy” groups were calculated referenced by the
“healthy” group, using logistic regression analysis by controlling for gender, age, region, marital status, educa- tional level, current work, family income, current smok- ing, current drinking, frequency of physical activity, and chronic diseases. All hypothesis tests used two-sided tests and a p-value less than 0.05 was considered statisti- cally significant.
Ethics
All the subjects had been informed that their records might be used for analysis, and had signed a written in- formed consent form before participation. The present study was approved by the ethics committee of Second Military Medical University.
Results
Demographic information
Among the 18,000 subjects, 16,091 actually answered the questionnaires; however, 13 were excluded from the analysis because of considerable missing data or logistic
errors, and another 4 were excluded because they did not answer the general health item. Data from a total of 16,074 subjects were utilized in the statistical analysis, in- cluding 8,388 females (52.18%) and 7,686 males (47.82%).
These subjects had very little missing data (less than 1%), and we excluded the subjects from relevant analysis if they do have missing data on certain items. Subjects’ demo- graphic details are shown in Table 1. The mean age was 42.6 (±15.2) years. Among them, 1,770 subjects (11.01%) rated their health as very good, 7,581 (47.16%) as good, 5,803 (36.10%) as fair, 862 (5.36%) as bad, and 58 (0.36%) as very bad. Age was negatively correlated with health rat- ing. A total of 3,151 subjects completed the blood sam- pling in Shanghai with data suitable for analysis, including 1,749 females (55.51%) and 1,402 males (44.49%), with mean age of 47.7 (±14.1) years. A total of 164 subjects (5.20%) rated their health as very good, 1,347 (42.75%) as good, 1,492 (47.35%) as fair, 141 (4.47%) as bad, and 7 (0.22%) as very bad. Similarly, the older the subjects were, the poorer they rated their health. The objective health status of the “healthy” (very good plus good), “relatively healthy” (fair), and “unhealthy” (bad plus very bad) groups were compared.
Disease prevalence
Table 2 presents the prevalence of various diseases by SRH status, including cardio-cerebral vascular diseases, digestive diseases, respiratory diseases, and mental ill- nesses. Logistic regression analysis showed that signifi- cant increases in the prevalence of all diseases were associated with a lower SRH, adjusting for gender, age, region, marital status, educational level, current work, family income, current smoking, current drinking, fre- quency of physical activity, and other chronic diseases.
The ORs were at least twofold when comparing the un- healthy group with the healthy group, apart from for chronic pharyngitis (OR 1.65 [1.29, 2.11]) and osteoarth- ritis (OR 1.54 [1.13, 2.09]), and there were larger ORs for cardio-cerebral vascular diseases, visual impairment, and mental illnesses. As for tristimania, the OR was 14.14 [5.60, 35.73].
Laboratory parameters
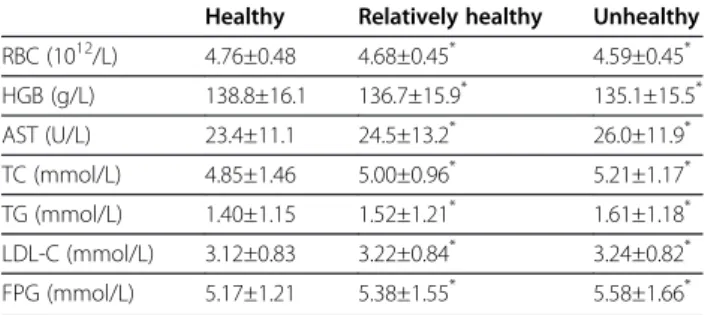
Laboratory parameters of the three groups by SRH sta- tus are presented in Table 3. RBC and HGB were signifi- cantly lower in the relatively healthy and unhealthy groups when compared with the healthy group. Levels of AST, TC, TG, LDL-C, and FPG were significantly higher in the relatively healthy and unhealthy groups than in the healthy group.
Abnormalities in laboratory parameters by SRH status
adjusted for gender (except for RBC and HGB), age,
marital status, educational level, current work, family in-
come, current smoking, current drinking, and frequency
Table 1 Demographic information of the subjects
n (female/male) Mean age (SD) p- value*
Subjects in all five cities
Total 16074 (8388/7686) 42.6 (15.2)
SRH
very good 1770 (845/925) 34.7 (12.7) <0.001
good 7581 (3773/3808) 40.1 (14.3)
fair 5803 (3233/2570) 46.0 (15.0)
bad 862 (506/356) 55.0 (14.6)
very bad 58 (31/27) 53.8 (16.2)
Subjects in Shanghai who have completed the blood sampling
Total 3151 (1749/1402) 47.7 (14.1)
SRH
very good 164 (74/90) 41.5 (13.6) <0.001
good 1347 (694/653) 44.6 (14.0)
fair 1492 (890/602) 50.3 (13.2)
bad 141 (88/53) 58.0 (13.0)
very bad 7 (3/4) 47.6 (16.5)
* p-values for mean ages.
Table 2 Disease prevalence by self-rated health status
Healthy Relatively healthy Unhealthy
n (%) n (%) OR [95% CI] n (%) OR [95% CI]
Hypertension 615 (6.58) 1017 (17.53) 1.83 [1.62, 2.06] 282 (30.65) 2.61 [2.16, 3.15]
Cerebrovascular disorder 93(0.99) 222 (3.83) 2.00 [1.54, 2.58] 119 (12.93) 4.82 [3.53, 6.58]
Angina 53 (0.57) 122 (2.10) 1.88 [1.34, 2.63] 80 (8.70) 6.00 [4.07, 8.86]
Diabetes mellitus 85 (0.91) 238 (4.10) 2.86 [2.20, 3.72] 90 (9.78) 6.36 [4.54, 8.92]
Dyspepsia 351 (3.75) 525 (9.05) 1.81 [1.56, 2.10] 137 (14.89) 2.76 [2.19, 3.49]
Gastritis 693 (7.41) 966 (16.65) 1.74 [1.56, 1.95] 213 (23.15) 2.37 [1.96, 2.87]
Peptic ulcer 213 (2.28) 323 (5.57) 1.63 [1.35, 1.97] 86 (9.35) 2.50 [1.88, 3.33]
IBD 100 (1.07) 146 (2.52) 1.75 [1.33, 2.28] 51 (5.54) 3.14 [2.16, 4.58]
Liver disorder 196 (2.10) 324 (5.58) 2.00 [1.65, 2.43] 80 (8.70) 3.58 [2.65, 4.83]
Gallbladder disorder 241 (2.58) 353 (6.08) 1.43 [1.19, 1.70] 94 (10.22) 2.13 [1.62, 2.80]
Renal disorder 120 (1.28) 212 (3.65) 2.23 [1.76, 2.84] 84 (9.13) 4.41 [3.20, 6.07]
Chronic bronchitis 183 (1.96) 346 (5.96) 2.05 [1.69, 2.48] 100 (10.87) 2.34 [1.77, 3.10]
Asthma 45 (0.48) 75 (1.29) 1.57 [1.06, 2.32] 35 (3.80) 3.57 [2.18, 5.86]
Chronic pharyngitis 518 (5.54) 654 (11.27) 1.65 [1.45, 1.88] 100 (10.87) 1.65 [1.29, 2.11]
Chronic cough 98 (1.05) 188 (3.24) 1.90 [1.46, 2.45] 55 (5.98) 2.45 [1.70, 3.53]
Eczema 80 (0.86) 136 (2.34) 1.98 [1.48, 2.66] 28 (3.04) 3.29 [2.04, 5.30]
Rheumatoid arthritis 267 (2.86) 352 (6.07) 1.44 [1.21, 1.71] 169 (18.37) 2.48 [1.96, 3.13]
Osteoarthritis 176 (1.88) 289 (4.98) 1.61 [1.31, 1.97] 73 (7.93) 1.54 [1.13, 2.09]
Severe visual impairment 35 (0.37) 60 (1.03) 1.69 [1.09, 2.62] 35 (3.80) 4.58 [2.70, 7.78]
Anxiety neurosis 15 (0.16) 28 (0.48) 1.98 [1.07, 2.90] 14 (1.52) 4.48 [2.05, 9.76]
Tristimania 8 (0.09) 32 (0.55) 4.67 [2.15, 10.13] 15 (1.63) 14.14 [5.60, 35.73]
n=16 074.
The odds ratios were calculated referenced by the “healthy” group, using logistic regression analysis by controlling for gender, age, region, marital status, educational level, current work, family income, current smoking, current drinking, frequency of physical activity, and other chronic diseases.
IBD: inflammatory bowel disease.
of physical activity are shown in Table 4. The cut-off values for abnormalities were defined by Changhai Hos- pital according to the criteria for the Chinese people.
For RBC, HGB among women, TC, and FPG, signifi- cantly higher ORs were observed in the relatively healthy and unhealthy groups than in the healthy group. For HGB among men, AST, TG, and LDL-C, the ORs were significantly higher in the unhealthy group than in the healthy group.
Health-related factors
The health-related factors regarded as risks are shown in Table 5. For underweight, marital status, low income,
physical activities, life stress, work strain, spiritual status, and quality of interpersonal relationships, significantly higher ORs were observed in the relatively healthy and unhealthy groups than in the healthy group. The ORs for weight loss, low level of education, and early meno- pause were significantly higher in the unhealthy group than in the healthy group. Among all the factors, life and work pressure, poor spiritual status, and bad quality of interpersonal relationships had larger ORs, which in- dicates that these factors had a considerable impact on people’s health. The ORs for obesity and smoking were not statistically significant. All the ORs were adjusted by gender (except for “age at menopause”), age, region, health-related factors (including marital status, educa- tional level, current work, family income, current smok- ing, current drinking, frequency of physical activity, but excluding itself ), and chronic diseases, using logistic re- gression analysis.
Discussion
This study aimed to determine whether SRH could re- flect objective health status and serve as a global meas- ure of health status in the general population. For this purpose, we examined the relationships between SRH and the following: (1) prevalence of diseases diagnosed by the physicians, (2) laboratory parameters examined in the hospital, and (3) health-related factors that were regarded as risks. We found that lower SRH was associ- ated with significant increases in the prevalence of all the diseases and abnormalities in laboratory parameters. Some health-related factors, including underweight, weight loss, marital status, education, low income, early menopause, physical activities, life stress, work strain, spiritual status, and quality of interpersonal relationships, were signifi- cantly associated with SRH. This suggests that individuals Table 3 Subjects ’ laboratory parameters by self-rated
health status
Healthy Relatively healthy Unhealthy
RBC (10
12/L) 4.76±0.48 4.68±0.45
*4.59±0.45
*HGB (g/L) 138.8±16.1 136.7±15.9
*135.1±15.5
*AST (U/L) 23.4±11.1 24.5±13.2
*26.0±11.9
*TC (mmol/L) 4.85±1.46 5.00±0.96
*5.21±1.17
*TG (mmol/L) 1.40±1.15 1.52±1.21
*1.61±1.18
*LDL-C (mmol/L) 3.12±0.83 3.22±0.84
*3.24±0.82
*FPG (mmol/L) 5.17±1.21 5.38±1.55
*5.58±1.66
*n=3151.
Data are mean ± SD.
Statistical significance was determined using Bonferroni’s multiple-comparison tests.
* p<0.05, comparing with the healthy group.
RBC: red blood cell.
HGB: hemoglobin.
AST: aspartate aminotransferase.
TC: total cholesterol.
TG: triglyceride.
LDL-C: low-density lipoprotein cholesterol.
FPG: fasting plasma glucose.
Table 4 Laboratory parameters abnormalities by self-rated health status Cut-off values for
abnormalities
Healthy Relatively healthy Unhealthy
n (%) n (%) OR [95% CI] n (%) OR [95% CI]
RBC < 3.5×10
12/L
a54 (7.03) 79 (8.88) 1.58 [1.09, 2.17] 10 (10.99) 1.96 [1.04, 3.89]
RBC < 4.0×10
12/L
b11 (1.48) 23 (3.82) 2.98 [1.54, 5.72] 3 (5.26) 3.24 [1.47, 10.24]
HGB < 110 g/L
a35 (4.56) 58 (6.52) 1.43 [1.02, 2.05] 8 (8.79) 1.92 [1.15, 4.20]
HGB < 120 g/L
b16 (2.15) 18 (2.99) 1.38 [0.74, 2.94] 4 (7.02) 3.48 [1.23, 6.04]
AST >= 64 U/L 14 (0.93) 28 (1.88) 1.64 [0.85, 3.12] 4 (2.70) 2.70 [1.65, 4.19]
TC > 5.8 mmol/L 102 (6.75) 158 (10.59) 1.30 [1.01, 1.70] 24 (16.22) 1.72 [1.05, 2.84]
TG > 2.0 mmol/L 244 (16.15) 293 (19.64) 1.17 [0.96, 1.43] 37 (25.00) 1.62 [1.07, 2.47]
LDL-C > 4.9 mmol/L 40 (2.65) 43 (2.88) 0.86 [0.55, 1.36] 12 (8.11) 2.31 [1.13, 4.69]
FPG > 6.2 mmol/L 119 (7.88) 194 (13.00) 1.49 [1.15, 1.91] 26 (17.57) 1.84 [1.09, 2.93]
n=3151.
The odds ratios were calculated referenced by the “healthy” group, using logistic regression analysis by controlling for gender (except for RBC and HGB), age, marital status, educational level, current work, family income, current smoking, current drinking, frequency of physical activity.
a
calculated only among women.
b
calculated only among men.
For abbreviations see Table 3.
may use these factors to evaluate their overall health [23,24].
Notably, most subjects rated their health positively, for only 5.72% subjects reported bad or very bad health, whereas nearly 60% rated their health as very good or good. A survey conducted in Sweden among subjects aged 18–79 years showed that 7% of the men and 9% of the women had poor SRH [25]; thus, the prevalence rate of poor SRH in our population sample, with a similar age range as theirs, was slightly lower. An obvious higher mean age was observed as the subjects rated poorer health. This means that the subjective health status of the population significantly decreases with advancing age.
Similar results were found in previous studies, which showed that age was a risk factor for poor SRH [25-29].
The prevalence of all the diseases included in our study, which was an important indicator of objective health, contributed to decreased SRH. This means that SRH has the ability to distinguish patients from rela- tively healthy people. It is noteworthy that larger ORs were found for cardio-cerebral vascular diseases, visual impairment, and mental illnesses when comparing the unhealthy group with the healthy group. An earlier study reported that with China’s rapid economic development, diseases of the heart and the cerebrovascular system have become two leading causes of deaths in this coun- try, ranking second and third among men, and first and second among women [30]. It is understandable that pa- tients with cardio-cerebral vascular diseases are more likely to worry about their future, and that the diseases cause great cost and burden to themselves and their families; thus, people who suffer from these diseases rated poorer health. Visual impairment is associated
with a decreased ability to perform activities of daily liv- ing and poor quality of life, particularly in the sense of depression and reduced social interaction [31], and pa- tients with mental illnesses had more impairment in quality of life than those with common medical disor- ders [32]. These could explain why patients with visual impairment or mental illnesses rated poorer health. A previous study conducted in Sweden showed that many chronic diseases, such as neurological disease, rheumatoid arthritis, and cancer, are strongly associated with poor SRH [29]. This conclusion has been further strengthened with the evidence from our study.
Studies examining the association of SRH with labora- tory parameters were still limited. In order to further elucidate this relationship in our study, we examined the laboratory parameters in the subjects who had experi- enced blood sampling and listed the laboratory parame- ters with statistical significances. We found that better SRH was associated with increased RBC and HGB, and decreased AST, TC, TG, LDL-C, and FPG. Furthermore, subjects with abnormal laboratory parameters reported poorer health. Laboratory parameters can objectively re- flect health status and are of fundamental importance for the diagnosis, prognosis and treatment of various diseases [33]. The consistency of SRH and objective health status assessed by laboratory parameters is further evidence that SRH is a good indicator of health status.
In addition, the relationship between SRH and some health-related factors, which were regarded as risk fac- tors for health, were examined. Obesity is surprisingly unrelated to poorer SRH, and this finding is inconsistent with many previous studies [24,25,34,35]. On further consideration, this is also explicable. In Chinese culture, Table 5 Health-related factors regarded as risks by self-rated health status
Healthy Relatively healthy Unhealthy
n (%) n (%) OR [95% CI] n (%) OR [95% CI]
BMI: < 18.5 kg/m
2905 (9.68) 536 (9.24) 1.26 [1.11, 1.42] 110 (11.96) 1.86 [1.47, 2.36]
Weight loss: ≥5 kg, compared with 5 years ago 502 (5.37) 440 (7.58) 1.14 [0.99, 1.32] 150 (16.30) 2.01 [1.62, 2.50]
Marital status: divorced/widowed 249 (2.66) 340 (5.86) 1.37 [1.14, 1.65] 122 (13.26) 1.69 [1.30, 2.21]
The highest level of education: less than primary school 593 (6.34) 612 (10.55) 0.98 [0.85, 1.14] 282 (30.65) 1.59 [1.29, 1.97]
Total income of family per month: <2000 Yuan 4942 (52.85) 3190 (54.97) 1.09 [1.01, 1.18] 681 (74.02) 1.59 [1.33, 1.90]
Current smoking: >20 cigarettes per day 382 (4.09) 248 (4.27) 1.02 [0.85, 1.23] 50 (5.43) 1.16 [0.83, 1.63]
Age of menopause:
a≤45 years old 196 (4.24) 238 (7.36) 1.09 [0.88, 1.34] 105 (19.55) 1.68 [1.26, 2.25]
Frequency of physical activity: < 4 times per month 1827 (19.54) 1421 (24.49) 1.56 [1.44, 1.70] 246 (26.74) 2.39 [2.02, 2.84]
Life stress: quite a lot/extreme 686 (7.34) 837 (14.42) 2.33 [2.08, 2.62] 292 (31.74) 6.98 [5.79, 8.42]
Work strain: quite a lot/extreme 560 (5.99) 590 (10.17) 2.07 [1.81, 2.35] 187 (20.33) 5.32 [4.31, 6.57]
Spiritual status: bad/very bad 45 (0.48) 204 (3.52) 6.92 [4.96, 9.66] 282 (30.65) 66.03 [46.37, 94.02]
Quality of interpersonal relationships: bad/very bad 68 (0.73) 129 (2.22) 2.54 [1.86, 3.46] 102 (11.09) 10.24 [7.14, 14.69]
n=16 074.
The odds ratios were calculated referenced by the “healthy” group, using logistic regression analysis by controlling for gender (except for “age of menopause”), age, region, health-related factors (including marital status, educational level, current work, family income, current smoking, current drinking, frequency of physical activity, but excluding itself), and chronic diseases.
a