P
recise fit between the bearing surfaces of the implant abutment and the prosthetic framework has been thought to be one of the most important factors in ensuring long-term success of implant-support- ed restorations.1-3An inaccurate fit of the prosthet- ic framework to the implant abutment was sug-gested to be related with various biologic and pros- thetic complications.3-10Biologic complications include crestal bone loss around the implants and loss of osseointegration.3,11,12Prosthetic ones include loosening of prosthetic-retaining screws and fracturing and/or locking of abutment-retaining screws.1,3,11,13-19
Although it is plausible that misfitting prosthesis may threaten the long-term stability of osseointegated
ANALYSIS OF THE FIT IN THE IMPLANT PROSTHESIS USING A LASER DISPLACEMENT METER AND THREE- DIMENSIONAL FINITE ELEMENT METHOD
Ho-Beom Kwon, D.D.S., M.S.D., Yung-Soo Kim, D.D.S., M.S.D., Ph.D., M.Sc.(O.S.U.), Chang-Whe Kim, D.D.S., M.S.D., Ph.D.
Department of prosthodontics, Graduate school, Seoul National University
A precise fit of the implant prosthesis is one of the most important factors in preventing mechanical complications. To analyze the degree of the misfit of implant prosthesis, a modal testing experiment was accomplished. And to interpret the modal testing analysis mathematically, three-dimen- sional finite element models were established. In the experimental modal testing analysis, with a laser displacement meter, FFT analyzer, impact hammer, etc., natural frequencies of the models with various degree of prosthesis fit were determined after the frequency response function were cal- culated. In the finite element analysis, the natural frequencies and mode shapes of the models which simulated those of experimental modal testing were computed. The results were as follows:
1. Natural frequencies of the prosthesis-abutment were related to the contact state between com- ponents.
2. In the modal testing experiment, the natural frequencies increased from 50
μ
mto 200μ
mgap andreached a plateau.
3. In the finite element analysis, the natural frequencies decreased gradually according to the in- crease of the gap size.
4. In the finite element analysis, the mode shapes of model 1 with misfitting prosthesis showed dif- ferent patterns from those without misfitting prosthesis.
5. The devices including a laser displacement meter used in this study were useful for measuring the natural frequencies of an implant prosthesis which had various degrees of fit.
Key Words
Fit, Modal analysis, Finite element analysis, Natural frequency, Implant
J Korean Acad Prosthodont : Volume 39, Number 6, 2001
implant, clear evidence to support this assump- tion is lacking.20Roberts et al.21demonstrated that ankylosed or osseointegrated implants do not seem to become damaged by constant strain. Carr et al.22 were unable to distinguish an effect from the in- tentionally applied, measured misfit between implants in the animal posterior mandible. Michaels et al.23eval- uated misfitting implant frameworks in animal ex- periment and found no significant clinical, radi- ographic or histomorphometric evidences of implant integration failure, although bone remodeling around the implant was noted. Jemt and Book24 correlated in vivo measurements of implant prosthesis misfit and changes in marginal bone level around im- plants placed in the edentulous maxilla. They reported that a significant statistical correlation between marginal bone level and prosthesis misfit was not found, and the results of both animal and human studies indicated biologic tolerance for prosthesis mis- fit.
Based on the above-mentioned experiments, mis- fits of implant prosthesis seem not to be related with bone loss. But, delayed component failure may be caused by misfitting implant frameworks.10 Many investigators agreed that inaccurate fit can re- sult in the generation of considerable stresses in a screw-retained prosthesis when the superstructure is connected to the abutments and this may give rise to complications and mechanical failure.25-27Although the cause of mechanical failure is multi-factorial, it seems that fixed prostheses should have a passive fit to the osseointegrated implant to prevent me- chanical complications.20,28
If it is assumed that precise fit of the implant prosthesis is significant, the methods of confirming the existence of misfit and measuring the degree of misfit should be considered. There can be two dif- ferent ways in which to measure the misfit of implant prosthesis. One is to measure the misfit when the im- plant prosthesis is laid passively on the top of the abutment without deformation of the prosthesis.29 The other is to measure the force or strain which are
introduced when the prosthesis is screwed with the torque as recommended by manufacturers.
In clinical situations numerous methods to assess the fit of a casting have been suggested including al- ternate finger pressure,7testing for rocking of the cast- ing,30visual inspection for gaps between the gold cylinders and the abutments,30,31tactile assessment of binding and resistance of the screw,1the use of ra- diographs30,32,33a disclosing medium,30,34one screw test,1 and relying on the patient’s feedback regarding pain and discomfort.1,30Although these methods are very useful in clinic, they depend on the clinician’
s senses and subjective decision.
Instruments which can measure the fit of the im- plant prosthesis have been presented. Tan et al.35in- troduced the coordinate measuring machine in the measurement of the three-dimensional distortion of an implant prosthesis. In the study using the coor- dinate measuring machine, Mulcahy et al.36sug- gested that the datum plane and the reference sys- tem should be set up external to the framework, and emphasized the necessity of consistent references, insisting that the value of the data, in other studies was limited because of the use of the relative dis- tortion model. Numerous papers have been pub- lished24,37-39since Lie and Jemt40introduced the pho- togrammetric technique. Riedy et al.41used a laser videography to evaluate the precision of fit be- tween an implant framework and a patient simulation model. Using these current techniques, it seems possible to achieve results at the micrometer level.42 However, most of these methods are difficult to use in the clinical fields. Although the photogram- metric technique is said to be the only method that records the fit data intraorally,42it require a number of instruments, steps and procedures to introduce errors.36
The above-mentioned methods involves mea- suring the gaps without deforming the implant prosthesis. On the other hand, measuring the gap is different when the prosthesis is screwed on the abutment, seeing as with the torque, the super-
structure will bend to close the screw joint when a misfit exists. Although Millington et al.43reported that the screw joint failed to close when the fit discrep- ancy reached 55
μ
m, the magnitude of the gap which can be closed with appropriate torque cannot be expected. The bending of the prosthesis is close- ly related with the stresses generated when the screw is tightened, while the level of the stresses caused by fit discrepancies is dependent on the size, shape, and location of the gaps; interabut- ment distance; and the shape, dimensions, and the stiffness of the metal of the superstructure.43,44 However, the methods of measuring the gaps when the prosthesis is screwed is significant, because the state when the implant superstructures work can be recorded.Some scientists have attempted to use the vibra- tional characteristics in implant research. May et al.45 suggested that the Periotest instrument can be used to quantify the fit of the component interface.
However, results of the studies with the Periotest have demonstrated that the Periotest value can be in- fluenced by such factors as: angulation, striking point, and abutment length.44,46,47Recently, a non- invasive and nondestructive technique based on vibration theories has been proposed by several authors to assess the implant stability and to mon- itor the periodontal problems. The mechanical sta- bility characteristics of the teeth after applying a si- nusoidal force were discussed.48-50Kaneko et al.51,52tried to analyze the relationship between the harmonic re- sponse of an implant and the condition of the bone- implant interface. In their study, they analyzed the waveform of the vibratory response in the time domain. Elias et al.53suggested the theory that the 6- dB roll-off frequency can be used to distinguish between interfaces based on clinically relevant structural characteristics. Meredith et al.54used a steady-state sinusoidal force to induce the vibration of implants in vivo and in vitro. But their method was contact analysis which meant that the vibration transducer must be attached to the tested implant.
Huang et al.48used a modal testing technique to mea- sure the natural frequencies of implants under dif- ferent boundary conditions. In their study, a transient force was applied by an impulse hammer and the vi- bration signal was received through piezoelectric mi- crophone without contacting the tested sample.
Natural frequency is a function of the stiffness and the mass of a structure and is related to the bound- ary conditions of an object.55Modal testing, a non- destructive and non-invasive testing technique, can be used to measure the natural frequency of a structure.56It has been used to evaluate mechanical properties of dental implants and other tissues by in- ducing vibration and subsequently measuring the vibratory response.54Lee et al.56obtained natural fre- quencies from healthy human maxillary central incisors using a modal testing technique and assessed the influence of the periodontal attachment level on frequency.
Finite element modelling has long been used to an- alyze the biomechanical properties of various bio- materials and has proven to be an excellent tool.57-59 It has also provided an accurate mathematical sim- ulation for modal testing experiments. Williams and Williams60calculated the frequency response of dental implants with excitation condition using the finite element method and concluded that the dy- namic analysis is sensitive and meaningful.
The purpose of this study was to evaluate the modal analysis as a tool of measuring the degree of the fit of the implant prosthesis. In this study the pros- thesis-abutment replica complex which had various degree of misfit were analyzed by experimental modal testing and finite element modelling.
MATERIALS AND METHODS
Modal analysis is a process of determining the nat- ural frequencies, damping factors, and mode shapes for a structure. This is usually done either experi- mentally through frequency response testing or mathematically using finite element analysis. In
this study a modal analysis including experimental testing and finite element modelling were used to as- sess the vibrational characteristics of implant pros- thesis.
1. Experimental modal testing
The modal testing analysis is a process whereby a structure is described in terms of it’s natural characteristics which are the frequency, damping and mode shapes.61Natural frequency is an important pa- rameter for dynamic description of a structure.
A time response of a vibration can be converted to the frequency domain by performing a Fourier transform of the time signal. The frequency do- main representation of this converted time signal is often referred to as the frequency response function.
There are peaks in this plot which correspond to the natural frequencies of the system. A frequency re- sponse function is the output to input relationship of a structure. Mathematically, it is the Fourier transform of the output divided by the Fourier transform of the input. In this study a frequency re- sponse function was measured experimentally and then was analyzed to find the natural frequencies.
A model having precise fits of the implant pros- thesis on the abutment replicas was constructed. Three Bra�nemark Estheticone abutment gold cylinders(DCB 141, Nobelbiocare, Go¨teborg, Sweden) were put on a flat surface approximately 7mm apart in a straight line. After they were splinted with a pattern resin(Pattern resin, G-C, Tokyo, Japan), wax-up procedures for full veneer gold crowns were done.
Splinted crowns were cast with type Ⅲ gold. Then three Bra�nemark Estheticone abutment replicas(DCB 176, Nobelbiocare, Go¨teborg, Sweden) were as- sembled to the prosthesis using gold screws(DCA 075, Nobelbiocare, Go¨teborg, Sweden) to fabricate the prosthesis which have a precise fit. Then the pros- thesis-abutment replica assembly was embedded in the dental stone. The stone base was 50mm high, 20mm wide, and 35mm in length.
After the gap-free model has been made, the dis- crepancies between the abutment replica and pros- thesis were created with thickness gauges. The round, ring-like thickness gauges were inserted into the prosthesis-abutment replica interfaces and the gold screws were torqued to 10Ncm. Six different thickness gauges of 20
μ
m, 50μ
m, 100μ
m, 200μ
m, 300μ
m, and 500μ
min thickness were used to create quantitative inaccuracies at the prosthesis-abut- ment replica interfaces.The models were analysed in the following con- ditions:
Model 1: After the experiment with precisely fit- ting prosthesis, thickness gauges of 20
μ
m, 50μ
m, 100μ
m, 200μ
m, 300μ
m, and 500μ
min thickness were placed under the left and the center crowns.Model 2: After the experiment with precisely fit- ting prosthesis, thickness gauges of 20
μ
m, 50μ
m, 100μ
m, 200μ
m, 300μ
m, and 500μ
min thickness were placed under the left and the right crowns.Figure 1 shows the schematic diagram of model 1 and model 2.
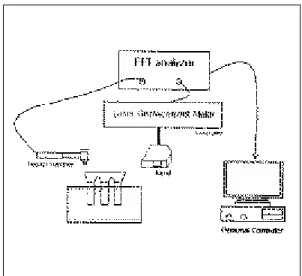
After gold screws were torqued to 10Ncm with hand contra-angle torque controller(CATC1, 3i, FL, U.S.A.), the stone base was fixed by a metal clamp stand. A transient force was directly ap- plied on the end crown to cause the model to vibrate with impedance hammer(5800SL, Dytran, Los Angeles, U.S.A.). A laser displacement meter(LC2100, Keyence, NJ, U.S.A.) was used to acquire the vi- brational response. The displacement was mea- sured on the crown of the opposite end with this in- strument.
Both the impulse force and the induced vibration response signals were transferred to a dual-channel FFT analyser(35670A Dynamic signal analyzer, Hewlett Packard, Palo Alto, U.S.A.). Figure 2 rep- resents the instrumentation setting for the experi- mental modal testing.
The response signal spectrum of a frequency do- main was recorded. The data were collected and the natural frequencies were determined. The peak
frequency in the frequency response function plot was regarded as the natural frequency.
2. Finite element analysis
The finite element method enables the investigator to simulate on the computer any physical state by con- structing approximate numerical solutions.62With eigenvalue analysis, natural frequencies and mode shapes were found in the finite element model.
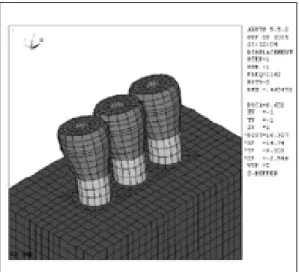
Mode shape is a very definitive pattern of structural deformation at the natural frequencies. This cal- culation was made without any external force, so the results were intrinsic to the structure. To interpret the modal testing analysis mathematically, three-di- mensional finite element models which simulated the modal testing models were constructed(Figure 3).
Each component was designed individually. The geometries of the components were obtained from direct measurements of the components with vernier caliper. The same geometries and the dimensions were used as the experimental modal testing. Every effort was made to simulate the real model used in the modal analysis as closely as possibly except for the prosthesis. A simplified shape of the crowns
was modeled for the simplification of modelling. The total number of the models was 13. The model with a precise gap had a total of 15,669 nodes and 14,616 three-dimensional elements. The other mod- els with the thickness gauges had a total of 15,816 nodes and 14,696 of three-dimensional elements. All of the elements were treated as homogeneous, isotropic, and linear elastic.
Prosthesis and thickness gauges were assumed to be made of type Ⅲ gold, and gold screws were assumed to be made of type Ⅳ gold. Abutment replicas and thickness gauges were assumed to be Fig. 1. The schematic representation of model 1 and mod-
el 2.
Fig. 2.The instrumentation setting for modal testing analysis.
Fig. 3. 3-dimensional model with precise prosthesis fit.
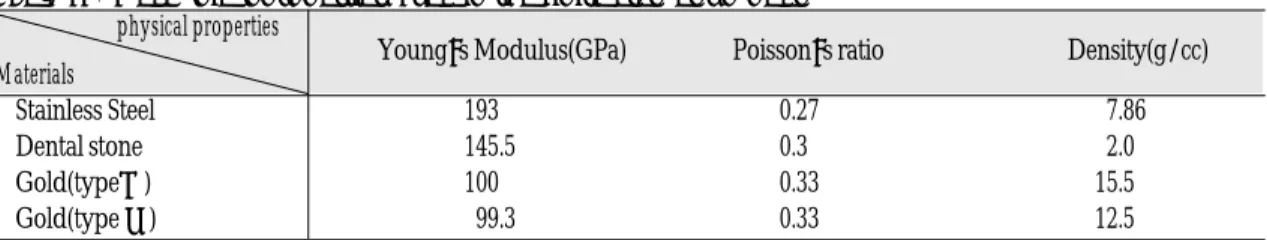
made of stainless steel. Values of the mechanical prop- erties were obtained from the previously published studies.63-67Table Ⅰ shows the mechanical proper- ties used in this study.
Models were constrained in all directions at the nodes of the underside of the stone base to simulate the fixed condition by metal clamp in the experimental modal testing. Eigenvalue analyses were performed by means of the Ansys program(Ansys, Swanson Analysis, USA), which was run on a personal computer with a pentium Ⅲ 550MHz central processing unit.
After the first and the second natural frequencies of the models were found, the mode shape at each of nat- ural frequency was calculated and recorded.
RESULTS
1. Experimental modal analysis
A plot of frequency against the amplitude for a
model with a precise prosthesis is shown in Figure 4. This is a representative plot of frequency against the receptance for the models used in this study. The natural frequency was determined from the peaks.
All of the plots showed a similar patterns.
Theoretically, the number of the natural frequencies
Fig. 4. A spectrum for a precise model in the frequen- cy domain.
Fig. 5. Frequency-receptance plot of model 1 indicating natural frequencies.
Fig. 6.Frequency-receptance plot of model 2 indicating natural frequencies.
Table Ⅰ. Mechanical properties used in the finite element model physical properties
Young’s Modulus(GPa) Poisson’s ratio Density(g/cc) Materials
Stainless Steel 193 0.27 7.86
Dental stone 145.5 0.3 2.0
Gold(typeⅢ) 100 0.33 15.5
Gold(type Ⅳ) 99.3 0.33 12.5
of the models exist infinitively, but only the first and the second peaks were clear. Figure 5, 6 represents the natural frequencies in the models 1 and model 2.
When the prosthesis was fitted precisely, the
first mode frequency was 1162Hz. This first natur- al frequency increased until 100
μ
mthickness gauges were used in model 1. And when the 100μ
mthick-ness gauge was used, the first natural frequency
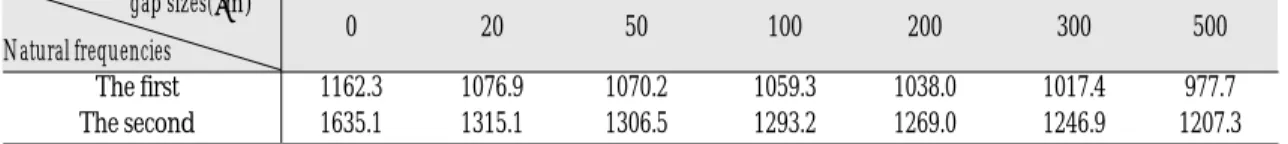
Table Ⅳ. The first and the second natural frequencies of the model 1 from finite element methods(Hz) gap sizes(μm)
0 20 50 100 200 300 500
Natural frequencies
The first 1162.3 1076.9 1070.2 1059.3 1038.0 1017.4 977.7
The second 1635.1 1315.1 1306.5 1293.2 1269.0 1246.9 1207.3
Table Ⅴ. The first and the second natural frequencies of the model 2 from finite element methods(Hz) gap sizes(μm)
0 20 50 100 200 300 500
Natural frequencies
The first 1162.3 1096.3 1090.1 1080.0 1060.2 1041.0 1003.9 The second 1635.1 1475.2 1467.7 1455.6 1432.8 1411.2 1371.0 Fig. 8. Natural frequencies in model 1 and model 2 from finite element methods.
Fig. 7.Natural frequencies in model 1 and model 2 from modal testing.
Table Ⅱ. The first and the second natural frequencies of model 1 from modal testing(Hz) gap sizes(μm)
0 20 50 100 200 300 500
Natural frequencies
The first 1162 1168 1176 1192 1184 1182 1180
The second 1638 1795 1944 2237 2336 2320 2314
Table Ⅲ. The first and the second natural frequencies of the model 2 from modal testing(Hz) gap sizes(μm)
0 20 50 100 200 300 500
Natural frequencies
The first 1162 1184 1192 1189 1187 1186 1185
The second 1638 2078 2268 2264 2263 2262 2260
showed the highest value, 1192Hz. When the gauges thicker than 100
μ
mwere used, the natural fre- quencies decreased slightly. At the second mode nat- ural frequencies, the same tendency was observed, however, the highest value occurred when a 200μ
mthickness gauge was used.
The results of model 2 are presented in table Ⅲ.
The natural frequencies in model 2 showed a sim- ilar tendency with those of model 1, except for the fact that in model 2, 50
μ
mwas the significant gap sizein the natural frequency change.
Figure 7 shows the natural frequency changes in model 1 and model 2 from the experimental modal testing. The first natural frequencies in both models showed a similar pattern, and they demon- strated no significant increase or decrease greatly ac- cording to the replacement of the thickness gauges.
However, the second frequencies increased in both the models in the large scale and reached the plateau at 200
μ
min model 1 and at 50μ
min model 2 .Fig. 9. The first mode shape with precise fit. Fig. 10. The second mode shape with precise fit.
Fig. 11. The first mode shape in model 1 with 100
μ
mthickness gauge.
Fig. 12.The second mode shape in model 1 with 100
μ
mthickness gauge.2. Finite element modelling
Table Ⅳ, Ⅴ and figure 8 represents the resul-ts of the finite element analysis. Unlike the results of the modal testing experiment, the natural fre- quencies of all the models decreased as the gap size increased.
Figure 9 to figure 12 shows the representative mode shapes from the finite element analysis. The first and the second mode shapes of the model with pre- cise prosthesis as well as those of model 1 with the 100
μ
mthickness gauge are presented. The pat- terns of the mode shapes of all the models were sim- ilar. However, the part where the misfit exist showed a larger deformation pattern than that in the model with precise prosthesis.DISCUSSION
Vibrational analysis has been widely discussed in dental and medical fields. Modal analysis is a process whereby a structure is described in terms of its natural characteristics which are the frequency, damping and mode shapes. It was first applied around 1940 in the search for a better understand- ing of aircraft dynamic behaviour. Until the end of the 1960’s, developments were slow and experimental techniques were based on the use of expensive and cumbersome narrow band analogue spectrum analysers. The modern era of modal analysis is thought to started at the beginning of the 1970’s, based upon the commercial availability of Fast Fourier Transform spectrum analyzers, together with the availability of increasingly smaller, less ex- pensive and more powerful digital computers to process the data.69
In the medical field, several authors have proposed techniques based on the vibrational behaviour of bones to assess the bone quality and attempts have been made to use it as an orthopedic diagnostic tool.68Jurist70measured the resonant frequencies of the ulna, Van der Perre et al.71identified different
bending vibration modes of the human tibia in vi- vo, Cornelissen et al.72investigated the influence of the surrounding soft tissues, joints and fibula on the vibrational behaviour of the tibia, and Cornelissen et al.73discussed the sensitivity of the different modes to fracture healing. Some other investigators found that boundary conditions are the main de- terminants for resonant frequencies in the long bone studies.74
In the dental field, the applications of the vibration technique were mainly focused on the quantita- tive measurement of bone quality before or at the time of the implant placement, during the measurement of the degree of osseointegration54and the assessment of the conditions of periodontal problems.56
Natural frequency is the most important parameter of the vibration response when a structure is set to vibrate. It is a dynamic function of stiffness and mass and can reflect the boundary conditions of the structure. In this study by inserting various thickness gauges between the prosthesis and the abutment repli- ca, the boundary conditions were assumed to have changed.
The natural frequencies of the models used in this study could be obtained from the experiment or com- puter simulation. In this study, both the experi- mental analysis and the numerical method were used.
Nowadays, since technology using computers has developed so greatly, it seems possible to calculate everything on a computer. Nevertheless, it is still nec- essary to measure the vibrations in the experiment, because the reality is very different and it is worth- while when considering the reasons for measuring.
One reason lies in the fallibility of predictions of stiff- ness. Another reason is related with damping, since damping alone controls the heights of the reso- nance peaks.75The mechanics of damping is still not understood and claims that damping in normal structures which can be predicted should be treat- ed with scepticism.75On the other hand, an adequate mathematical model can be said to be of great im- portance. Such a model could provide deeper un-
derstanding of the experimental observations and perhaps replace experiments in such situations where it would be unethical, very costly or impos- sible to perform.55 Furthermore, Williams and Williams60stated that the numerical method represents a valid preliminary approach to the assessment of implant osseointegration and is capable of provid- ing a guide to the design of the experimental ap- paratus for the measurement of the displacement and the frequency in vivo. So it is worth carrying out and comparing both the experimental study and the numerical analysis at the same time.
In the experimental modal analysis of this study, a laser displacement meter was used to measure the frequency response function. In other studies, var- ious instruments had been used. Accelerometer is one of the most common devices used for vibrational sig- nal detection.76,77With an accelerometer, acceleration is acquired, so Inertance or Accelerance can be ac- quired. However, because an accelerometer is a contact device, there is a problem with attaching it to the target. In addition, when the test body is excited, the accelerometer and the test body vi- brate together, owing to their physical attachment.
Thus, when the overall vibration response is mea- sured, the signal includes a regulatory contribu- tion based upon the construction materials of the ac- celerometer.78Moreover, it is said that the weight of the accelerometer cannot be ignored with regard to the natural frequency assessment.79Some investigators used a microphone to avoid the disadvantages of the accelerometer.68,78 In this study, a laser displace- ment meter was used. As this device is a non-con- tact device, it could overcome the shortcomings of a contact device. With a laser displacement meter, the response parameter is displacement. This par- ticular form of frequency response function is called a Receptance. The laser displacement meter used in this study has a 12
μ
mdiameter beam spot, a reso- lution of 0.01μ
m, and about 30mm of operating distance. It consists of a sensor head and a con- troller. With the sensor head, the measurementsare made and the data is sent to the FFT analyzer by the controller.
In the experimental modal analysis, the natural fre- quencies were influenced by the changes in the thickness gauges. The results of model 1 were dif- ferent from those of model 2. Generally the first nat- ural frequency did not change much, but the second natural frequency was altered according to the gap size. These changes seemed to be related with ver- tical discrepancies. The highest natural frequency val- ue was observed at the gap size of 100
μ
min the first natural frequency and at the gap size of 200μ
min thesecond natural frequency of model 1. The highest val- ue appeared when a 50
μ
m thickness gauge was used in model 2 which had an intermediate abutment.So when a fit discrepancy was situated at the in- termediate abutment, the maximum rate of in- crease in the second natural frequency value occurred within a 50
μ
mgap. Changes in the natural fre- quencies can be caused by the difference in the contact area between the gold cylinder and the top of the abutment replica. In this study, the vertical dis- crepancies made a difference in the contact sur- face, since only the vertical ones could be created by inserting thickness gauges. The thickness where the natural frequency values reached the plateau, ap- peared to be the point where complete separation be- tween the prosthesis and the abutment replica oc- curred. However, at this separation thickness, only the second natural frequency showed a remark- able change. Millington et al.43reported that at gaps greater than 55μ
m, the gold screw did not develop sufficient force to bend the superstructure enough to close the joint. This results was similar to those in this study. However, the fit discrepancy after tight- ening with gold screw depends on various factors such as the interabutment distance, as well as the ma- terials and the shape of the prosthesis etc. This study has shown that the screw joint failed to close earlier than when it was located at the end abutment when the fit discrepancy was situated at the inter- mediate abutment. And this results coincided withthose of previous study.43
Meredith et al.54suggested in his study where he measured the resonance frequencies of the implant using a contact transducer that the resonance fre- quency of the system may be influenced by the tightness of the screw which was used to attach the transducer to the implant as this may change the overall stiffness. And Hwang et al.48reported in his vibration analysis on the implant-bone interface that the reduction in clamping torque of dental implant resulted in the lowering of the natural fre- quency value due to the reduced stability of the test- ed implants. In this study, the stone base was fixed by a metal clamp with hand tightening and the prosthesis were screwed onto the abutment replica with a 10N㎝ torque using a hand torque con- troller. The degree of clamping the stone base and the accuracy of the hand torque driver would have influenced the results. So the natural frequency values in this study would be changed if the different environments were set.
In this study, the natural frequency value of the ex- perimental modal testing showed a different tendency with those of the finite element modelling. In the fi- nite element modelling the data were calculated mathematically. The density, poisson’s ratio, and Young’s modulus of the materials used in the finite element analysis determined the natural frequencies.
The increase in the mass and the height of the pros- thesis as the thicker thickness gauges were used seemed to be related with the gradual decrease of the natural frequency value, because the mass and the length of the vibrating object are inversely propor- tional to natural frequency value. The discord of the natural frequency values between the experimental modal testing and the mathematical calculation shows the limitation of finite element analysis. It may include incorrect material properties, assumptions used in finite element modelling such as homo- geneity, isotropy, and linear elasticity of the mod- els as well as the undamped condition. In the ex- perimental modal testing, other factors such as
damping would have played an important role in changing the natural frequency value.
CONCLUSIONS
In this study, to analyze the vibrational charac- teristics of implant prosthesis with various degree of fit, the experimental modal testing and the three- dimensional finite element analysis were used. In the experimental modal testing, devices including laser displacement meter were used to find the natural fre- quencies of the models. With the finite element methods, natural frequencies and mode shapes were calculated. Within the limitations of study design, the following conclusions were drawn.
1. Natural frequencies of the prosthesis-abutment were related to the contact state between com- ponents.
2. In the modal testing experiment, the natural fre- quencies increased from 50
μ
mto 200μ
mgapand reached a plateau.
3. In the finite element analysis, the natural fre- quencies decreased gradually according to the in- crease of the gap size.
4. In the finite element analysis, the mode shapes of model 1 with misfitting prosthesis showed dif- ferent patterns from those without misfitting prosthesis.
5. The devices including a laser displacement me- ter used in this study were useful for measuring the natural frequencies of an implant prosthesis which have various degrees of fit.
REFERENCES
1. Jemt T. Failures and complications in 391 con- secutively inserted fixed prostheses supported by Bra�nemark implants in edentulous jaws: A study of treatment from the time of prosthesis placement to the first annual checkup. Int J Oral Maxillofac Implants 1991;6:270-276.
2. Cox J, Zarb G. Alternative prosthodontic super- structure designs. Swed Dent J 1985;28(suppl):71- 75.
3. Adell R, Lekholm U, Rockler B, Bra�nemark P-I. A
15 year follow-up study of osseo-integrated implants in the treatment of the edentulous jaw. Int J Oral Surg 1981;10: 387-416.
4. Albrektsson T, Jansson T, Lekholm U. Osseoin- tegrated dental implants. Dent Clin North Am 1986;30:151-174.
5. Taylor TD. Prosthodontic problems and limitations associated with osseointegration J Prosthet Dent 1998;79:74-78.
6. Skalak R. Biomechanical considerations in os- seointegrated prostheses. J Prosthet Dent 1983;49:843-848.
7. Henry PJ. An alternative method for the produc- tion of accurate casts and occlusal records in os- seointegrated implant rehabilitation. J Prosthet Dent 1987;58:694-697.
8. Davis DM, Zarb GA, Chao Y. Studies on frame- works for osseointegrated prostheses. Part 1. The effect of varying the number of supporting abut- ments. Int J Oral Maxillofac Implants 1988;3:197- 201.
9. Worthington P, Bolender CL, Taylor TD. The Swedish system of osseointegrated implants:
Problems and complications encountered during a 4-year trial period. Int J Oral Maxillofac Implants 1987;2:77-84.
10. Wee AG, Aquilino SA, Schneider RL. Strategies to achieve fit in implant prosthodontics: A review of the literature. Int J Prosthodont 1999;12:167-178.
11. Zarb GA, Schmitt A. A longitudinal clinical ef- fectiveness of osseointegrated dental implants.
The Toronto study. Part II. The prosthetic results.
J Prosthet Dent 1990;64:53-61.
12. Zarb GA, Jansson TP. Prosthodontic procedures and laboratory procedures and protocol. In: Bra�ne- mark P-I, Zarb GA, Albrektsson T. Tissue-integrated prostheses. Chicago: Quintessence, 1985.
13. Albrektsson T, A multicenter report on osseoin- tegrated oral implants. J Prosthet Dent 1988;60:75- 84.
14. Adell R, Ericksson B, Lekholm U, Bra�nemarkk P- I, Jemt T. A long-term follow-up study of os- seointegrated implants in the treatment of totally edentulous jaws. Int J Oral Maxillofac Implants 1990;5:347-359.
15. Sones AD. Complications with osseointegrated implants. J Prosthet Dent 1989;62: 270-276.
16. Johansson G, Palmqvist S. Complications, sup- plementary treatment and maintenance in eden- tulous arches with implant-supported fixed pros- theses. Int J Prosthodont 1990;3:89-92.
17. Naert I, Quirynen M, van Steenberghe D, Darius P. A study of 589 consecutive implants supporting complete fixed prostheses. Part II: Prosthetic aspects.
J Prosthet Dent 1992;68:949-956.
18. Tolman DE, Laney WR. Tissue-integrated prosthesis complications. Int J Oral Maxillofac Implants 1992;7:477-484.
19. Carlsson B, Carlsson GE. Prosthodontic compli- cations in osseointegrated dental implants treatment.
Int J Oral Maxillofac Implants 1994;9:90-94.
20. Taylor TD, Agar JR, Vogiatzi, T Implant Pros- thodontics: Current perspective and future di- rections. Int J Oral and Maxillofac Implants 2000;15(1):66-75.
21. Roberts WE, Smith RK, Zilberman Y, Mozsar PG, Smith RS. Osseous adaptation to continuous load- ing of rigid endosseous implants. Am J Orthod 1984;86(2):95-111.
22. Carr AB, Garard DA, Larsen PE. The response of bone in primates around unloaded dental im- plants supporting prostheses with different levels of fit. J Prosthet Dent 1996;76(5):500-509.
23. Michaels GC, Carr AB, Larsen PE. Effect of pros- thetic superstructure accuracy on the osteointegrated implant bone interface. Oral Surg Oral Med Oral Pathol Oral Radio Endod 1997;83:198-205.
24. Jemt T, Book K. Prosthesis misfit and marginal bone loss in edentulous implant patients. Int J Oral Maxillofac Implants 1996;11(5):620-625.
25. Kallus T, Bessing C. Loose gold screws frequent- ly occur in full-arch fixed prostheses supported by osseointegrated implants after 5 year. Int J Oral Maxillofac Implants 1994;9:169-178.
26. Burguete RL, Johns RB, King T, Patterson EA.
Tightening characteristics for screwed joints in osseointegrated dental implants. J Prosthet Dent 1994;71:592-599.
27. Jemt T, Carlsson L, Boss A Jorneus L. In vivo load measurements on osseointegrated implants supporting fixed or removable prostheses: A com- parative pilot study. Int J Oral Maxllofac Implants 1991;6:413-417.
28. Klineberg I, Murray G. Design for superstruc- tures for osseointegrated implants. Swed Dent J 1985;28(suppl): 63-69.
29. Carlsson L. Built-in strain and untoward forces are the invitable companions of prosthetic misfit.
Nobelpharma News 1994;8(2):5.
30. Yanase RT, Binon PP, Jemt T, Gulbransen HJ, Parel S. How do you test a cast framework fit for a full-arch fixed implant-supported prosthe- sis?(Current Issues Forum). Int J Oral Maxillofac Implants 1994;9:469-474.
31. Loos L. A fixed prosthodontic technique for mandibular osseointegrated titanium implants.
J Prosthet Dent 1986;55:232-242.
32. Hollender L, Rockler B. Radiographic evaluation of osseointegrated implants of the jaws.
Experimental study of the influence of radi- ographic techniques on the measurement of the re- lation between implant and bone. Dentomaxillofac Radiol 1980;9:91-95.
33. Cox JF, Pharoah M. An alternative holder for ra- diographic evaluation of tissue-integrated prostheses.
J Prosthet Dent 1986;56:338-341.
34. Goll GE. Production of accurately fitting full-arch implant frameworks: Part I-clinical procedures. J Prosthet Dent 1991;66:377-384.
35. Tan KB, Rubenstein JE, Nicholls JI, Youdelis RH.
Three-dimensional analysis of the casting accuracy of one-piece, osseointegrated implant-retained prostheses. Int J Prosthodont 1993;6:346-363.
36. Mulcahy C, Sherriff; M, Walter JD, Fenlon MR.
Measurement of misfit at the implant-prosthesis in- terface: an experimental method using a coordinate measuring machine. Int J Oral Maxillofac Implants 2000;15:111-118.
37. Jemt T. Three dimensional distortion of gold alloy castings and welded titanium frameworks.
Measurements of the precision of fit between completed implant prostheses and the master casts in routine edentulous situations. J Oral Rehabil 1995;22:549-556.
38. Jemt T, Lie A. Accuracy of implant-supported prostheses in the edentulous jaw. Clin Oral Impl Res 1995;6:172-180.
39. Jemt T. In vivo measurements of precision of fit in- volving implant-supported prostheses in the eden- tulous jaw. Int J Oral Maxillofac Implants 1996;
11:151-158.
40. Lie A, Jemt T. Photogrammetric measurements of implant positions. Clin Oral Impl Res 1994;5:30-36.
41. Riedy SJ, Lang BR, Lang BE. Fit of implant frame- works fabricated by different techniques. J Prosthet Dent 1997;78(6):596-604.
42. Jemt T Rubenstein JE, Carlsson L, Lang BR.
Measuring fit at the implant prosthodontic inter- face J Prosthet Dent 1996;75:314-325.
43. Millington ND, Leung T. Inaccurate fit of implant superstructures. Part 1: Stresses generated on the superstructure relative to the size of fit discrepancy.
Int J Prosthodont 1995;8:511-516.
44. Meredith N, Friberg B Sennerby L, Aparicio C.
Relationship between contact time measurements and PTV values when using the periotest to mea- sure implant stability. Int J Prosthodont 1998;11:269- 275.
45. May KB, Edge MJ, Russell MM, Razzoog ME, Lang BR. The precision of fit at the implant prosthodontic interface J Prosthet Dent 1997;77:497- 502.
46. Truhlar TS, Lauciello F, Morris HF, Shigeru O. The influence of bone quality on Periotest values of en- dosseous dental implants at stage II surgery. J Orla Maxillofac Surg 1997;55:55-61.
47. Dehami K, Wolfaardt JF, Dent M, Faulkner G, Grace M. Assessment of the periotest device in base- line mobility measurements of craniofacial im- plants. Int J Oral Maxillofac Implants 1995;10:221- 229.
48. Huang HM, Pan LC, Lee SY, Chiu CL, Fan KH, Ho KN. Assessing the implant/bone interface by us- ing natural frequency analysis. Oral Surg Oral Med Oral Pathol Oral Radiol Endod. 2000 Sep;90(3):285-91.
49. Noyes DH, Solt CW. Relationship between tooth mobility and mechanical mobility of teeth. J Periodontol 1972;43(5):301-303.
50. Oka H, Yamamoto T, Saratani K, Kawazoe T.
Application of mechanical mobility of periodon- tal tissue to tooth mobility examination. Med Biol Eng Comput 1989;27:75-81.
51. Kaneko T. Pulsed oscillation technique for as- sessing the mechanical state of the dental im- plant-bone interface. Biomaterials 1991;12:555- 560.
52. Kaneko T, Nagai Y, Ogono M, Futami T, Ichimura T. Acoustoelectric technique for assessing the me- chanical state of the dental implant-bone interface.
J of Biomedical Materials Research 1986;20:169-176.
53. Elias JJ, Brunski JB, Scarton HA. A dynamic modal testing technique for noninvasive assessment of bone-dental implant interfaces. Int J Oral Maxillofac Implants 1996;11:728-734.
54. Meredith N, Alleyne D, Cawley P. Quantitative de- termination of the stability of the implant-tissue in- terface using resonance frequency analysis. Clin Oral Implant Res 1996;7:261-267.
55. Thomson WT. Theory of vibration with applications.
Prentice Hall, Upper Saddle River, New Jersey.
56. Lee SY, Huang HM, Lin CY, Shin YH. In vivo and in vitro natural frequency analysis of peri- odontal conditions: an innovative method. J Periodontol 2000;71:632-640.
57. Rieger MR, Fareed K, Adams WK, Tanquist RA.
Bone stress distribution for three endosseous im- plants. J Prosthet Dent 1989;61:223-228.
58. Stegaroiu R, Sato T, Kusakari H, Miyakawa O.
Influence of restoration type on stress distribution in bone around implant: A three-dimensional finite element analysis. Int J Orla Maxillofac Implants 1998;13:82-90.
59. Barbier L, Sloten JV, Krezesinski G, Schepers E, Perre G. Finite element analysis of non-axial versus ax- ial loading of oral implants in the mandible of the dog. Journal of Oral Rehabilitation 1998;25:847- 858.
60. Williams KR, Williams ADC. Impulse response of a dental implant in bone by numerical analysis.
Biomaterials 1997;18:715-719.
61. Ewins DJ. Modal testing: Theory and practice.
Research studies press, England.
62. Patra AK, DePaolo JM, D’Souza KS, DeTolla D, Meenaghan MA. Guidelines for analysis and re- design of dental implants. Implant Dentistry 1998;7(4):355-368.
63. Li J, Alatli-Kut I, Hermansson L. High-strength den- tal gypsum prepared by cold isostatic pressing.
Biomaterials 1993;14:1186-1187.
64. Oilo G, Gjerdet NR. Dental casting alloys with a low content of noble metals:Physical properties. Acta.
Odontol. Scand. 1983;41(2):111-116.
65. Craig RG, Peyton FA, Johnson DW. Compressive properties of enamel, dental cements, and gold. J Dent. Res. 1961;40 (5):936-945.
66. Combe EC, Smith DC. Some properties of gypsum plasters. Brit Dent J 1964;117(6):237-245.
67. Anusavice KJ, Hojjatie B, Dehoff PH. Influence of metal thickness on stress distribution in metal-ce-
ramic crowns. J Dent Res 1986;65:1173-1178.
68. Lowet G, Dayuan X, Van der Perre G. Study of the vibrational behaviour of a healing tibia using finite element modeling. J Biomech 1996;29:1003-1010.
69. Silva J, Maia N. Modal analysis and testing. Kluwer Academic Publishers, Netherlands.
70. Jurist JM. In vivo determination of the elastic re- sponse of bone-I. Method of ulnar resonant fre- quency determination. Phy. Med. Bio. 1970;15:417- 426.
71. Van der Perre G, and Cornelissen PH. On the mechanical resonances of a human tibia in vitro. J Biomech 1983;16:549-552.
72. Cornelissen P, Cornelissen M, Van der Perre G, Christensen AB, Ammitzboll F, Dyrbye C.
Assessment of tibial stiffness by vibration test- ing in situ-Ⅱ. Influence of soft tissues, joints and fibula. J Biomech 1986;19:551-561.
73. Cornelissen M, Cormelissen P, Van der Perre G, Christensen AB, Ammitzboll F, Dyrbye C.
Assessment of tibial stiffness by vibration test- ing in situ-Ⅲ. Sensitivity of different modes and in- terpretation of vibration measurements. J Biomechanics. 1987; 20:333 -342.
74. Hight TK, Piziali RL, Nagel DA. Natural fre- quency analysis of a human tibia. J Biomechanics 1980;13:139-147.
75. Smith JD. Vibration measurement and analysis. Buer worths Borough green, Sevenoaks Kent TN158PH, England.
76. Oazaki M, Fukumoto M, Takahashi J. Damped os- cillation analysis of natural and artificial peri- odontal membranes. Annals of Biomedical Engineering. 1996;24:234-240.
77. Nokes LDM. The use of low-frequency vibration measurement in orthopaedics. Proc. Int. Mech.
Eng 1999;213:271-290.
78. Hwang HM, Yeh CY, Lee SY, Wang MS, Pan LC, Chem CC. Factors influencing the dynamic be- haviour of human teeth. Med. Bio. Eng. Compu.
2001;39:176-181.
79. Kitazaki S, Griffin MJ. A data correction method for surface measurement of vibration on the human body. J Biomech 1995;25:885-890.
Reprint request to:
DR.HO-BEOMKWON
DEPT. OFPROSTHODONTICS, COLLEGE OF DENTISITY, SEOUL NATIONAL UNIV.
28-1 YEONGUN-DONG, CHONGNO-GU, 110-749, SEOUL KOREA Tel:+82-2-760-2661, Fax:+82-2-760-3860 E-mail: [email protected]