Received for review: September 7, 2009; Accepted for publication: September 23, 2009
Corresponding Author: Hyejung Chang, Department of Health Services Management, School of Business Administration, Kyung Hee University, 1, Hoegi-dong Dongdaemoon-gu, Seoul 130-701, Korea
Tel: +82-2-961-9432, Fax: +82-2-961-0515, E-mail: [email protected]
This work was supported by the Korea Research Foundation Grant funded by the Korean Government (KRF-2006-321-B00414).
DOI:10.4258/jksmi.2009.15.3.265
Application of the Extended Technology Acceptance Model to Picture Archiving and Communication Systems in Dental Hospitals
Hyejung Chang
Dept. of Health Services Management, School of Business Administration, Kyung Hee Univ.
Abstract
Objective: With the rapid growth of picture archiving and communication systems (PACS) in the healthcare industry, this article describes the users’ satisfaction with PACS by employing functional PACS features and the two concepts of perceived ease-of-use (PEOU) and perceived usefulness (PU), based on the extended technology acceptance model (TAM). Methods: A cross-sectional survey was conducted with dentists in 25 dental hospitals which were cluster sampled from the national registry of 132 dental hospitals. Of the 204 respondents (response rate 81.6%), the data of 159 PACS users were analyzed using the structural equation modeling method. Results: The fitted model showed significant relations between the technical components and the TAM variables, via the following three significant paths: hardware to PEOU, and software to PEOU and also to PU. Moreover, the critical path of TAM variables was observed: PEOU→PU→SAT. Therefore, the model produced three significant routes: hardware→PEOU→PU→SAT, software→PU→SAT, and software→PEOU→PU→SAT. Conclusion:
Contrary to expectations, the direct effect of PEOU on user satisfaction was not significant. The final model provided critical paths from technical components to user satisfaction, by utilizing PEOU and PU as intermediary, latent factors. (Journal of Korean Society of Medical Informatics 15-3, 265-272, 2009)
Key words: Picture Archiving and Communication Systems, Radiology Information Systems, Satisfaction, Computer Hardware, Computer Software
Original Article
I. Introduction
With recent advances in information technology and the medical imaging data explosion from radiologic mo- dalities such as X-Ray, Computed Tomography (CT), Magnetic Resonance Imaging (MRI), and ultrasound studies, the Picture archiving and communication sys- tems (PACS) industry has grown rapidly. For example, according the 2005 HIMSS Annual Report of the US Hospital IT Market, approximately one-third of all U.S.
hospitals install radiology PACS, and another one-third of hospitals plan to adopt PACS1). Later, the 2007 HIMSS Report shows that the radiology-PACS environ- ment is showing good growth for most modalities, and the market has been and will continue to be impacted through 2009 by increased demand and ongoing market consolidation2).
On the other hand, in South Korea, almost all the large hospitals and university hospitals are operating filmless, and increasing demand from smaller hospitals accelerates more PACS purchase: 47.1% of all health- care institutions3) and 40% of dental hospitals4) adopt PACS in 2005. Furthermore, governmental support as well as strong healthcare IT initiatives have made South Korea the most flourishing market for PACS.
PACS encompasses a broad range of technologies and consists of four major components at its most fund- amental level: (1) image acquisition devices, (2) display workstations, (3) storage systems, and (4) computer network5). Since computers, commonly servers, are dedi- cated to the storage, retrieval, distribution, and presen- tation of images, it is not necessary to manually file, retrieve, or transport film jackets. Electronic images and reports are transmitted digitally via PACS, thus the increased portability of digital images and related re- ports provide a cost efficient and user-friendly environ- ment to patients as well as hospital employees.
Therefore, many healthcare institutions install PACS as an efficient and effective way to reduce the steps in clinical practices and improve their productivity and
quality. Although the immediate benefits of changing from a film-based system to the digital PACS might be only the removal of film storage and its related ex- penses, and decreased times in receiving results and reports, a PACS system provides a broad range of cli- nical, financial, and operational benefits in the long run.
Despite the rapid spread of PACS and its expected benefits, existing studies rarely present user’s attitude or perception to the newly adopted PACS. In particular, the effect of the technical or functional side of the system on users’ attitude should be explicitly consi- dered. Therefore, this study explores hardware and soft- ware factors affecting users’ satisfaction to PACS from the users’ perspective, in order to provide solutions for better operations. To fulfill this purpose, this study em- ployed the Technology Acceptance Model (TAM)6-9), and extended the basic model to study key technical features of the PACS system.
Based on the Fishbein and Ajzen’s Theory of Rea- soned Action (TRA) explaining the pattern of voluntary usage at an individual level10)11), TAM includes ‘Per- ceived Usefulness (PU)’ and ‘Perceived Ease-Of-Use (PEOU)’ in the model: PU is defined as ‘the degree to which a person believes that using a particular system would enhance his or her job performance,’ while PEOU is defined as ‘the degree to which a person believes that using a particular system would be free of effort’6). PU and PEOU create belief among users and subsequently form their attitude.
In addition, users’ attitude and perception may be affected by exogenous variables such as system features and characteristics7)11). In this regard, Davis stated that the future research should consider the role of external factors in TAM. He also asserted that identifying ex- ogenous variables in TAM can increase explanatory power7)11). Along this line, there has been a wide va- riety of exogenous variables tried in existing studies.
However, few studies employ technical features or func- tional attributes of information systems as exogenous variables since those factors vary with specific infor-
Figure 1. Research model.
Variable Classification Frequency
(person) Percent (%)
Total 159 100.00
Age Mean (range) 29.4 (24-61)
20-29 114 72.15
30-39 32 20.25
40-49 11 6.96
50+ 1 0.63
Gender Male 84 53.50
Female 73 46.50
Specialty Maxillofacial surgery 17 12.41
Prosthodontics 28 20.44
Orthodontists 39 28.47
Pediatric 15 10.95
Periodontology 10 7.30
Restorative dentistry 18 13.14
Oral medicine 5 3.65
Oral and maxillofacial radiology 4 2.92
Oral pathology 1 0.73
Grade Intern 33 22.00
Resident 95 63.33
Specialist 22 14.66
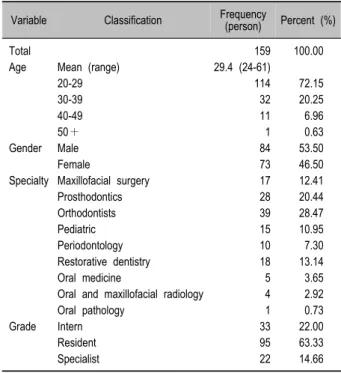
Table 1. Respondents’ characteristics mation technology and information systems. We believe
that in some specific cases (as in our research subject, PACS), system-specific functional elements like hard- ware and software components of the system should to be considered.
As a summary, this paper intended to describe users’
satisfaction to PACS, employing two concepts of Per- ceived Ease-of-Use (PEOU) and Perceived Usefulness (PU) based on the Technology Acceptance Model (TAM). Moreover, the extended TAM model includes technical key features of the PACS system as exo- genous variables to increase explanatory power. Through this process, we expect to identify the most significant technical features of the PACS system for continued growth and user satisfaction.
II. Materials and Methods
1. Research model
The research model is developed to derive the ex- ogenous variables affecting user satisfaction of the PACS system, based on the extended version of Davis’
TAM. Throughout this model, we expect to compre- hensively understand the key technical features of the PACS system, which play an important role in user satisfaction. As shown in Figure 1, the research model assumes that exogenous variables satisfy PACS users only through the intermediary variables like PEOU and PU. Under this fundamental assumption of TAM, we examine which paths are more critical for user satisfac- tion. For example, users may get to use PACS only through PU, while some exogenous variables affect not only PU, but also PEOU. As for the exogenous factors,
five hardware and four software components of the PACS system are considered.
According to the basic model, the hypotheses are classified into two groups: (1) hypotheses for the rela- tions between the exogenous variables and the TAM variables and (2) hypotheses for the relations between the TAM variables as in the original TAM framework.
Explicitly, exogenous factors including hardware and software components will positively affect both PU and PEOU. And PEOU will positively affect PU, and en- hanced PU and PEOU will increase user satisfaction.
2. Subject
A cross-sectional survey was conducted to dentists in 25 dental hospitals during May 25 through June 4, 2007 in South Korea. The 25 hospitals were selected from the national hospital registry with 132 dental hospitals using the cluster sampling method. The target sample size was 250; an average of 10 responses per hospital.
Out of the 250 dentists who received the survey questionnaire, 204 participated in the survey, repre-
Category Latent construct Measurement items (number of items) Cronbach α
Raw Standardized
Technical features
TAM perceptions
Hardware
Software
PUPEOU SAT
Image modalities (9) Display (6) Database (5) Network (5) Output (2) Retrieval (8)
Image quality of each modality (4) Diagnostic support (6)
Image manipulation (14) Perceived usefulness (5) Perceived ease-of-use (5) User satisfaction (4)
0.771 0.871 0.736 0.781 0.741 0.907 0.772 0.788 0.896 0.915 0.908 0.908
0.780 0.871 0.742 0.791 0.749 0.907 0.771 0.795 0.904 0.916 0.908 0.909
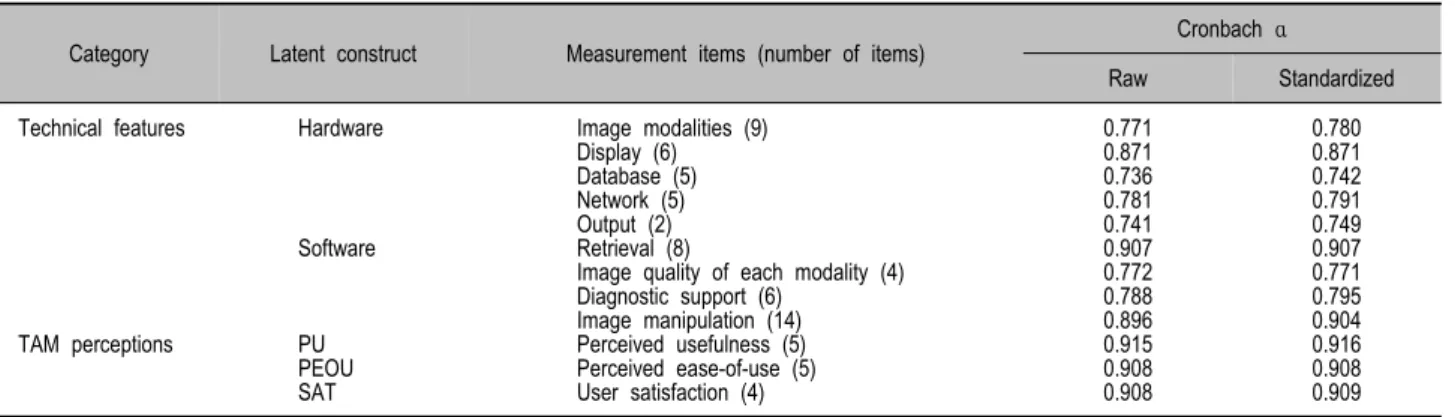
Table 2. Reliability check
senting 81.6% of response rate. Excluding the non-users of PACS, the responses of 159 were used in the final analyses.
Table 1 summarizes the demographic characteristics of the 159 respondents, of which both males and fe- males were almost equally represented. Broken down into age groups, respondents in their 20s formed the largest group (72.2%), and those aged 30-39 account for 20.3%, and above 40 for 7.6%. Broken down by specialty area, orthodontists account for 28.5%, prostho- dontics for 20.4%, restorative dentistry for 13.1%, and maxillofacial surgery for 12.4%, while pediatric, perio- dontology, oral medicine, etc. represent the remaining proportion. By professional grade, residents account for 63.3%, interns account for 22.0%, and specialists ac- count for only 14.7%.
3. Instrument
The survey included a broad spectrum of measure- ment items on users’ experience of the PACS system.
The survey was accompanied by a cover letter des- cribing the study purpose and assuring the anonymity and privacy of the respondents. The questions are cate- gorized into three groups: (1) questions on functional elements of technical features in the PACS system, (2) questions to assess PEOU, PU, and the level of satis- faction with using the system, and (3) demographic ques- tions. Answers to these questions are marked on a
seven-point Likert scale (1: strongly disagree, 7:
strongly agree) to represent the degree of perception or satisfaction. More explicitly, question items for the exo- genous variables in the extended TAM include 27 measurement items for five hardware components and 32 items for four software components. PEOU and PU are measured by five items each, and the user satis- faction is measured by four items.
The reliability tests for the scales were performed using Cronbach alpha coefficients, which measure in- ternal consistency over measurement items of the scale.
Cronhach’s alpha value of 0.7 or above is deemed to be reliable by convention. As shown in Table 2, the alpha coefficients for the hardware components ranged from 0.74 to 0.87, and those for the software components ranged from 0.77 to 0.91. The alpha coefficients for PEOU, PU, and satisfaction were 0.91, 0.92, and 0.91, respectively, which confirms the scales reliable.
4. Data analysis methods
We analyzed the data using the two-step approach of the structural equation model suggested by Anderson and Gerbing (1988)12). A structural equation model con- sists of two models: a measurement model and a struc- tural model. While the measurement model shows the relations between measurement variables and latent fac- tors, the structural model presents the relations among latent factors. For the two models, confirmatory factor
Figure 2. Preliminary structural equation model. The solid lines in the figure are statistically analyses were applied to check the validity of the mea-
surement model, and then the structural equation model- ing methods were followed to see the statistical signi- ficance of the various relations among latent factors and also between latent factors and measurement variables in the overall model.
In particular, we test a preliminary structural equation model specifying all the relationships among the con- ceptual factors and examine the significance of each relationship. Then we try to modify the preliminary mo- del so that we can determine the best fit model in terms of statistical significance in parameter estimation. Both confirmatory factor analysis and structural equation ana- lysis are carried out using PROC CALIS to estimate model parameters and test the goodness-of-fit of the model. All statistical analyses were conducted using the SAS statistical package (Version 9.1).
Satisfactory fit statistics are also provided and com- pared with ones in the preliminary model. The overall fit of the structural models is assessed in terms of the following six goodness-of-fit indices: degree of freedom, Goodness of Fit Index (GFI), Root Mean-square Resi- dual (RMR), Bentler’s Comparative Fit Index (CFI), Bentler & Bonett’s Non-Normalized Fit Index (NNFI), and Bentler & Bonett’s Normalized Fit Index (NFI).
The significance of these statistics is tested based on the Chi-square distribution with an appropriate degree of freedom. For other indices, the recommended thre- sholds of ‘good-fit’ are as follows: greater than or equal to 0.85 for GFI, CFI, NNFI, and NFI; less than or
equal to 0.05 for RMR.
III. Results
1. Preliminary structural equation model
Figure 2 shows the test results from the structural equation analysis of the preliminary model, which tests hypotheses on the relations between the PACS technical components and the TAM perception variables (PEOU and PU) and the relations between the perception variables and user satisfaction. On the figure, the num- bers beside the arrow lines are the corresponding path coefficients, representing the effect size of the path between two variables or factors. After testing good- ness-of-fit of a model to data, the model is interpreted using significant path coefficients in the model.
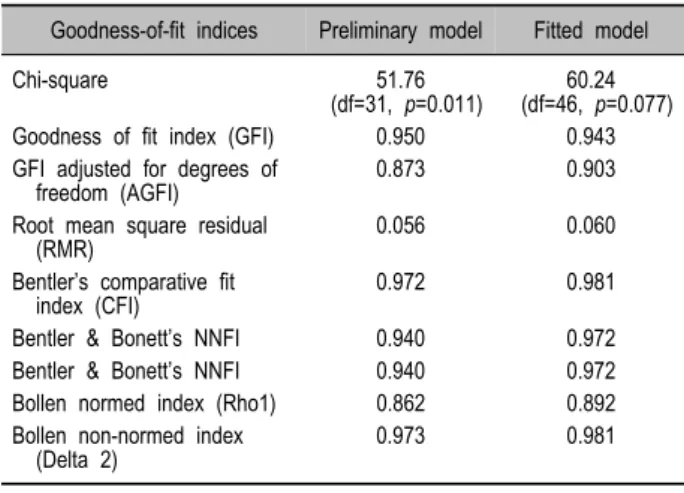
The preliminary model was valid because all the indices were within the acceptable ranges recommended in most literature, as shown in Table 3. Explicitly, Chi- square statistic was 51.76 with p value of 0.01, Good- ness of Fit Index (GFI) was 0.895, Root Mean Square Residual (RMR) was 0.056, and Comparative Fit Index (CFI) was 0.972, etc.
Although the model fit was acceptable, many rela- tions in the model turned out to be insignificant at the significance level of 0.05, which were depicted in dotted lines in Figure 2. Insignificant paths imply that some hypotheses are rejected. In particular, all the paths in the measurement model were significant, but no
Goodness-of-fit indices Preliminary model Fitted model
Chi-square 51.76
(df=31, p=0.011) 60.24 (df=46, p=0.077)
Goodness of fit index (GFI) 0.950 0.943
GFI adjusted for degrees of
freedom (AGFI) 0.873 0.903
Root mean square residual
(RMR) 0.056 0.060
Bentler’s comparative fit
index (CFI) 0.972 0.981
Bentler & Bonett’s NNFI 0.940 0.972
Bentler & Bonett’s NNFI 0.940 0.972
Bollen normed index (Rho1) 0.862 0.892
Bollen non-normed index
(Delta 2) 0.973 0.981
Table 3. Comparison of goodness-of-fit statistics: preliminary vs. fitted
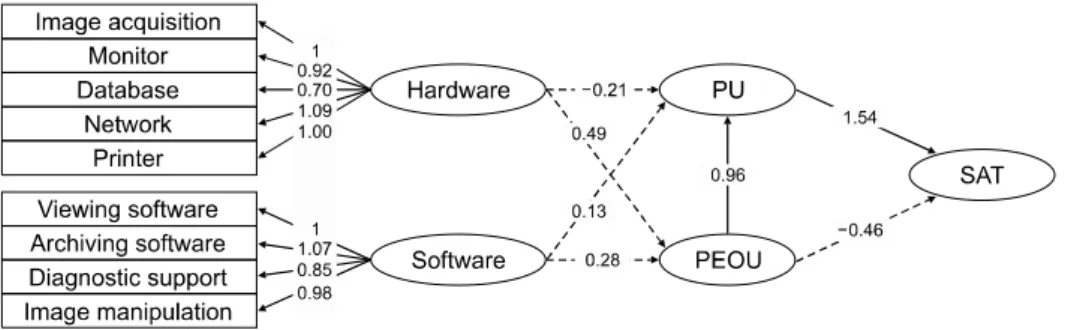
Figure 3. Fitted structural equation model. The solid lines in the figure are statistically significant at α=0.05.
paths for the relations between the technical component variables and the two TAM variables were significant, resulting in the hypotheses in the first hypothesis group being rejected. Regarding the second group of hypo- theses for the relations between the TAM variables and user satisfaction, no significant relation between PEOU and user satisfaction was observed, and PEOU indirectly influenced user satisfaction through PU as an inter- mediary variable. Subsequently, one critical path, PEOU
→ PU → user satisfaction, is derived.
2. Fitted structural equation model
From the preliminary structural equation model, va- riations of the model were tested by dropping the most
insignificant path step by step, in order to determine the best fitted model. The fitted structural equation model was considered in terms of statistical performance, which includes good model fit and all significant paths.
Figure 3 represents a revised model without dotted lines, and the goodness-of-fit of the model is compared to that of the preliminary model in Table 3. Despite both preliminary and fitted models showed good fit, the fitted model performed even better than the preliminary model in most indices.
The model outcomes were also different in signifi- cance of paths. In particular, the first hypothesis group, testing the relations between the technical component variables and the two TAM variables, became signifi- cant in the fitted model. Therefore, the model included three more paths of hardware to PEOU, software to PEOU and also PU. Accordingly, the fitted model provided more critical paths to user satisfaction, which include routes utilizing PEOU and PU as media con- necting exogenous factors with user satisfaction: hard- ware → PEOU → PU → SAT, software → PU → SAT, and software → PEOU → PU → SAT. However, the hypothesis regarding the direct effect of PEOU on user satisfaction was still not accepted in the fitted model.
IV. Discussion
TAM has been successfully used in many studies to explain acceptance and use of information systems. Al-
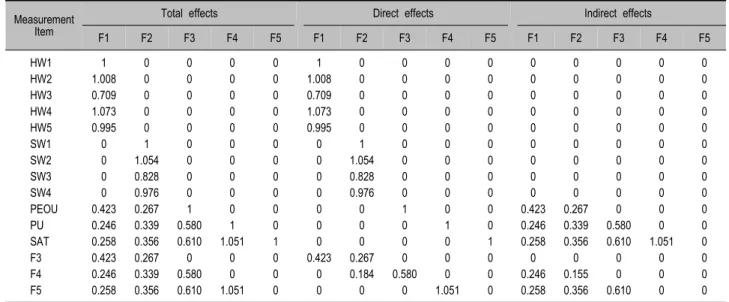
Measurement Item
Total effects Direct effects Indirect effects
F1 F2 F3 F4 F5 F1 F2 F3 F4 F5 F1 F2 F3 F4 F5
HW1 1 0 0 0 0 1 0 0 0 0 0 0 0 0 0
HW2 1.008 0 0 0 0 1.008 0 0 0 0 0 0 0 0 0
HW3 0.709 0 0 0 0 0.709 0 0 0 0 0 0 0 0 0
HW4 1.073 0 0 0 0 1.073 0 0 0 0 0 0 0 0 0
HW5 0.995 0 0 0 0 0.995 0 0 0 0 0 0 0 0 0
SW1 0 1 0 0 0 0 1 0 0 0 0 0 0 0 0
SW2 0 1.054 0 0 0 0 1.054 0 0 0 0 0 0 0 0
SW3 0 0.828 0 0 0 0 0.828 0 0 0 0 0 0 0 0
SW4 0 0.976 0 0 0 0 0.976 0 0 0 0 0 0 0 0
PEOU 0.423 0.267 1 0 0 0 0 1 0 0 0.423 0.267 0 0 0
PU 0.246 0.339 0.580 1 0 0 0 0 1 0 0.246 0.339 0.580 0 0
SAT 0.258 0.356 0.610 1.051 1 0 0 0 0 1 0.258 0.356 0.610 1.051 0
F3 0.423 0.267 0 0 0 0.423 0.267 0 0 0 0 0 0 0 0
F4 0.246 0.339 0.580 0 0 0 0.184 0.580 0 0 0.246 0.155 0 0 0
F5 0.258 0.356 0.610 1.051 0 0 0 0 1.051 0 0.258 0.356 0.610 0 0
F1: hardware, F2: software, F3: PEOU, F4: PU, F5: SAT, PU: perceived usefulness, PEOU: perceived ease of use, SAT: user satisfaction
Table 4. Direct, indirect, and total effects of latent constructs on measurement items and other latent constructs though various research activities have been conducted
around TAM, it has been rarely employed in health- related research areas. Especially, only few studies are found in Medical Informatics13-17). In particular, this study tried to describe users’ satisfaction to PACS, em- ploying technical components of PACS and two TAM perception variables.
Using the extended TAM and a series of multivariate statistical analyses, this study could generate the fol- lowing results. Hardware and software components as exogenous variables were found to have significant effects on PU and PEOU, directly or indirectly. Among the original TAM variables, only PU had a significant effect on user satisfaction. Even though PEOU was found not to have a significant effect on user satis- faction, it turned out to have an indirect effect on user satisfaction through PU.
The result that the hypothesis regarding the direct effect of PEOU on user satisfaction fails to be accepted seems to be somehow contrary to typical outcomes from TAM studies. This dissimilarity may be from the unique nature of each information system. Contrary to the commercial information systems, information system in healthcare industry might be recognized as a service
instrument. Subsequently, PACS users put much more stress on usefulness rather than convenience of use.
This interpretation about the PEOU → PU → SAT path was also supported by the previous TAM research on health information websites13).
The above assertion also seems to be substantiated by statistical interpretation. For example, in the fitted mo- del (Fig. 3), the total effects of PEOU and PU on user satisfaction are measured at 0.610 and 1.051, respec- tively (Table 4). While the effect of PEOU on user satisfaction is indirect only, the effect of PU is direct.
As a summary, this study viewed dentists as users of a special type of information system (that is, PACS in dental hospitals) and analyzed the interrelationships among the exogenous variables, users’ perception of PACS use, and users’ satisfaction to the system. An extended TAM was constructed because key functional characteristics of PACS were expected to have a close connection to perceived variables such as PU and PEOU.
We also verified how significant the extended TAM model is in explaining user satisfaction on the PACS.
As PEOU has a strong effect on PU, careful consi- deration should also be given to developing systematic ways of improving information quality and system
design performance that turn out to have an overall in- fluence upon user satisfaction. Furthermore, this study helped increasing the explanatory power of TAM and show how the impacts of the system characteristics on the pattern of technology acceptance vary with service application areas.
REFERENCES
1. Available at: http://www.himss.org/DorenfestInstitute/
docs/HimssAnalyticsAnnualReport.pdf. Accessed July 27, 2009.
2. Available at: http://www.himss.org/foundation/docs/
2007Annual Report.pdf. Accessed July 27, 2009.
3. Wang KH. Survey on hospital information systems and their influencing factors in Korea [MPH thesis]. Seoul (Korea):Yonsei University; 2005. pp.1-68.
4. Park KH. Study of domestic dental hospital and clinic's Information system usage state and future govern- mental policy [MPH thesis]. Seoul (Korea):Yonsei University;2005. pp.1-121.
5. Dreyer KJ, Mehta A, Thrall JH. PACS: a guide to the digital revolution. New York (NY):Springer-Verlag;
2002. pp.4-5.
6. Davis FD. Perceived usefulness, perceived ease of use, and user acceptance of information technology. MIS Q 1989;13(3):318-340.
7 Davis FD. User acceptance of information technology:
system characteristics, user perceptions and behavioral impacts. Int J Man Mach Stud 1993;38(3):475-487.
8. Davis FD, Bagozzi RP, Warshaw PR. User acceptance of computer technology: a comparison of two theore-
tical models. Manage Sci 1989;35(8):982-1003.
9. Davis FD, Venkatesh V. A critical assessment of potential measurement biases in the technology ac- ceptance model: three experiments. Int J Man Mach Stud 1996;45(1):19-46.
10. Fishbein M, Ajzen I. Belief, Attitude, Intention and Behavior: an Introduction to Theory and Research.
Reading (MA):Addison-Wesley;1975. pp.311-315.
11. Venkatesh A, Davis FD. A model of the antecedents of perceived ease of use: development and test. Decis Sci 1996;27(3):451-481.
12. Anderson JC, Gerbing DW. Structural equation mo- deling in practice: a review and recommended two-step approach. Psychol Bull 1988;103(3):411-423.
13. Kim D, Chang H. Key functional characteristics in designing and operating health information websites for user satisfaction: an application of the extended technology acceptance model. Int J Med Inform 2007;
76(12):790-800.
14. Chang P, Hsu YS, Tzeng YM, Sang YY, Hou IC, Kao WF. The development of intelligent, triage-based, mass-gathering emergency medical service PDA sup- port systems. J Nurs Res 2004;12(3):227-236.
15. Chang P, Hsu YS, Tzeng YM, Hou IC, Sang YY.
Development and pilot evaluation of user acceptance of advanced mass-gathering emergency medical services PDA support systems. Medinfo 2004;11(2):1421-1425.
16. Barker DJ, van Schaik P, Simpson DS, Corbett WA.
Evaluating a spoken dialogue system for recording clinical observations during an endoscopic examina- tion. Med Inform Internet Med 2003;28(2):85-97.
17. Chismar WG, Wiley-Patton S. Test of the technology acceptance model for the internet in pediatrics. San Antonio (Texas): Proc AMIA Symp; 2002. 155-159.