ISSUES TO ADDRESS...
• Transforming one phase into another takes time.
• How does the rate of transformation depend on time and temperature ?
• Is it possible to slow down transformations so that non-equilibrium structures are formed?
• Are the mechanical properties of non-equilibrium structures more desirable than equilibrium ones?
Fe γ
(Austenite)
Eutectoid transformation
C FCC
Fe3C
(cementite)
α
(ferrite)
+
(BCC)
Chapter 12: Phase Transformations
Phase Transformations
Nucleation
– nuclei (seeds) act as templates on which crystals grow
– for nucleus to form rate of addition of atoms to nucleus must be faster than rate of loss
– once nucleated, growth proceeds until equilibrium is attained Driving force to nucleate increases as we increase ΔT
– supercooling (eutectic, eutectoid) – superheating (peritectic)
Small supercooling slow nucleation rate - few nuclei - large crystals
Large supercooling rapid nucleation rate - many nuclei - small crystals
Solidification: Nucleation Types
• Homogeneous nucleation
– nuclei form in the bulk of liquid metal – requires considerable supercooling
(typically 80-300 °C)
• Heterogeneous nucleation
– much easier since stable “nucleating surface” is already present — e.g., mold wall, impurities in liquid phase
– only very slight supercooling (0.1-10 °C)
r* = critical nucleus: for r < r* nuclei shrink; for r > r* nuclei grow (to reduce energy)
Homogeneous Nucleation & Energy Effects
ΔGT = Total Free Energy
= ΔGS + ΔGV
Surface Free Energy- destabilizes the nuclei (it takes energy to make an interface)
γ = surface tension
Volume (Bulk) Free Energy –
stabilizes the nuclei (releases energy)
2 v
* 3
v
*
2 v
3
G 3 G 16
G r 2
0 r
dr 4 G 1
3 r 4 dr
1 dr
G d
2 2 v
2 m 3 2
v
* 3
v m v
*
m v m
m v m
v v
v v
v
T H 3
T 16
G 3 G 16
T H
T 2 G
r 2
T T H T
T T
H T
T H H
S T H
G
Solidification
Note: ΔH
fand γ are weakly dependent on ΔT
r* decreases as ΔT increases For typical ΔT r* ~ 10 nm
ΔHf = latent heat of solidification Tm = melting temperature
γ = surface free energy
ΔT = Tm - T = supercooling r* = critical radius
2 2
2 3 2
3
*
3 16 3
16
T H
T G G
v
m
v
T H
T 2 G
r 2
v m v
*
Nucleation Kinetics
d
Heterogeneous Nucleation
) ( S G
G
G 3 G 16
G r 2
cos
* o hom
* hetero
2 v
3
* SL hetero
V
* SL
SL SI
IL
Rate of Phase Transformations
Kinetics - study of reaction rates of phase transformations
• To determine reaction rate – measure degree of transformation as function of time (while
holding temp constant)
measure propagation of sound waves – on single specimen
electrical conductivity measurements – on single specimen
X-ray diffraction – many specimens required
How is degree of transformation measured?
Rate of Phase Transformation
Jonson-Mehl-Avrami (JMA) equation => x = 1- exp (-kt
n) K: reaction rate constant
n : Avrami exponent
transformation complete
log t
Fraction transformed, x
Fixed T
fraction
transformed
time 0.5
By convention rate = 1 / t
0.5Fig. 12.10, Callister &
Rethwisch 9e.
maximum rate reached – now amount unconverted decreases so rate slows t0.5
rate increases as interfacial surface area increases & nuclei grow
Rate of Phase Transformation
The kinetics of recrystallization for some alloys obey the JMA equation and the Avrami exponent, n, is 3.1. If the fraction of recrystallized is 0.3 after 20 min, determine the rate of recrystallization.
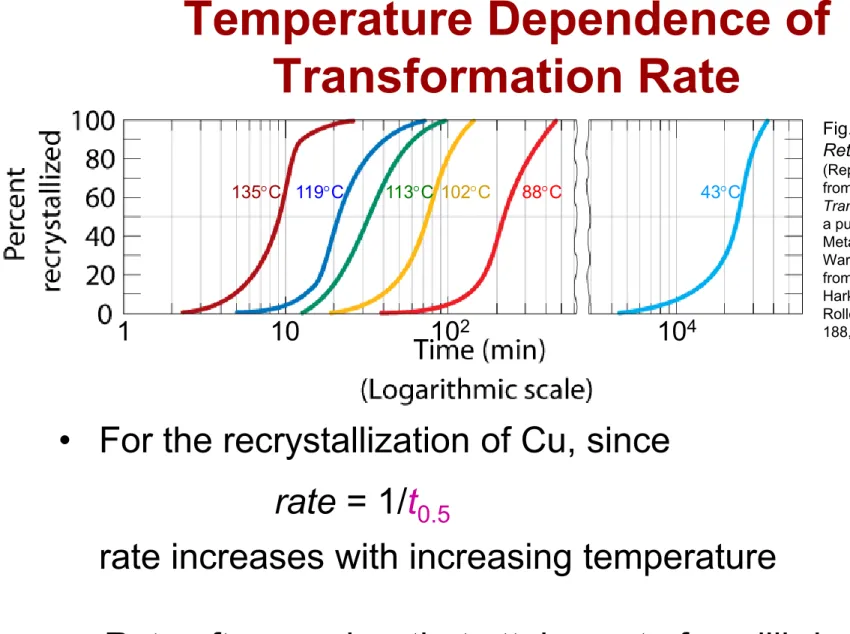
Temperature Dependence of Transformation Rate
• For the recrystallization of Cu, since rate = 1/t
0.5rate increases with increasing temperature
• Rate often so slow that attainment of equilibrium state not possible!
Fig. 12.11, Callister &
Rethwisch 9e.
(Reprinted with permission from Metallurgical
Transactions, Vol. 188, 1950, a publication of The
Metallurgical Society of AIME, Warrendale, PA. Adapted from B. F. Decker and D.
Harker, “Recrystallization in Rolled Copper,” Trans. AIME, 188, 1950, p. 888.)
135C 119C 113C 102C 88C 43C
1 10 102 104
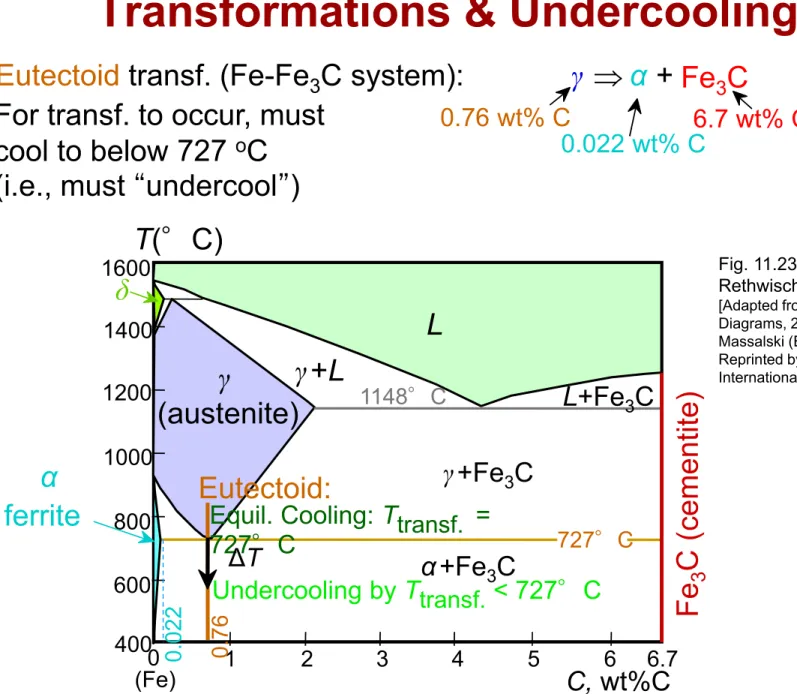
Transformations & Undercooling
•
For transf. to occur, must cool to below 727 oC(i.e., must “undercool”)
•
Eutectoid transf. (Fe-Fe3C system): γ α + Fe3C0.76 wt% C
0.022 wt% C6.7 wt% C
Fe 3C (cementite)
1600 1400 1200 1000 800
600
4000 1 2 3 4 5 6 6.7
L γ
(austenite) γ +L
γ +Fe3C α +Fe3C
L+Fe3C δ
(Fe) C, wt%C
1148°C
T(°C)
α ferrite
727°C
Eutectoid:
Equil. Cooling: Ttransf. = 727°CΔT
Undercooling by Ttransf. < 727°C
0.760.022
Fig. 11.23, Callister &
Rethwisch 9e.
[Adapted from Binary Alloy Phase Diagrams, 2nd edition, Vol. 1, T. B.
Massalski (Editor-in-Chief), 1990.
Reprinted by permission of ASM International, Materials Park, OH.]
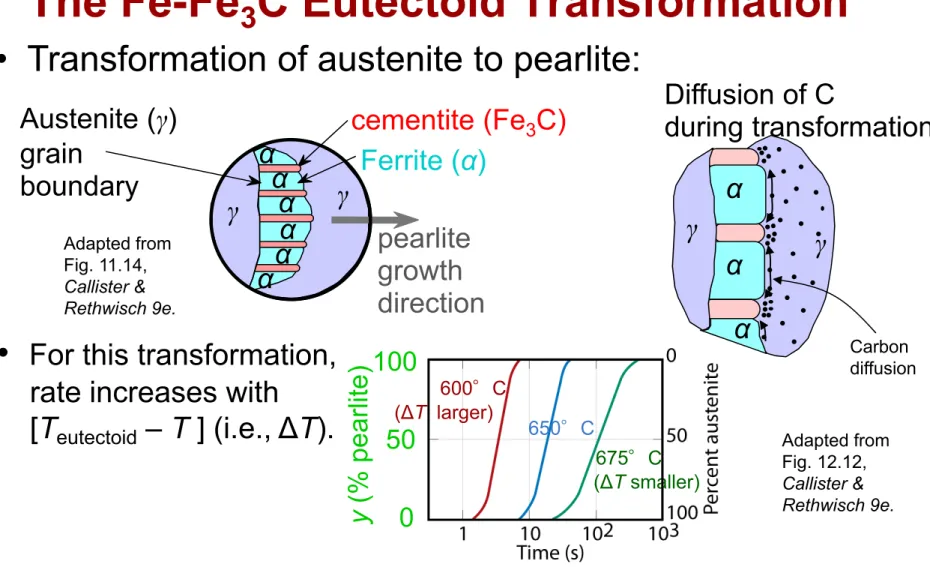
The Fe-Fe
3C Eutectoid Transformation
Coarse pearlite formed at higher temperatures – relatively soft Fine pearlite formed at lower temperatures – relatively hard
• Transformation of austenite to pearlite:
Adapted from Fig. 11.14, Callister &
Rethwisch 9e.
α γ αα αα
α
pearlite growth direction Austenite (γ)
grain
boundary
cementite (Fe3C) Ferrite (α)
γ
•
For this transformation, rate increases with[Teutectoid – T ] (i.e., ΔT). Adapted from
Fig. 12.12, Callister &
Rethwisch 9e.
675°C (ΔT smaller)
0 50
y(% pearlite)
600°C (ΔT larger)
650°C
100
Diffusion of C
during transformation
α α
γ γ
α Carbon
diffusion
Fig. 12.13, Callister & Rethwisch 9e.
[Adapted from H. Boyer (Editor), Atlas of Isothermal Transformation and Cooling Transformation Diagrams, 1977.
Reproduced by permission of ASM International, Materials Park, OH.]
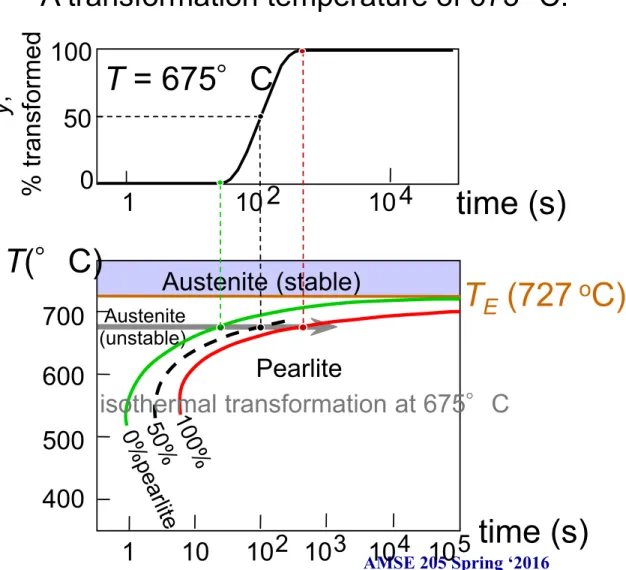
Generation of Isothermal Transformation Diagrams
• The Fe-Fe3C system, for C0 = 0.76 wt% C
• A transformation temperature of 675 ºC.
100 50
0 1 10 2 10 4
T = 675°C
y, % transformed
time (s)
400 500 600 700
Austenite (stable)
T
E(727
oC)
Austenite (unstable)
Pearlite
T(°C)
isothermal transformation at 675°C
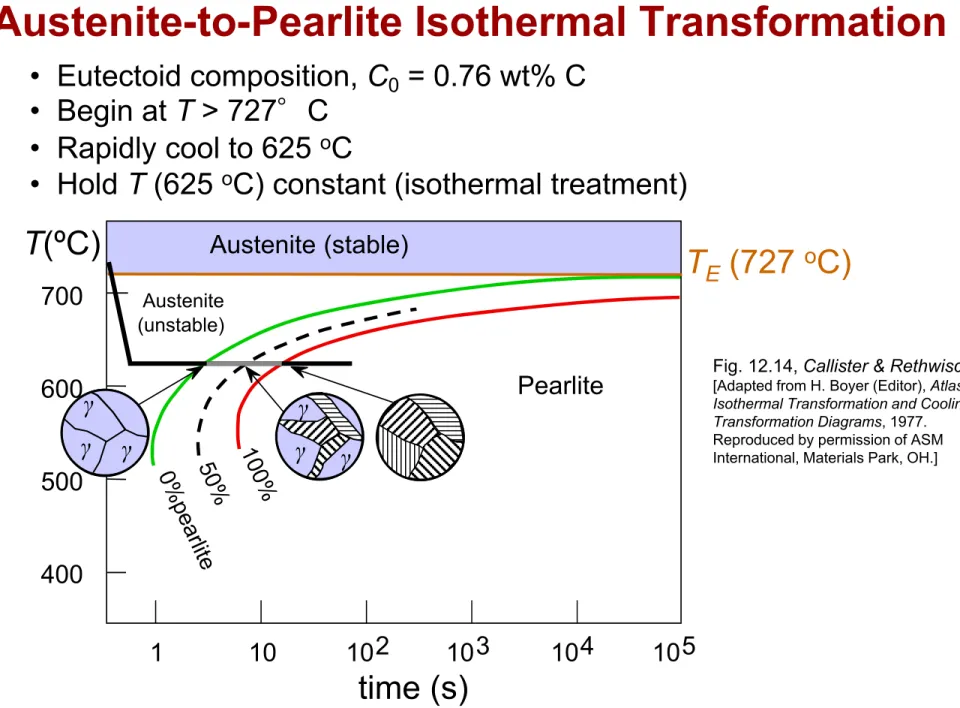
Consider:
• Eutectoid composition, C0 = 0.76 wt% C
• Begin at T > 727°C
• Rapidly cool to 625 oC
• Hold T (625 oC) constant (isothermal treatment)
Fig. 12.14, Callister & Rethwisch 9e.
[Adapted from H. Boyer (Editor), Atlas of Isothermal Transformation and Cooling Transformation Diagrams, 1977.
Reproduced by permission of ASM International, Materials Park, OH.]
Austenite-to-Pearlite Isothermal Transformation
400 500 600 700
Austenite (stable)
T
E(727
oC)
Austenite (unstable)
Pearlite
T(ºC)
1 10 102 103 104 105
γ γ
γ
γ γ
γ
Fig. 11.23, Callister & Rethwisch 9e.
[Adapted from Binary Alloy Phase Diagrams, 2nd edition, Vol.
1, T. B. Massalski (Editor-in-Chief), 1990. Reprinted by permission of ASM International, Materials Park, OH.]
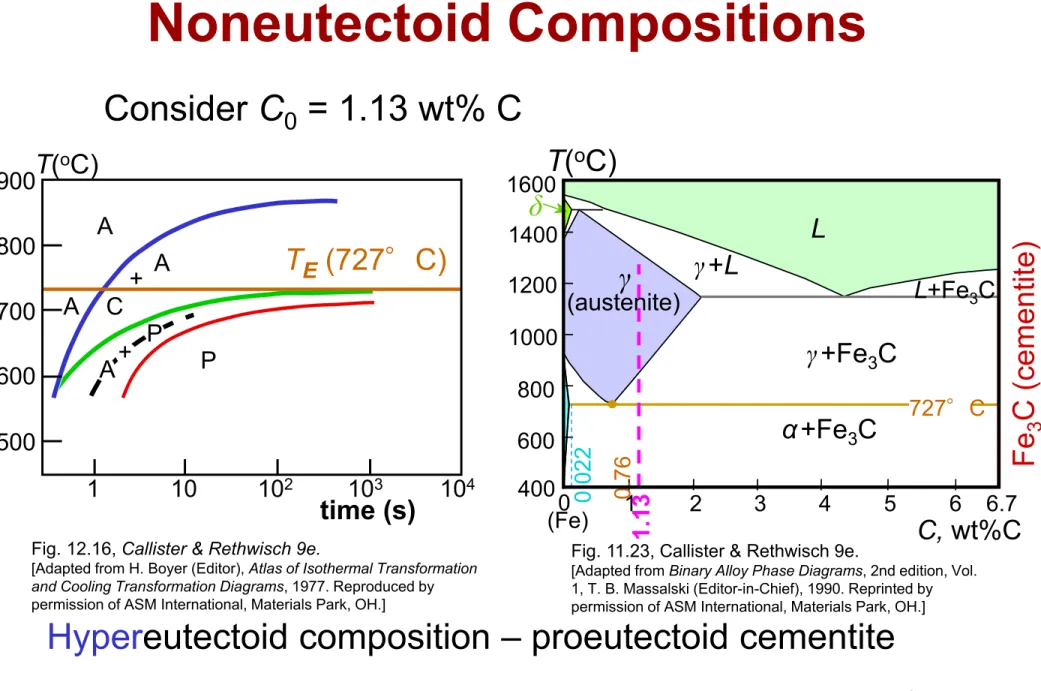
Transformations Involving Noneutectoid Compositions
Hypereutectoid composition – proeutectoid cementite Consider C
0= 1.13 wt% C
a TE (727°C) T(oC)
time (s)
A
A
+ A C
P
1 10 102 103 104
500 700 900
600 800
A+ P
Fig. 12.16, Callister & Rethwisch 9e.
[Adapted from H. Boyer (Editor), Atlas of Isothermal Transformation and Cooling Transformation Diagrams, 1977. Reproduced by permission of ASM International, Materials Park, OH.]
Fe 3C (cementite)
1600 1400 1200 1000 800 600
4000 1 2 3 4 5 6 6.7
L
(austenite)γ
γ +L
γ +Fe3C α +Fe3C
L+Fe3C
δ
(Fe) C, wt%C
T(oC)
727°C
0.760.022 1.13
10 103 105
time (s)
10-1 400 600 800
T(°C) Austenite (stable)
200
P
B
TE
A
A
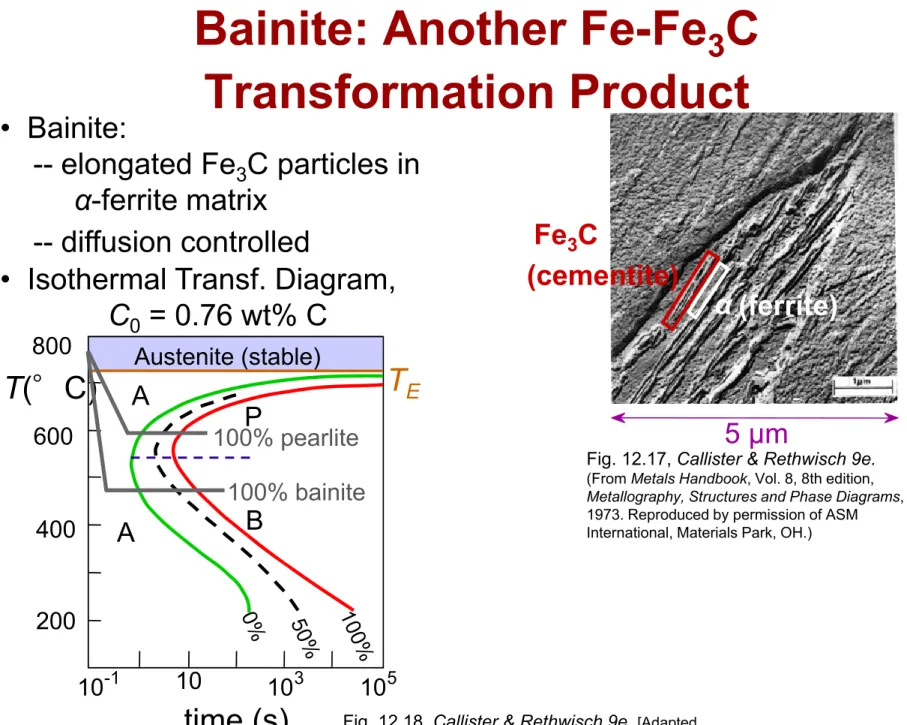
Bainite: Another Fe-Fe 3 C Transformation Product
• Bainite:
-- elongated Fe3C particles in α-ferrite matrix
-- diffusion controlled
• Isothermal Transf. Diagram, C0 = 0.76 wt% C
Fig. 12.17, Callister & Rethwisch 9e.
(From Metals Handbook, Vol. 8, 8th edition, Metallography, Structures and Phase Diagrams, 1973. Reproduced by permission of ASM International, Materials Park, OH.)
Fe3C
(cementite)
5 μm α (ferrite)
100% bainite 100% pearlite
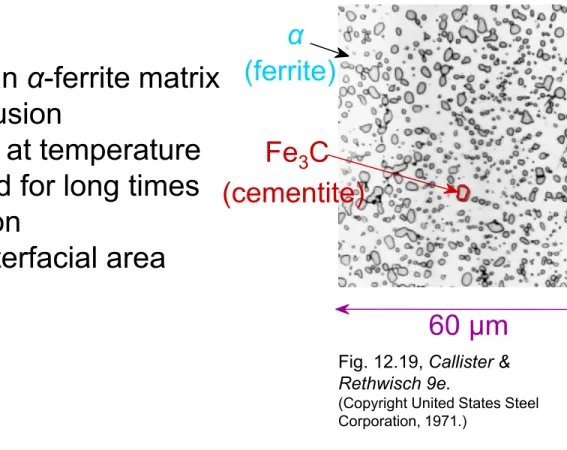
• Spheroidite:
-- Fe3C particles within an α-ferrite matrix -- formation requires diffusion
-- heat bainite or pearlite at temperature just below eutectoid for long times -- driving force – reduction
of α-ferrite/Fe3C interfacial area
Spheroidite: Another Microstructure for the Fe-Fe 3 C System
Fig. 12.19, Callister &
Rethwisch 9e.
(Copyright United States Steel Corporation, 1971.)
60 μm α
(ferrite)
(cementite) Fe3C
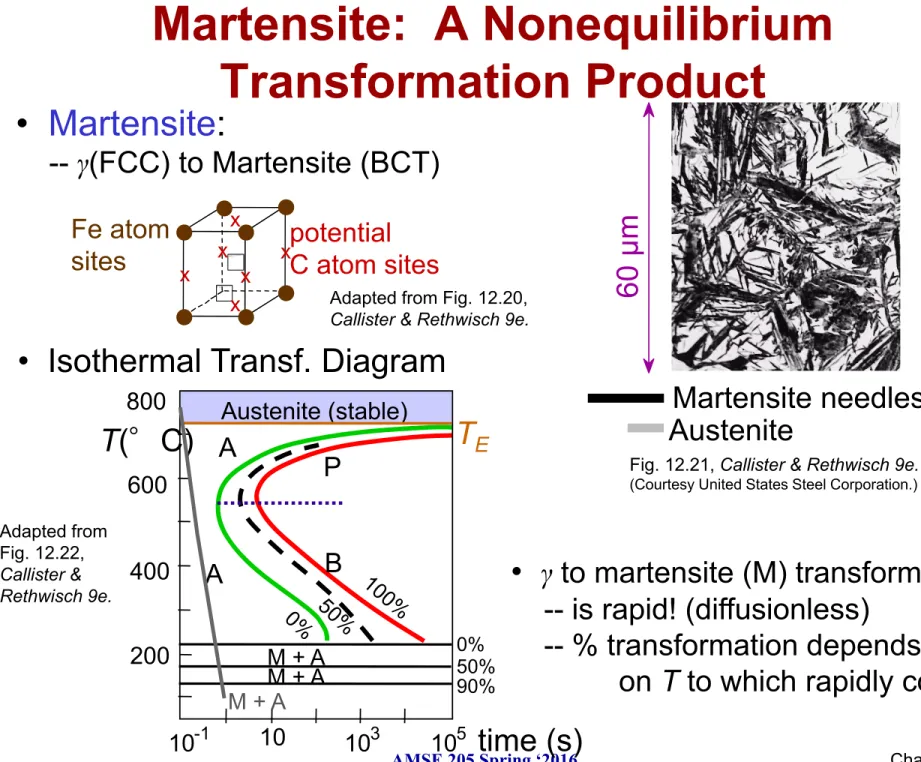
• Martensite:
-- γ(FCC) to Martensite (BCT)
Fig. 12.21, Callister & Rethwisch 9e.
(Courtesy United States Steel Corporation.)
Adapted from Fig. 12.20, Callister & Rethwisch 9e.
Martensite: A Nonequilibrium Transformation Product
Martensite needles Austenite
60 μm
현재 이 이미지를 표시할 수 없습니다.
현재 이 이미지를 표시할 수 없습니다.
x
x x
x x
x potential C atom sites Fe atom
sites
Adapted from Fig. 12.22, Callister &
Rethwisch 9e.
• Isothermal Transf. Diagram
•
γ to martensite (M) transformation.-- is rapid! (diffusionless)
-- % transformation depends only on T to which rapidly cooled
400 600 800
T(°C) Austenite (stable)
200
P B
TE
A
A
M + A M + A M + A
0%
50%90%
γ (FCC) α (BCC) + Fe
3C
Martensite Formation
slow cooling
tempering quench
M (BCT)
Martensite (M) – single phase
– has body centered tetragonal (BCT) crystal structure
Diffusionless transformation BCT if C
0> 0.15 wt% C
BCT
few slip planes
hard, brittle
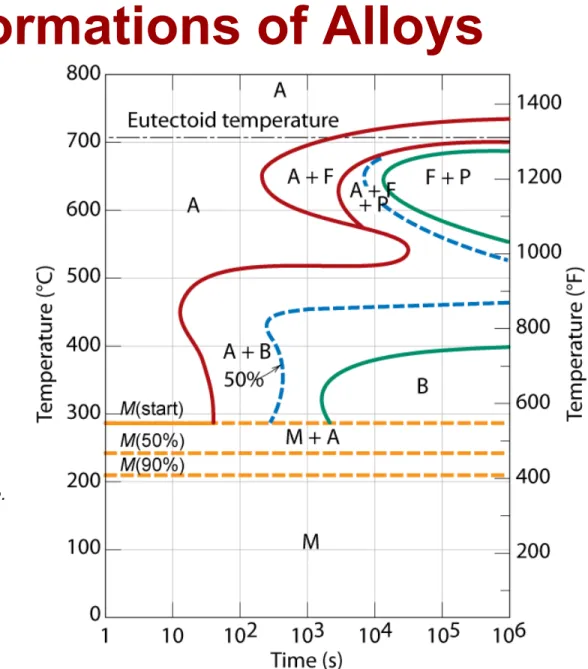
Phase Transformations of Alloys
Effect of adding other elements Change transition temp.
Cr, Ni, Mo, Si, Mn
retard
γ α +
Fe3Creaction (and formation of pearlite, bainite)
Fig. 12.23, Callister & Rethwisch 9e.
[Adapted from H. Boyer (Editor), Atlas of Isothermal Transformation and Cooling Transformation Diagrams, 1977.
Reproduced by permission of ASM International, Materials Park, OH.]
Continuous Cooling Transformation Diagrams
Conversion of isothermal transformation diagram to continuous cooling
transformation diagram
Cooling curve
Fig. 12.25, Callister & Rethwisch 9e.
[Adapted from H. Boyer (Editor), Atlas of Isothermal Transformation and Cooling Transformation Diagrams, 1977.
Reproduced by permission of ASM International, Materials Park, OH.]
Isothermal Heat Treatment Example Problems
On the isothermal transformation diagram for a 0.45 wt% C, Fe-C alloy, sketch and label the time-temperature paths to produce the following microstructures:
a) 42% proeutectoid ferrite and 58% coarse pearlite
b) 50% fine pearlite and 50% bainite c) 100% martensite
d) 50% martensite and 50% austenite
Solution to Part (a) of Example Problem
a) 42% proeutectoid ferrite and 58% coarse pearlite
Isothermally treat at ~ 680°C
-- all austenite transforms to proeutectoid α and
coarse pearlite.
A + B A + P A + α
A
BP
A 50%
0 200 400 600 800
0.1 10 103 105
time (s)
M (start) M (50%) M (90%)
Fe-Fe3C phase diagram, for C0 = 0.45 wt% C
T (°C)
Figure 12.39, Callister & Rethwisch 9e.
b) 50% fine pearlite and 50% bainite
Solution to Part (b) of Example Problem
T (ºC)
A + B A + P A + α
A
BP
A 50%
0 200 400 600 800
M (start) M (50%) M (90%)
Fe-Fe3C phase diagram, for C0 = 0.45 wt% C
Then isothermally treat at ~ 470°C
– all remaining austenite transforms to bainite.
Isothermally treat at ~ 590°C – 50% of austenite transforms
to fine pearlite.
Solutions to Parts (c) & (d) of Example Problem
c) 100% martensite – rapidly quench to room temperature
d) 50% martensite
& 50% austenite
-- rapidly quench to
~ 290°C, hold at this temperature
T (°C)
A + B A + P A + α
A
BP
A 50%
0 200 400 600 800
0.1 10 103 105
time (s)
M (start) M (50%) M (90%)
Fe-Fe3C phase diagram, for C0 = 0.45 wt% C
d) c)
Figure 12.39, Callister & Rethwisch 9e.
Mechanical Props: Influence of C Content
Fig. 11.29, Callister & Rethwisch 9e.
(Courtesy of Republic Steel Corporation.)
• Increase C content: TS and YS increase, %EL decreases C0< 0.76 wt% C
Hypoeutectoid Pearlite (med)
ferrite (soft)
Fig. 11.32, Callister & Rethwisch 9e.
(Copyright 1971 by United States Steel Corporation.)
C0 > 0.76 wt% C Hypereutectoid
Pearlite (med) Cementite
(hard)
Fig. 12.29, Callister &
Rethwisch 9e.
[Data taken from Metals Handbook: Heat Treating, Vol. 4, 9th edition, V.
Masseria (Managing Editor), 1981. Reproduced by permission of ASM International, Materials Park, OH.]
300 500 700 900 YS(MPa)1100 TS(MPa)
wt% C
0 0.5 1
hardness
0.76
Hypo Hyper
wt% C
0 0.5 1
0 50 100
%EL
Impact energy (Izod, ft-lb)
0 40 80
0.76
Hypo Hyper
Mechanical Props: Fine Pearlite vs. Coarse Pearlite vs. Spheroidite
Fig. 12.30, Callister & Rethwisch 9e.
[Data taken from Metals Handbook: Heat Treating, Vol. 4, 9th edition, V. Masseria (Managing Editor), 1981. Reproduced by
permission of ASM International, Materials Park, OH.]
• Hardness:
• %RA:
fine > coarse > spheroidite fine < coarse < spheroidite
80 160 240 320
0 0.5 wt%C1
Brinell hardness
fine pearlite coarse pearlite spheroidite
Hypo Hyper
0 30 60 90
wt%C
Ductility (%RA)
fine pearlite coarse pearlite spheroidite
Hypo Hyper
0 0.5 1
Mechanical Props: Fine Pearlite vs.
Martensite
• Hardness: fine pearlite << martensite.
Tempered Martensite
• tempered martensite less brittle than martensite
• tempering reduces internal stresses caused by quenching
Figure 12.33, Callister &
Rethwisch 9e.
(Copyright 1971 by United States Steel Corporation.)
•
tempering decreases TS, YS but increases %RA•
tempering produces extremely small Fe3C particles surrounded by α.Fig. 12.34, Callister &
Rethwisch 9e.
(Adapted from Edgar C. Bain, Functions of the Alloying
Elements in Steel, 1939. Reproduced by permission of ASM International, Materials Park, OH.)
9 μm
YS(MPa) TS(MPa)
800 1000 1200 1400 1600 1800
30 40 50 60
200 400 600
Tempering T(°C)
%RA TS
YS
%RA
Heat treat martensite to form tempered martensite
Shape Memory Alloy
Nitinol: (Ni-Ti Naval Ordnance Laboratory)
Shape Memory Effect
Pseudo Elasticity (Super Elasticity)
Summary of Possible Transformations
Adapted from Fig. 12.36, Callister &
Rethwisch 9e.
Austenite (γ)
Pearlite
(α + Fe3C layers + a proeutectoid phase)
slow cool
Bainite
(α + elong. Fe3C particles)
moderate cool
Martensite
(BCT phase diffusionless transformation)
rapid quench
Tempered Martensite
(α + very fine Fe3C particles)