Introduction
The susceptibility vessel sign (SVS) on T2*-weighted gradient-echo imaging (T2*-GRE) is useful for detecting
intra-arterial clots and monitoring the response to thrombolysis (1-3). An intra-arterial clot, which is a source of ischemic events, generates the SVS-GRE by deoxyhemoglobin containing unpaired electrons producing a nonuniform local magnetic field (4). The
JKSMRM 15:257-261(2011)
Department of Radiology, Catholic University of Daegu School of Medicine, Daegu, Korea
This work was supported by Basic Science Research Program through the National Research Foundation of Korea (NRF) funded by Ministry of Eduation, Science and Technology (grant number 20119123). Otherwise, the authors have no conflicts of interests and/or disclosure.
Received; November 15, 2011, revised; December 6, 2011, accepted; December 20, 2011
Corresponding author : Sung Won Youn, M.D., Department of Radiology, Catholic University of Daegu School of Medicine, 3056-6 Daemyung-4 dong, Nam-gu, Daegu 705-718, Korea.
Tel. 82-53-650-4309 Fax. 82-53-650-4339 E-mail: [email protected]
A newly Developed Hyperintensity Within a Posterior Cerebral Artery Susceptibility Vessel Sign in T2*-Weighted Gradient- Echo Imaging: a Case Report and Correlation with Magnetic
Resonance Angiography and Black-Blood Imaging
Sung Won Youn, Ho Kyun Kim
The susceptibility vessel sign (SVS) on T2*-weighted gradient-echo imaging (T2*- GRE) is useful for detecting intra-arterial clots and monitoring the response to thrombolysis. SVS-GRE was observed in a 52-year-old man with acute occlusion of the posterior cerebral artery (PCA) before and after failed intra-arterial thrombolysis.
One-week follow-up T2*-GRE revealed a hyperintensity within the SVS-GRE in the affected PCA. The right PCA remained occluded on time-of-flight (TOF) magnetic resonance angiography (MRA), but its P2 segment exhibited luminal patency on contrast-enhanced (CE) MRA. Black-blood MR imaging using a T1-weighted turbo- spin echo sequence revealed narrowing of the arterial lumen and thickening of the wall due to an atherosclerotic plaque. The observations from TOF-MRA, CE-MRA, and black-blood MR imaging suggest that a newly developed hyperintensity within the SVS-GRE seems to be associated with slow flow through a severe atherosclerotic stenosis or near-occlusion.
Index words :Hyperintensity
Susceptibility vessel sign
T2*-weighted gradient echo MR imaging Slow flow
Stenosis
SVS-GRE is diminished or even disappears on follow- up imaging after successful thrombolysis, with its absence being strongly correlated with complete recanalization on follow-up angiography (2). We have recently experienced a case of newly developed hyperintensity within an SVS-GRE at 1 week after stroke onset. To our knowledge there are no reports of related observations or systematic investigations in the literature.
Herein we describe a patient with a newly developed hyperintensity within an SVS-GRE and explain its
possible mechanism based on findings from magnetic resonance angiography (MRA) and black-blood MR imaging.
Case Report
A 52-year-old man with hypertension and type II diabetes mellitus visited an emergency-care unit due to sudden vision loss and vertigo. On examination, he had left homonymous hemianopsia and left hemineglect.
His baseline score on the NIHSS (National Institutes of
a b
c d
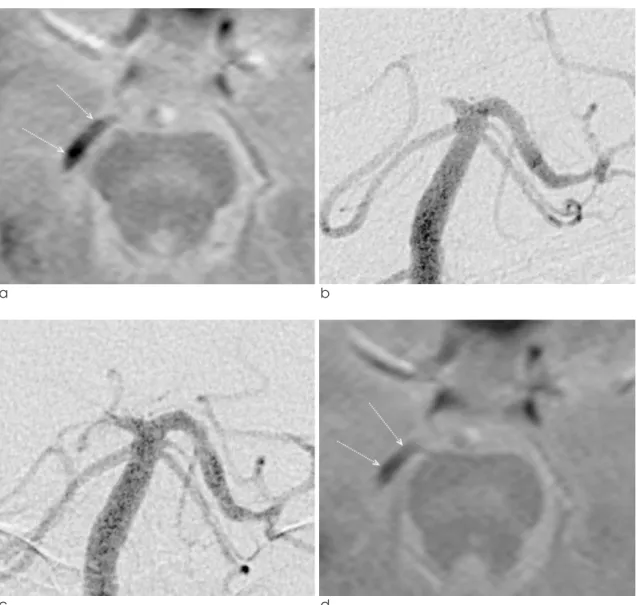
Fig. 1. A 52-year-old man presented with sudden vision loss and vertigo. (a) Baseline T2*-weighted gradient-echo imaging (T2*-GRE). The susceptibility asymmetry index (SAI), defined as the diameter ratio between the susceptibility vessel sign (SVS) on T2*-GRE and the contralateral normal posterior cerebral artery (PCA) on magnetic resonance angiography (MRA), was 1.11 (arrows; diameter of the SVS-GRE, 3.65 mm). (b) Baseline digital subtraction angiography (DSA) showed complete occlusion at the junction of the right P1 and P2 segments. (c) DSA performed after intra-arterial thrombolysis revealed failed recanalization. (d) The SAI on T2*-GRE immediately after failed thrombolysis was 0.94 (arrows; diameter of the SVS-GRE, 3.10 mm).
Health Stroke Scale) was 8, with left hemiparesis, left facial palsy, asomatognosia, and anosognosia. This was his third attack-he had a history of infarctions of the left posterior inferior cerebellar artery territory with segmental stenosis of the right posterior cerebral artery (PCA) 4 months previously and the right PCA territory 7 weeks previously.
Diffusion-weighted imaging (DWI) and T2*-GRE were performed using a 1.5-T MR imaging unit (Magnetom Vision, Siemens, Erlangen, Germany). DWI (TR/TE, 5,095 ms/139 ms; b, 0 and 1,000 s/mm2; slice thickness, 5 mm; matrix, 128×96) performed 8 hours
after symptom onset showed acute ischemic lesions in the right medial thalamus and medial temporal region.
T2*-GRE (TR/TE, 440 ms/12 ms; flip angle, 20�; slice thickness, 5 mm; matrix, 256×150) showed an SVS- GRE in the right P2 segment (Fig. 1a). His mental state worsened from drowsy to stuporous, and his NIHSS score deteriorated to 13, so intra-arterial thrombolysis (IAT) was attempted at 9 hours after symptom onset.
Baseline digital subtraction angiography (DSA) revealed complete occlusion of the right PCA (Fig. 1b). IAT was performed using 200,000 units of urokinase and 1.8 mg of tirofiban, but the right PCA remained occluded on
a b
c d
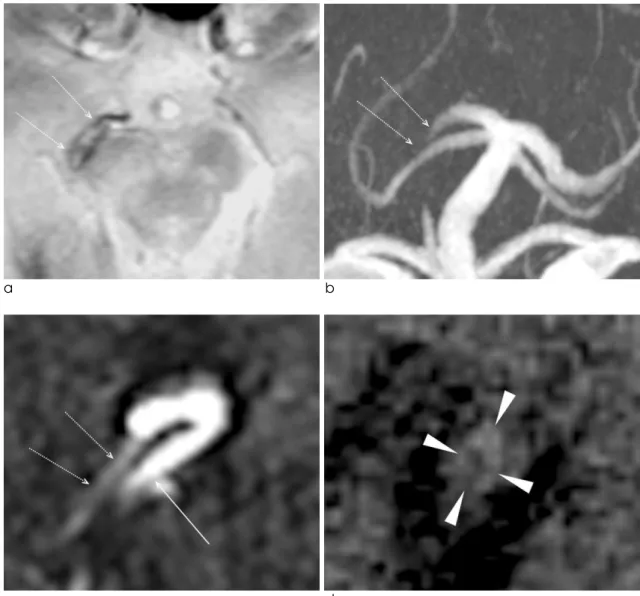
Fig. 2. One-week follow-up MR imaging. (a) T2*-GRE showed a newly developed hyperintensity within the susceptibility vessel sign (arrows; SAI, 1.60; diameter, 5.24 mm). (b) Time-of-flight MRA showed occlusion of the right P2 segment of the PCA (arrows). (c) Raw data of contrast-enhanced MRA obtained in the coronal plane revealed tubular narrowing of the vascular lumen (arrows). The right P2 segment of the PCA ran parallel to the right superior cerebellar artery (arrow).
(d) Black-blood imaging using a T1-weighted turbo-spin echo sequence revealed thickening of the arterial wall due to an atherosclerotic plaque (arrowheads).
post-IAT DSA (Fig. 1c, d). The NIHSS score had improved to 11 after 24 hours. One-week follow-up T2*-GRE revealed a hyperintensity within an SVS-GRE in the affected PCA (Fig. 2a). MRA and black-blood imaging were performed using a 3.0-T MR imaging unit (TrioTim, Siemens). The right PCA remained occluded on time-of-flight (TOF) MRA (Fig. 2b), but its P2 segment exhibited luminal patency on contrast- enhanced (CE) MRA (Fig. 2c). ECG-gated black-blood MR imaging using a T1-weighted turbo-spin echo sequence (Fig. 2d) with scanning perpendicular to the right P2 segment of the PCA revealed narrowing of the arterial lumen and thickening of the wall due to an atherosclerotic plaque. The tissue contrast was best on a T1-weighted turbo-spin echo sequence, which indicated that the wall and lumen areas were 5.3 mm2 and 0.82 mm2, respectively (Table 1). The diameter- percentage stenosis ranged from 66.7% to 71.6%. His homonymous hemianopsia was not improved after 1 month, but other neurologic deficits improved to produce an NIHSS score of 2.
Discussion
There were several indications that our patient had experienced strokes associated with atherosclerosis.
First, segmental stenosis of the right P2 segment of the PCA was evident in initial MRA. Second, our patient had strokes in the same vascular territory twice, with the two episodes separated by only 7 weeks. According to Kang et al., early recurrent lesions of index stroke in the same vascular territory are frequent in intracranial atherosclerosis (5). Third, plaque MR imaging using a black-blood turbo-spin echo sequence clearly depicted
thickening of the arterial wall and narrowing of the lumen, possibly by an atherosclerotic plaque (6).
Interestingly, CE-MRA performed one week after the stroke revealed luminal patency of the right P2 segment of the PCA, while TOF-MRA indicated that the same segment was occluded. TOF-MRA often overestimates the degree of vascular obstruction, because the saturation of the MR signal for TOF-MRA acquisition makes it insensitive to slow flows (7).
However, CE-MRA can reveal an arterial segment with a slow flow and avoids overestimation of a vascular obstruction by shortening the T1 relaxation time and decreasing the saturation effects, in addition to increasing the steady-state signal intensity of blood relative to that of stationary tissues (8). CE-MRA can reveal anterograde flow beyond a proximal vascular stenosis or retrograde flow beyond a vascular occlusion caused by the collateral circulation, and the extent of occlusion on CE-MRA is similar to DSA results (7). In our patient it was not certain whether there was anterograde or retrograde flow because DSA was not performed, but the luminal patency on CE-MRA suggested the presence of a slow flow through an atherosclerotic stenosis or near-occlusion.
It is not certain how the hyperintensity newly developed within the SVS-GRE in our patient. The hyperintense center of a hyperacute intracerebral hemorrhage on T2*-GRE lessens progressively over time as deoxygenation of extravascular blood progresses from the periphery inward (4, 9). Fresh blood in the center of a hyperacute intracerebral hemorrhage has been considered a proteinaceous solution when proton relaxation times are not yet influenced by the deoxyhemoglobin present (9). If the
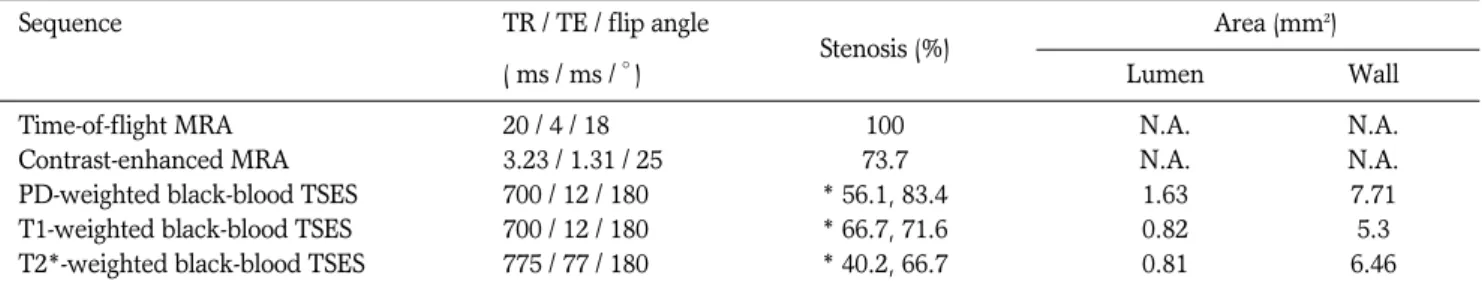
Table 1. Magnetic Resonance Angiography (MRA) and Black-Blood MR Imaging: Scan Parameters and Measurements of the P2 Segment of the Right Posterior Cerebral Artery
Sequence TR / TE / flip angle
Stenosis (%) Area (mm2)
( ms / ms / �) Lumen Wall
Time-of-flight MRA 20 / 4 / 18 100 N.A. N.A.
Contrast-enhanced MRA 3.23 / 1.31 / 25 73.7 N.A. N.A.
PD-weighted black-blood TSES 700 / 12 / 180 * 56.1, 83.4 1.63 7.71
T1-weighted black-blood TSES 700 / 12 / 180 * 66.7, 71.6 0.82 5.3
T2*-weighted black-blood TSES 775 / 77 / 180 * 40.2, 66.7 0.81 6.46
PD, proton density; TSES, turbo-spin echo sequence; The number of trigger pulse by ECG gating was 2 in PD-weighted and T2*- weighted black-blood TSES, and 1 in T1-weighted black-blood TSES; N.A., not assessable; *(a, b), diameters measured in two perpendicular directions to obtain the minimum (a) and maximum (b) stenosis percentages.
reverse process of hyperacute hemorrhage or centrifugal oxygenation occurs in the artery, the slow flow for supplying oxygen may generate a hyperintensity within the SVS-GRE.
A slow flow can also be demonstrated on a fluid- attenuated inversion recovery (FLAIR) sequence.
However, a hyperintensity within an SVS-GRE can be distinguished from hyperintense vessels on a FLAIR sequence since the former is located within the clot while the latter are proximal or distal to a stenosis or occlusion (10).
Conclusion
In conclusion, the observations from TOF-MRA, CE- MRA, and black-blood MR imaging suggest that the newly developed hyperintensity within the SVS-GRE in our patient seems to be associated with a slow flow through an atherosclerotic stenosis or near-occlusion.
References
1.Flacke S, Urbach H, Keller E, et al. Middle cerebral artery (MCA) susceptibility sign at susceptibility-based perfusion MR imaging: clinical importance and comparison with hyperdense MCA sign at CT. Radiology 2000;215:476-482 2.Kim HS, Lee DH, Choi CG, Kim SG, Suh DC. Progression of
middle cerebral artery susceptibility sign on T2*-weighted images: its effect on recanalization and clinical outcome after thrombolysis. AJR Am J Roentgenol 2006;187:W650-657 3.Youn SW, Jung C, Choi BS, et al. The susceptibility vessel
sign of the middle cerebral artery on the T2*-weighted gradient echo imaging: semi-quantification to predict the response to multimodal intra-arterial thrombolysis. J Korean Soc Radiol 2011;64:1-9
4.Atlas SW, Thulborn KR. MR detection of hyperacute parenchymal hemorrhage of the brain. AJNR Am J Neuroradiol 1998;19:1471-1477
5.Kang DW, Kwon SU, Yoo SH, et al. Early recurrent ischemic lesions on diffusion-weighted imaging in symptomatic intracranial atherosclerosis. Arch Neurol 2007;64:50-54 6.Ryu CW, Jahng GH, Kim EJ, Choi WS, Yang DM. High
resolution wall and lumen MRI of the middle cerebral arteries at 3 tesla. Cerebrovasc Dis 2009;27:433-442
7.Ishimaru H, Ochi M, Morikawa M, et al. Accuracy of pre- and postcontrast 3D time-of-flight MR angiography in patients with acute ischemic stroke: correlation with catheter angiography. AJNR Am J Neuroradiol 2007;28:923-926 8.Yano T, Kodama T, Suzuki Y, Watanabe K. Gadolinium-
enhanced 3D time-of-flight MR angiography. Experimental and clinical evaluation. Acta Radiol 1997;38:47-54
9.Linfante I, Llinas RH, Caplan LR, Warach S. MRI features of intracerebral hemorrhage within 2 hours from symptom onset. Stroke 1999;30:2263-2267
10.Sanossian N, Saver JL, Alger JR, et al. Angiography reveals that fluid-attenuated inversion recovery vascular hyperintensities are due to slow flow, not thrombus. AJNR Am J Neuroradiol 2009;30:564-568
통신저자 : 윤성원, (705-718) 대구시 남구 대명 4동 3056-6번지, 대구가톨릭대학교 의과대학 영상의학과 Tel. (053) 650-4309 Fax. (053) 650-4339 E-mail: [email protected]
T2*경사자장영상의 후뇌동맥 자화징후 내에 새로이 보이는 고신호강도:
증례보고 및 자기공명 혈관조영상과 경화반 영상의 연관 분석
대구가톨릭대학교 의과대학 영상의학과 윤 성 원∙김 호 균
T2*경사자장영상에서 혈관자화징후는 혈관내 혈괴를 찾아내고 혈전용해술의 반응을 평가하는데 유용하게 사용된 다. 후뇌동맥의 급성 폐색이 있는 52세 남자환자에서 T2*경사자장-혈관자화징후는 실패한 동맥내 혈전용해술의 전 후 모두에서 관찰되었다. 1주후 추적 T2*경사자장영상을 시행하였으며, 후뇌동맥의 혈관자화징후 내에서 고신호강도 가 새로이 관찰되었다. 유체속도 강조 자기공명 혈관조영상에서 오른쪽 후뇌동맥은 여전히 막혀있었으나, 조영증강 자기공명 혈관조영상에서는 오른쪽 후뇌동맥의 두번째 분절의 혈류가 재개통되었다. T1강조 고속스핀에코를 이용한 경화반 영상에서는 죽상경화반에 의한 것으로 생각되는 혈관벽의 비후와 혈관내벽의 협착을 관찰할 수 있었다. 유체 속도 강조 및 조영증강 자기공명 혈관조영상과 경화반 영상에서 보듯이, T2*경사자장-혈관자화 징후내에서 새로이 보이는 신호강도는 폐색에 가까운 동맥경화성 협착을 통과하는 느린 혈류와 관련이 있을 것으로 판단된다.
대한자기공명의과학회지 15:257-261(2011)