Journal of the Korean Society for Power System Engineering http://dx.doi.org/10.9726/kspse.2015.19.4.082 Vol. 19, No. 4, pp. 82-88, August 2015
Effect of Impinging Plate on Exhaust Emission and Engine Performance in Diesel Engine
Yong-Su Jin*, Jae-Dong Kim**†and Yeong-Sik Kim***
(Received 16 June 2015, Revision received 29 July 2015, Accepted 29 July 2015)
Abstract: The purpose of this study is to investigate the effect of the impinging plate on combustion process in Diesel engine. Especially, the variation of exhaust emission and engine performance by the change of fuel injection timing and fuel injection pressure between the trial engine with impinging plate and the prototype engine were examined. The nitrogen oxide concentration of the trial engine decreased more than 50% compared to the prototype engine, however, smoke concentration of the trial engine indicated higher degree than the prototype engine. The smoke concentration, fuel consumption rate and exhaust gas temperature decreased as the fuel injection timing become faster, whereas the nitrogen oxide concentration decreased as the fuel injection timing is retarded. The nitrogen oxide concentration, fuel consumption rate and exhaust gas temperature decreased as the fuel injection pressure become lower.
But smoke concentration decreased as the fuel injection pressure become higher.
Key Words:Impinging Spray, Exhaust Emission, Engine Performance, Injection Timing, Injection Pressure
**†Jae-Dong Kim(corresponding author) : Institute of Marine Industry, Gyeongsang National University.
E-mail : [email protected], Tel : 055-772-9042
*** Yeong-Sik Kim : Department of Mechanical Design Engineering, Pukyong National University.
* Yong-Su Jin : Training Ship “SAEBADA”, Gyeongsang National University.
1. Introduction
As the coming presence of higher oil price, the use of diesel engine have been increasing because of its advantages that can make high efficiency and high power. For this reason, the regulation on the exhaust emission have been strengthening gradually.
As the MARPOL 73/78 Annex Ⅵ(Regulation for the Prevention of Air Pollution from Ships) came into effect on June 2005, the regulation on the
exhaust emission have been expanded its range not only land engine but marine engine and offshore.
Because the Nitrogen oxides destroy the global environment causing the photochemical smog and acid rain, and smoke become the cause of air pollution, further it is harmful for human body, the emission controls against the these compounds are being more enhanced.
The reduction method of exhaust emission broadly divisible into improvement of fuel, improvement of combustion and treatment of exhaust gas. The reducing method of harmful compounds through the combustion improvement have been studied consistently together with increase of thermal efficiency and improvement of performance.
1-3)To get the good combustion, injection of fuel oil
should be maintain good condition preferentially
because the combustion are influenced by the distribution of oil droplet and aerodynamic behavior of oil droplet. The requirements for good fuel injection are atomization, penetration and dispersion of oil droplet and these requirements are being contrary to each other. Therefore it is not easy to fulfill the all requirements, that is, to make the perfect combustion retaining the uniform distribution between the air and fuel throughout the combustion chamber.
Recently, the studies on the combustion improvement by the impinging plates are being attempted actively.
4-6)The trial engine, which are installed the impinging plates to the piston cavity,
7,8)cylinder
9)and nozzle fore-end,
10)resulted in good combustion, increase of thermal efficiency
7,8)and decrease of nitrogen oxides emission
9,10)compared to the prototype engine that are not installed the impinging plate.
This study experimentally discussed on the effect of impinging plates on exhaust emission and engine performance by changing the fuel injection timing and fuel injection pressure.
2. Experimental procedure
2.1 Inserting impinging plates
As a result of previous experiment, it is verified that the impinging plates like the shape of Fig. 1 shows best injection condition and similar injection angle compared with the prototype engine.
11)Fig. 1 Shape of impinging plate
Fig. 2 shows the trial engine which inserted the impinging plates at fore-end of nozzle in the prototype engine. In Fig. 2, the distance between the fore-end of nozzle and impinging plate is 2 mm.
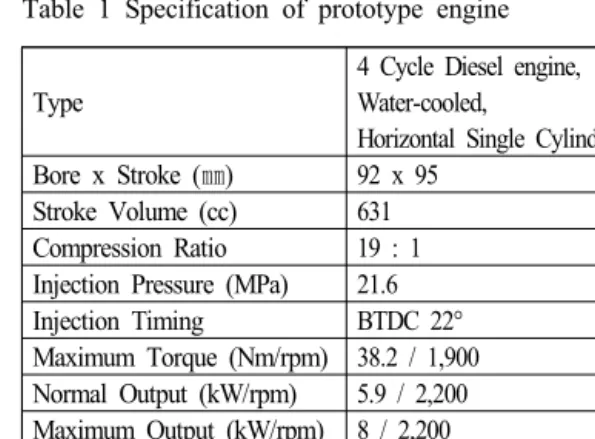
Table 1 shows the specification of prototype engine used in this experiment.
Fig. 2 Schematic view of trial engine with impinging plate
2.2 Measurement method
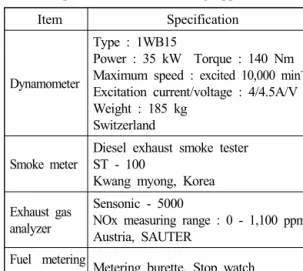
Table 2 indicates the specification of measuring apparatus used in this experiment. The concentration of nitrogen oxides measured by exhaust gas analyzer after inserted the inlet port of analyzer at 200mm away from the flange of exhaust pipe and inhaled
Table 1 Specification of prototype engine
Type
4 Cycle Diesel engine, Water-cooled,
Horizontal Single Cylinder Bore x Stroke (㎜) 92 x 95
Stroke Volume (cc) 631 Compression Ratio 19 : 1 Injection Pressure (MPa) 21.6 Injection Timing BTDC 22°
Maximum Torque (Nm/rpm) 38.2 / 1,900
Normal Output (kW/rpm) 5.9 / 2,200
Maximum Output (kW/rpm) 8 / 2,200
Injection Nozzle 0.2 ㎜ x 4 holes
the exhaust gas from the inlet port during 3 minutes. The concentration of smoke measured by smoke meter after induced the exhaust gas to the paper type filter and read the percent values from the meter.
Table 2 Specification of measuring apparatus
Item Specification
Dynamometer
Type : 1WB15
Power : 35 kW Torque : 140 Nm Maximum speed : excited 10,000 min
-1Excitation current/voltage : 4/4.5A/V Weight : 185 kg
Switzerland
Smoke meter
Diesel exhaust smoke tester ST - 100
Kwang myong, Korea Exhaust gas
analyzer
Sensonic - 5000
NOx measuring range : 0 - 1,100 ppm Austria, SAUTER
Fuel metering
gauge Metering burette, Stop watch
3. Result and Discussion
3.1 Exhaust Emission 3.1.1 Nitrogen oxides
Fig. 3 shows the nitrogen oxide concentration varied with engine speed and load for the prototype and trial engine when the fuel injection timing and fuel injection pressure are set at BTDC 22∘ and 22.5 MPa respectively. The trial engine indicated remarkably low nitrogen oxide concentration compared to the prototype engine. The nitrogen oxide concentration of the prototype engine shows 721 ppm, whereas the nitrogen oxide concentration of the trial engine shows 334 ppm when the both engines are operating at 2,200 rpm and full load, that is, the trial engine reduced the nitrogen oxide concentration more than 50% compared to the prototype engine regardless of engine speed and load.
It is considered that the injected oil droplet to the impinging plate improved the spread and distribution of oil droplets by active impinging on the impinging plate, and therefore increased the air utilization and decreased the ignition lag period by early combustion. Meanwhile, the nitrogen oxide concentration decreased when the engine is running at low load(1/2 load) compared to high load(4/4 load) for both engines.
Fig. 4 indicates the nitrogen oxide concentration varied with the injection timing. When the injection timing is retarded, the nitrogen oxide concentration is decreased because combustion temperature is lower due to the smaller premixed combustion.
Fig. 5 indicates the nitrogen oxide concentration varied with injection pressure. The nitrogen oxide concentration decreased when the injection pressure is lower.
3.1.2 Smoke
Fig. 6 shows the variation of smoke concentration varied with engine speed and load for the prototype and trial engine. On the contrary to nitrogen oxide, the trial engine indicated high smoke concentration compared to the prototype engine.
1000 1200 1400 1600 1800 2000 2200
100 200 300 400 500 600 700 800 900 1000 1100
NO x ( p pm )
Eng. speed (rpm)
prototype eng. (4/4 Load) prototype eng. (1/2 Load) trial eng. (4/4 Load) trial eng. (1/2 Load)
Fig. 3 Comparison of NOx emission between
prototype engine and trial engine
1000 1200 1400 1600 1800 2000 2200 100
150 200 250
NOx (ppm)
Eng. speed (rpm)
BTDC 19o BTDC 20o BTDC 21o BTDC 22o BTDC 23o
Fig. 4 Comparison of NOx emission of trial engine with various injection timing
1000 1200 1400 1600 1800 2000 2200 100
150 200 250 300 350 400 450 500
NOx (ppm)
Eng. speed (rpm)
trial eng. 22.5MPa, 1/2 Load trial eng. 23.5MPa, 1/2 Load trial eng. 22.5MPa, 4/4 Load trial eng. 23.5MPa, 4/4 Load
Fig. 5 Comparison of NOx emission of trial engine with various injection pressure
1000 1200 1400 1600 1800 2000 2200 0
10 20 30 40 50 60 70 80
Smoke (%)
Eng. speed (rpm)
prototype (1/2 Load) prototype (4/4 Load) trial eng. (1/2 Load) trial eng. (4/4 Load)
Fig. 6 Comparison of smoke emission between prototype engine and trial engine
Fig. 7 shows the variation of the smoke concentration varied with the fuel injection timing.
The smoke concentration decreased as the fuel injection timing become faster.
1000 1200 1400 1600 1800 2000 2200 0
10 20 30 40 50 60 70 80
Smoke (%)
Eng. speed (rpm)
BTDC 19o BTDC 20o BTDC 21o BTDC 22o BTDC 23o
Fig. 7 Comparison of smoke emission of trial engine with various injection timing
1000 1200 1400 1600 1800 2000 2200 0
10 20 30 40 50 60 70 80
Smoke (%)
Eng. speed (rpm)
trial eng. 22.5MPa, 1/2 Load trial eng. 22.5MPa, 4/4 Load trial eng. 23.5MPa, 1/2 Load trial eng. 23.5MPa, 4/4 Load
Fig. 8 Comparison of smoke emission of trial engine with various injection pressure
According to the experiments, the effect of the fuel injection timing on the nitrogen oxide and smoke indicated different results. This is because the formation condition between the nitrogen oxide and smoke are contrary to each other, that is, smoke generate by the thermal dissociation in high temperature and rarefied oxygen environment, whereas the nitrogen oxide increase in high gas temperature and dense oxygen environment.
Therefore, as the fuel injection timing become faster, nitrogen oxide increase because premixed combustion are increased by long ignition-lag period, however smoke decrease because diffusion combustion are decreased.
Fig. 8 indicates the variation of smoke
concentration varied with the fuel injection pressure.
Smoke concentration decreased as the fuel injection pressure become higher.
3.2 Engine Performance 3.2.1 Fuel consumption rate
Fig. 9 shows the fuel consumption rate according to engine speed and load for the prototype and trial engine when the fuel injection timing is set at BTDC 22∘ and fuel injection pressure is 22.5Mpa.
The prototype engine indicated lower fuel consumption compared to the trial engine, and fuel consumption rate indicated low figures when the engine is running at high load(4/4 load) compared with low load(1/2).
Fig. 10 shows the fuel consumption rate according to the fuel injection timing. The fuel consumption rate indicated lower figures as the fuel injection timing become faster. Increase range of the fuel consumption rate according to engine speed decreased as the fuel injection timing become faster as well.
Fig. 11 indicates the fuel consumption rate according to the fuel injection pressure. The fuel consumption rate at low load(1/2 load) decreased as the injection pressure become lower, however, there was no big difference depending on the injection pressure in case of high load(4/4 load).
1000 1200 1400 1600 1800 2000 2200 260
280 300 320 340 360 380 400 420 440
Fuel consumption rate (g/kw-h)
Eng. speed (rpm)
prototype eng. (1/2 Load) prototype eng. (4/4 Load) trial eng. (1/2 Load) trial eng. (4/4 Load)
Fig. 9 Comparison of fuel consumption rate between prototype engine and trial engine
1000 1200 1400 1600 1800 2000 2200
260 280 300 320 340 360 380 400 420 440
Fuel consumption rate(g/kw-h)
Eng. speed (rpm)
BTDC 19o BTDC 20o BTDC 21o BTDC 22o BTDC 23o
Fig. 10 Comparison of fuel consumption rate with various injection timing
1000 1200 1400 1600 1800 2000 2200 260
280 300 320 340 360 380 400 420 440
Fuel consumption (g/Kw-h)
Eng. speed (rpm)
trial eng. 22.5MPa, 1/2 Load trial eng. 22.5MPa, 4/4 Load trial eng. 23.5MPa, 1/2 Load trial eng. 23.5MPa, 4/4 Load
Fig. 11 Comparison of fuel consumption rate with injection pressure
3.2.2 Exhaust gas temperature
Fig. 12 shows the variation of exhaust gas temperature according to the engine speed and load for the prototype and trial engine. The trial engine indicated slight higher exhaust gas temperature than prototype engine.
Fig. 13 indicates the variation of exhaust gas temperature according to the fuel injection timing.
Exhaust gas temperature became lower as the fuel
injection timing become faster. It is already well
known that exhaust gas temperature get lower as the
fuel injection timing become faster. Further, it is
thought that atomizing oil droplet which trickling
down from the support of impinging plate
lengthened the after-burning period during the combustion process and causing the high exhaust gas temperature.
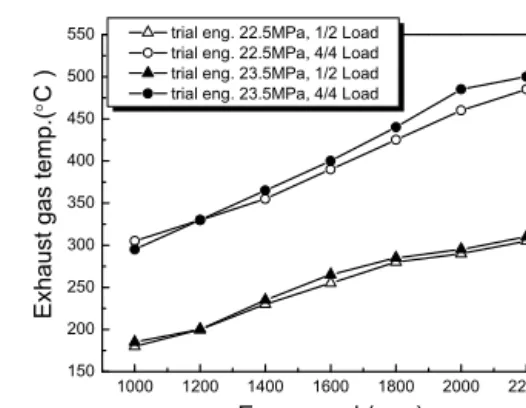
Fig. 14 indicates the variation of exhaust gas temperature according to the fuel injection pressure.
Exhaust gas temperature got lower as the fuel injection pressure become lower, however, there was no big difference depending on the injection pressure.
Fuel consumption and exhaust gas temperature related on engine performance met with good results as the fuel injection timing become faster and the injection pressure become lower.
1000 1200 1400 1600 1800 2000 2200
150 200 250 300 350 400 450 500 550
Exhaust gas temp.(C )
Eng. speed (rpm)
prototype eng. (1/2 Load) prototype eng. (4/4 Load) trial eng. (1/2 Load) trial eng. (4/4 Load)
Fig. 12 Comparison of Exhaust gas temperature between prototype engine and trial engine
1000 1200 1400 1600 1800 2000 2200
300 350 400 450 500
Exhaust gas temp.(C )
Eng. speed (rpm)
BTDC 19o BTDC 20o BTDC 21o BTDC 22o BTDC 23o
Fig. 13 Comparison of Exhaust gas temperature with various injectiontiming
1000 1200 1400 1600 1800 2000 2200 150
200 250 300 350 400 450 500 550
Exhaust gas temp.(C )
Eng. speed (rpm)
trial eng. 22.5MPa, 1/2 Load trial eng. 22.5MPa, 4/4 Load trial eng. 23.5MPa, 1/2 Load trial eng. 23.5MPa, 4/4 Load