Review Article
Magnetic Resonance Imaging: Historical Overview, Technical Developments, and Clinical Applications
Geon-Ho Jahng1 , Soonchan Park1 , Chang-Woo Ryu1 , Zang-Hee Cho2
1Department of Radiology, Kyung Hee University Hospital at Gangdong, College of Medicine, Kyung Hee University, 2Neuroscience Convergence Center, Korea University, Seoul, Korea
Received 29 May 2020 Revised 1 August 2020 Accepted 1 September 2020
Corresponding author Geon-Ho Jahng ([email protected]) Tel: 82-2-440-6187 Fax: 82-2-440-6932
The authors congratulate the cerebrations for the 30 years of the Korean Society of Medical Physics (http://www.ksmp.or.kr/). The paper is published to recognize the anniversary. Geon-Ho Jahng invited Professor Z. H. Cho to join to submit this manuscript because he has been one of the leaders in the field of magnetic resonance imaging (MRI) during the last 40 years. In this review, we describe the development and clinical histories of MRI internationally and domestically. We also discuss diffusion and perfusion MRI, molecular imaging using MRI and MR spectroscopy (MRS), and the hybrid systems, such as positron emission tomography一MRI (PET一MRI), MR-guided focused ultrasound surgery (MRgFUS), and MRI-guided linear accelerators (MRI-LINACs). In each part, we discuss the historical evolution of the develop ments, technical develop ments, and clinical applications.
Keywords: Magnetic resonance imaging, History, Technical development, Clinical application, Review
Copyright © 2020 Korean Society of Medical Physics
CCThis is an Open-Access article distributed under the terms of the Creative Commons Attribution Non-Commercial License (http://creativecommons.org/licenses/by- nc/4.0) which permits unrestricted non-commercial use, distribution, and reproduction in any medium, provided the original work is properly cited.
History of Magnetic Resonance Imaging
1. International contributions
The first nuclear magnetic resonance (NMR) signals from a living animal were acquired from an anesthetized rat in 1968 [1]. The capability of NMR to differentiate tumors from normal tissue was reported by Damadian in 1971 [2]. Magnetic resonance imaging (MRI) was developed by Lauterbur [3] based on the encoding spatial information of NMR signals with magnetic field gradients. The first cross- sectional image of a living mouse was published in 1974 by Lauterbur [4]. The echo-planar imaging (EPI) technique was developed by Mansfield [5]. The first MRI body scan of a human being was performed by Damadian in 1977 [6]. For their efforts, Paul C. Lauterbur and Peter Mansfield
were awarded the Nobel Prize in Physiology and Medicine in 2003 in justification of the fundamental importance and applicability of MRI in medicine. The k-space was patented by Richard S. Likes in U.S.A (#U.S. Patent 4,307,343). The first clinical MRI system was installed in the early 1980s.
The first whole-body MRI scanner was developed in Korea in 1982 and was commercialized in 1984 by Goldstar (Seoul, Korea). At same time, another whole-body MRI system was built at the University of Aberdeen and was used at St. Bar- tholomew’s Hospital (London, UK) in 1983. Superconduct- ing MRI was developed and it was clinically used in 1985 to 1988 at Siemens (Erlangen, Germany), General Electric (GE, Boston, MA, USA), and Goldstar. Fig. 1 shows the timeline of MRI developments and a summary of the major contri- butions achieved internationally and domestically.
Progress in Medical Physics 31(3), September 2020 https://doi.org/10.14316/pmp.2020.31.3.35 eISSN 2508-4453
2. Domestic contributions
The first MRI system was developed by the Korean Ad- vanced Institute of Science and Technology (Daejeon, Korea), and was installed in Shin Hwa Hospital (Shin Hwa Nursing Hospital, Seoul, Korea) in 1984. This MRI scanner used a 0.2 T permanent magnet. Therefore, its use for clini- cal studies was limited considerably at that time. The first commercial MRI (Spectro-20000; Goldstar) was installed in Seoul University Hospital (Seoul, Korea) in 1987. This MRI system was a 2.0 Tesla superconductivity magnet. Dur- ing this period, GE, and Siemens also developed the 1.5 T superconductive MRI systems. In 1990, the first animal 4.7 T MRI system (Biospec, Bruker, Switzerland) was installed in Seoul’s Asan Joong Ang Hospital (Asan Medical Center, Seoul, Korea). Among the many incremental developments in MRI in Korea, one of the notable progresses made dur- ing the early 21st century was the development of ultrahigh field (UHF) 7.0 T MRI and its applications [7-11]. Another notable worldwide research activity was the development of the hybrid positron emission tomography–MRI (PET–
MRI) system. Since the introduction of the UHF (7.0 T) MRI system in Korea, an effort was initiated for the construction of a hybrid system with 7.0 T MRI and PET that led to the development of one of the world’s most advanced PET–MRI systems in 2007. With these developments, a number of
neurotransmitter studies was initiated to study the seroto- nergic distribution in the brainstem in vivo [7,8]. Another new and interesting development with UHF 7.0 T MRI was the super-resolution tractography initiative with resolution down to 200 µm [12].
3. Development of basic imaging contrast
In 1950, spin echoes and free induction decay were de- tected by Hahn [13,14]. Therefore, the spin echo (SE) is commonly referred to as Hahn’s echo. MR angiography was developed by Charles L. Dumoulin and Howard R. Hart at the General Electric in 1986 (“Blood-flow checker”. Popular Science: 12. 1987). The fluid attenuation inversion recovery (FLAIR) pulse sequence that yields high-signal regions in normal white matter, was demonstrated by Hajnal et al. in 1992 [15]. Blood Oxygen Level Dependent signal was recog- nized by Ogawa [16] at AT&T Bell labs in 1990. Susceptibili- ty-weighted imaging (SWI) was developed by Reichenbach et al. [17] at Washington University in 1997.
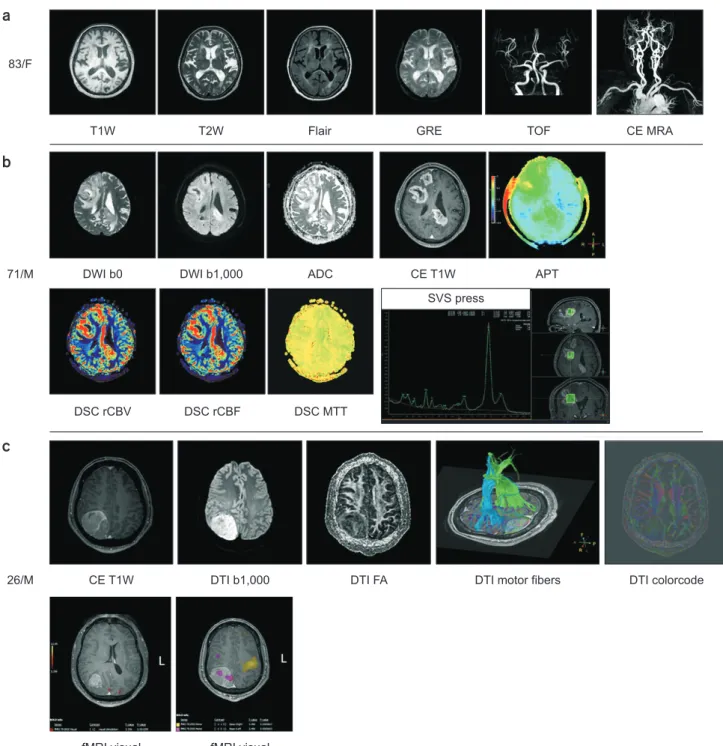
Fig. 2 shows patient cases that demonstrate the use of im- aging contrast agents acquired from a 83-year-old female, 71-year-old male, and from a 26-year-old male with a 3 T MRI system.
Fig. 1. Timeline of MRI developments and summary of the major contributions. MRI, magnetic resonance imaging; M, magnetic; R, resonance; I, imaging; F, functional; NMR, nuclear magnetic resonance; BOLD, blood oxygen level-dependent; NIH, National Institutes of Health; PET, positron emission tomography; MRI–LINAC, MRI-guided linear accelerators.
(1973) Paul Lauterbur, publish generating images using NMR gradients (1924) By Pauli,
nuclear particles have angular momentum (spin)
(1937) By Rabi, measurement of magnetic moment of nucleus, "magnetic resonance"
(1946) Edward Purcell, matter absorbs energy at a resonant frequency
(1946) Felix Bloch, nuclear precession can be measured in detector coils
(1959) Singer, measurement of blood flow using NMR (in mice) (1972) Damadian, patent idea for large NMR scanner to detect malignant tissue
(1975) Ernst, develop 2D-Fourier transform for MR (1985) Insurance reimbursements for MRI exams begin
(1990) Ogawa and colleagues, obtain functional images using BOLD contrast
(2005) UHF 7.0 T MRI developed by Harvard, NIH, Gachon, and Magdeburg
(2008) PET MRI developed
(2012) 11.7 T MRI developed
(2014) developed
MRI LINAC
(1944) Rabi, award Nobel Prize in Physics
(1952) Purcell and Bloch, shareNobel Prize in Physics
(1973) Peter Mansfield, published gradient approach to MR
(1980s) 1.5 T and 2.0 T developed by Goldstar, GE, and Siemens superconducting MRI
(2003) Lauterbur and Mansfield, shareNobel Prize in Physiology and Medicine
1920 1930 1940 1950 1960 1970 1980 1990 2000 2010 2020
M R I NMR becomes MRI f
Timeline of MRI
Fast Imaging Techniques
Speed is always important to clinical practice. Fast MRI
techniques were introduced and were based on the use of multiple refocusing pulses, commonly referred to as turbo spin-echo (TSE) imaging or turbo gradient-echo imaging.
Fig. 2. Patient cases to show imaging contrasts acquired from (a) 83-year-old female, (b) 71-year-old male, and (c) 26-year-old male using a 3 T MRI system. F, female; M, male; T1W, T1-weighted; T2W, T2-weighted; FLAIR, fluid attenuated inversion recovery; GRE, gradient-echo;
TOF, time of flight; CE MRA, contrast-enhanced magnetic resonance angiography; DWI b0, diffusion-weighted image with b=0 s/mm2; DWI b1000, diffusion-weighted image with b=1000 s/mm2; ADC, apparent diffusion coefficient; CE T1W, contrast-enhanced T1-weighted;
APT, amide proton transfer; DSC rCBV, dynamic susceptibility contrast relative cerebral blood volume; DSC rCBF, dynamic susceptibility contrast relative cerebral blood flow; DSC MTT, dynamic susceptibility contrast mean transit time; SVS, single voxel spectroscopy; DTI b1000, diffusion tensor imaging with b=1000 s/mm2; DTI FA, diffusion tensor imaging fractional anisotropy; fMRI, functional MRI.
83/F
71/M
26/M
T1W T2W Flair GRE TOF CE MRA
DWI b0 DWI b1,000 ADC CE T1W APT
SVS press
DSC rCBV DSC rCBF DSC MTT
CE T1W DTI b1,000 DTI FA DTI motor fibers DTI colorcode
fMRI visual fMRI visual
a
b
c
Rapid Acquisition with Refocused Echoes (RARE) tech- nique was commercially implemented after Hennig [18]
described it in 1986. In this sequence, the echo train length (ETL), also known as the turbo factor, denotes the number of echoes acquired at a given repetition time (TR). Spiral sequences were introduced in 1986 by Ahn et al. [19].
1. Technical developments
Several pulse sequences for fast imaging were developed, such as TSE or turbo field echo, half-Fourier, single-shot turbo spin echo (HASTE), gradient and spin echo (GRASE), balanced steady-state free-precession (bSSFP), EPI, and spiral [20]. First, the principle of operation of TSE or RARE sequences was based on the filling of many k-space lines after every radiofrequency (RF) excitation that reduced the MR scan time by reducing the number of RF excitations required for each image [21]. Second, HASTE was a single- shot version of the TSE technique [22] wherein slightly more than half the total number of required phase encoding lines of the k-space were acquired after a single RF excitation.
Third, turbo gradient spin echo or GRASE, is a turbo SE se- quence with additional phase encoding gradient echoes be- tween successive 180° refocusing pulses [23]. Fourth, bSSFP is a gradient-echo sequence that accomplishes fast acquisi- tions by eliminating idle times [24]. In the most common case, the data are mapped line-by-line from the top to bot- tom parts of k-space in a lexicographic manner, commonly referred to as Cartesian sampling. Fifth, EPI allows the col- lection of all the data required to reconstruct an image after a single RF excitation [25] and spiral imaging acquires data using two oscillating gradients that create a spiral trajectory in k-space [19]. The single-shot approach of EPI or spiral is the fastest with a subsecond acquisition time. Therefore, these techniques are usually used in functional MRI (fMRI).
Furthermore, radial trajectories have also been introduced [26].
Several reconstruction methods were also developed to achieve higher signal-to-noise ratios (SNR) and reduced scan times. Parallel imaging techniques in conjunction with the use of phased array coils have been developed to reduce scan times by acquiring a reduced amount of k-space data with an array of receiver coils. These techniques include
the simultaneous acquisition of spatial harmonics (SMASH) [27], sensitivity encoding (SENSE) [28], and generalized auto-calibrating partially parallel acquisitions (GRAPPA) [29]. SENSE is based on reconstruction in the imaging do- main, but GRAPPA is based on k-space domain reconstruc- tion. These parallel imaging techniques are being further developed nowadays [30]. Recently, multiband excitation imaging and finger printing imaging techniques have been developed to reduce the scan times even further.
The simultaneous multislice (SMS) pulse sequence [31]
applies a multiband composite RF pulse with a slice-selec- tive gradient to simultaneously excite multiple slice planes [32]. The multiband technique is simultaneous image re- focused (SIR) EPI or simultaneous echo refocused (SER) EPI that does not use parallel imaging and coil sensitivity for image separation [33]. Another recently developed fast imaging technique is magnetic resonance fingerprinting (MRF) [34]. This technique allows simultaneous and ef- ficient measurements of multiple tissue properties with one acquisition [35]. In MRF, the acquisition parameters, such as the RF excitation angle, phase, repetition time, and k-space sampling trajectory, are varied throughout the acquisition. When implemented properly, this acquisition could generate a unique signal time course for each tissue.
For every MRF sequence, the dictionary of signal evolutions can be generated on a computer using mathematical algo- rithms to predict spin behavior and signal evolution during the acquisition.
2. Clinical applications
Ultrafast imaging is used to eliminate the effects of physi- ological motion, thus capturing dynamic events in real time or shortening the total scan time. Shortening the scan time helps improve patient comfort and compliance, thereby minimizing motion during scans [36]. At higher imaging speeds, it becomes feasible to examine a wide range of rel- evant physiological processes or to freeze induced motion that may otherwise lead to artifacts. Relevant physiological processes include, among others, respiration [37], cardiac rhythm [38], and hemodynamics from neuronal activation [39]. For example, ultrafast imaging is often used in cardio- vascular imaging [40,41].
SENSE or GRAPPA are commonly used in the clinical practice nowadays. Multiband technique is used in fMRI.
However, there is always an inherent trade-off between im- aging speed and quality. MRF was initially evaluated in brain relaxometry [35], prostate [42], liver [43], cardiac [44], mus- culoskeletal imaging [43], arterial spin labeling (ASL) perfu- sion measurement [45], and microvascular properties [46].
Diffusion MRI
A diffusion process is described by Fick’s law. Einstein described the relationship between the mean-squared dis- placement and diffusion coefficient in Brownian motion [47]. Diffusion is dependent on concentration, pressure, and temperature (https://en.wikipedia.org/wiki/Diffusion).
Diffusion MRI is currently a well-established technique that is used in routine clinical practice to identify lesions and to characterize them. Diffusion MRI was developed by Le Bihan in 1989 [48]. Diffusion tensor imaging (DTI) and fiber tractography were developed by Peter Basser and Le Bihan in the early 1990s [49-51]. The diffusion coefficient for water at 37°C is approximately D=3×10⁻⁹ m2/s.
1. Technical developments
Diffusion-weighted imaging (DWI) was developed to in- vestigate microstructural properties by evaluating the pro- ton diffusion process. The technique is used to characterize the microscopic behaviors of protons noninvasively. The diffusion coefficient or apparent diffusion coefficient (ADC) is measured on the basis of the use of diffusion gradients around the refocusing pulse in the SE sequence, or the use of bipolar gradients in the gradient-echo sequence within the echo time (TE) time period, and is fitted by the mono- exponential decay curve [50].
S=S0e–b D
where b is the b-factor that can be calculated using the strength of the applied diffusion gradient, the duration of the diffusion gradient, and the duration of the period be- tween two diffusion gradients.
A two-compartment model was applied to measure diffu-
sion from intracellular and extracellular compartments, re- spectively referred to as slow (Dslow) and fast (Dfast) diffusion with the corresponding volume fractions Fslow and Ffast [52].
S=S0 [Ffast e–b Dfast+Fslow e–b Dslow]
The intravoxel incoherent motion (IVIM) method was introduced to separate diffusion from flow effects in a voxel [50]. In this technique, the flowing vascular volume frac- tion of incoherently flowing blood in the tissue (F), pseudo- diffusion coefficient (D*) associated to the IVIM effect, and true diffusion coefficient (D) can be measured by applying multiple b-values.
S=S0 [Fflow e–b D*+(1–Fflow)e–b D]
Because in vivo proton movement is not isotropic, aniso- tropic diffusion was introduced by assuming ellipsoidal diffusion, known as DTI [51]. The diffusion coefficient in the DTI model is a 3×3 symmetric matrix. Eigenvalues and eigenvectors can be extracted from the tensor matrix to calculate the isotropic diffusion effects by using the mean diffusivity (MD=(Dxx+Dyy+Dzz)/3), and anisotropic diffusion effects by using fractional anisotropy (FA) index that repre- sents the variance of the three eigenvalues divided by norm of the eigenvalues.
Tensor models can be applied by assuming Gaussian distributions of proton movements. However, in biologi- cal structures, water molecular diffusion is hindered in the extra-axonal space and restricted in the intra-axonal space [53]. To take this effect into account, other models were introduced, such as the ball-and-stick model [54], Q-ball imaging (QBI) [55], diffusion spectrum imaging (DSI) [56], spherical deconvolution model [57], and neurite orienta- tion dispersion and density imaging (NODDI) [58]. Fur- thermore, non-Gaussian diffusion kurtosis imaging, was applied in clinical studies [59].
Finally, tractography techniques were introduced to de- tect white matter fiber bundles by measuring the eigenvec- tors along the fibers [60,61]. Improvements of fiber tracking were further achieved by using probabilistic models [62].
Tractography is currently used to investigate white matter connectivity in healthy brains and in several pathologic
conditions [63].
2. Clinical applications
Diffusion MRI techniques, including DWI, DTI, and tractography, are currently extensively used in clinical set- tings. DWI is routinely applied in stroke and tumor patients.
Diffusion indices of MD and FA are altered in the presence of ischemic injury [64] and in neoplasms [65]. In brain neoplasms, ADC values have been shown to be decreased in highly cellular tumors, such as central nervous system (CNS) lymphoma, medulloblastoma, and high-grade glioma [66]. Diffusion imaging techniques were applied in Alzheimer’s disease [67-71]. Furthermore, malignant lesions have lower ADC values compared with surround- ing normal tissue, edema, and benign tumors in the brain, head and neck malignancies, prostate, and liver cancer [72].
Diffusion-weighted whole-body imaging with background suppression (DWIBS) was performed with the short tau inversion recovery (STIR) EPI sequence with a high b value for background suppression to evaluate metastatic lesions in the body [73]. DTI was used to evaluate dislocation, dis- ruption, infiltration, and edema. Tractography was used to evaluate corticospinal tract fibers, optic radiation fibers, and language fibers in patients to perform presurgical plan- ning in neoplastic brain tumor cases.
Perfusion MRI
Perfusion refers to the delivery of blood to a capillary bed in tissue. This is different compared with bulk flow motion (https://en.wikipedia.org/wiki/Perfusion). August Krogh first described the mechanism of regulation of capillaries in muscle, and was awarded the Nobel Prize in Physiology or Medicine [74]. Perfusion MRI is categorized according to the use of a contrast agent or not. Dynamic-susceptibility- contrast (DSC)-based perfusion MRI was developed by Villringer et al. in 1988 [75]. The ASL technique was devel- oped by Koretsky in 2012 [76].
1. Technical developments
Details of perfusion MRI were summarized in a previous
paper [77]. Three important techniques are currently used in clinical practice to obtain perfusion-related parameters.
The first-pass DSC-enhanced MR perfusion is based on the susceptibility effects of gadolinium-based contrast agents on the signal echo. Therefore, T2- or T2*-weighted imaging sequence, usually a gradient-echo or an EPI sequence, is used to obtain the signal attenuation of the time-series im- ages. Cerebral blood volume (CBV) and flow (CBF) values as well as time-related parameters, such as the mean transit time (MTT) and time-to-peak can be mapped in each pixel.
Convolution theory is used to evaluate the measured con- centrations of the hemodynamic changes of the contrast agent as follows [78],
-
where Ca(t) is the measured arterial input function (AIF) that describes the shape of the tracer that enters a voxel, and R(t-t’) is the unknown residue function that describes the probability of the tracer entering a voxel. Therefore,
∞ ∞ ∞
, and CBF=CBV/MTT.
The dynamic contrast-enhanced (DCE) MR perfusion is based on the relaxivity effects of gadolinium-based contrast agents on the signal echo. Therefore, a transverse relax- ation (T1)-weighted imaging sequence (usually a three- dimensional sequence), is used to obtain signal increments of time-series images. The area under-the-curve can be mapped. Furthermore, a pharmacokinetic model is used to map permeability-related parameters such as Ktrans and Kep and the corresponding volume fractions such as vp and ve. The general equation used to express the hemodynamic event after injecting the contrast agent is expressed with the extended Tofts model as follows [79],
- -
where Cp(t) is the concentration of contrast agent in blood, Ktrans is the permeability–surface area constant from the vas- cular to the extracellular space, and ve is volume fraction in
the extravascular and extracellular space.
The ASL MR perfusion is based on an endogenous con- trast agent using magnetically labeled arterial blood water as a diffusible flow tracer. Therefore, the proton-density- weighted sequence is used to obtain signal changes with and without the use of magnetically labeled blood by either continuous or pulsed RF pulses. CBF value can be quanti- fied. A general kinetic model for the evaluation of the differ- ence of the longitudinal magnetization in the tissue owing to the labeled blood can be expressed to quantify the blood flow as follows [80],
- -
where M0b is the equilibrium magnetization in a blood filled arterial voxel, Ca(t) is the delivery function, such as AIF, R(t-t’) is the residue function that describes the wash- out of tagged spins from a voxel, and m(t-t’) includes the longitudinal magnetization relaxation effects. The pseudo- continuous ASL (pCASL) technique was introduced to im- prove the ASL signals [81], and is currently used in clinical practice.
2. Clinical applications
Perfusion MRI is a promising tool used to assess stroke, tumors, and neurodegenerative diseases. DSC perfusion MRI is the standard technique used to evaluate brain dis- eases, such as stroke [82] and tumors [83]. A combination of perfusion and DWI is used to evaluate a mismatch between the size of a perfusion defect and the diffusion abnormality that is referred to as the ischemic penumbra [84]. Tumor grade, recurrence, postoperative changes, or radiation ef- fects can be established with DSC perfusion imaging [85].
DCE perfusion MRI is often applied in brain diseases [86]
and in patients with breast, prostate, pelvic, and muscle dis- eases, and can be useful in differentiating between tumor recurrence and radiation necrosis. The DCE parameters reflect a more extensive BBB disruption and a higher tumor grade [87], evaluate the treatment prediction [88], and dif- ferentiate pseudo-progression from true progressive disease in GBM patients [89].
ASL perfusion MRI is mainly applied in brain diseases,
such as neurodegenerative [90,91], renal, and cardiovascu- lar diseases. ASL perfusion MRI has been used to evaluate pseudo-progression in brain tumor [92]. This method is particularly useful for patients with poor intravenous ac- cess, infants and children, and pregnant women [93].
Molecular MRI/MR Spectroscopy
MR spectroscopy (MRS) is used to determine the mo- lecular structure of compounds, or to detect their presence.
Proton MRS is based on the proton’s magnetic moment and its interaction with magnetic fields. MRS is thus sensitive to certain aspects of tissue metabolism. Proton MRS can detect N-acetyl aspartate (NAA), creatine/phosphocreatine (Cr/PCr), choline (Cho), glucose (Glu), myoinositol (ml or mlns), lactate (Lac), alanine (Ala), glutamate and glutamine (GIx), citrate, and ethanol in the human body. MRS can detect other nuclei in compounds of biological interest, such as phosphorus-31 (found in PCr) or carbon-13 (found in glycogen). However, proton MRS is more routinely per- formed in clinical practice compared with 31P or 13C MRS.
Therefore, in this review, we only discuss proton MRS.
Chemical exchange saturation transfer (CEST) is a novel MR technique that enables molecular imaging to obtain certain compounds at concentrations that are too low to impact the contrast of standard MRI and too low to be di- rectly detected in MRS at typical water imaging resolutions.
1. Technical developments of MRS
1) Pulse sequences
A single voxel spectroscopy (SVS) study is performed with short or long TE values. The SVS pulse sequences are the following: point resolved spectroscopy (PRESS) [94], stimu- lated echo acquisition mode (STEAM) [95], image selected in vivo spectroscopy (ISIS) [96], and depth-resolved spec- troscopy (DRESS) [97]. Longer TE results in the signal de- crease as a result of the transverse relaxation (T2) that leads to the alteration of the phase of multiplet signals because of J-coupling [98]. TE values in the range of 135–144 ms are typically used, as this leads to the production of a spectrum in which the doublet signal of Lac with a J-coupling con- stant of nearly 7 Hz is entirely reversed owing to the short
TE and long TR [99].
A spectroscopic imaging is an area of interest. Chemical shift imaging (CSI) is used for multiple-voxel spectroscopic acquisitions. In spectroscopic imaging, phase encoding gradients can be applied in all three dimensions to sample k-space to select a volume that resembles methods used in MRI [100].
2) Water suppression methods
The water resonance must be suppressed to detect the millimolar concentrations of other molecules/moieties. The most common suppression method is based on the use of a chemical shift selected (CHESS) pulse sequence [101].
3) Spectral quantification
The typical postprocessing techniques used include Fou- rier Transform (FT), baseline correction, zero filling, and phasing. Quantification of the MRS signal amplitude can provide a means for estimating the tissue concentration of the signal generating molecules. While MRS signals are usually acquired in the time domain as free induction de- cays or echoes, they are usually viewed and analyzed in the frequency domain. The frequency domain representation is derived from the acquired time domain data by the FT. Sig- nal averaging is used in virtually all MRS studies to increase the SNR by averaging the signals obtained in repeated measurements. To quantify the proton spectrum in most of the clinical studies, the internal reference signal is typically used that is either the Cr signal at 3.05 ppm or the water sig- nal at 4.69 ppm. When Cr is used as a reference signal, it is more common to report results as signal amplitude ratios, such as NAA/Cr, or Cho/Cr. One weak aspect related to the use of the Cr signal as a reference is attributed to the fact that the Cr signal is not as uniform throughout the normal brain [102]. Another weak aspect pertains to the fact that the assumption of the Cr levels do not change with disease and other physiological characteristics may be erroneous. If the water signal is used as a reference signal, its amplitude must be measured by performing a separate measurement in the same brain region without using water suppression.
A linear least-squares optimization procedure has been established and used in spectral fitting techniques. The most popular spectral fitting software is currently the LC-
Model [103,104]. Furthermore, spectrum fitting software is available either in the time [105] or frequency domains [106,107].
2. Molecular imaging tools other than MRS
CEST can be used to apply molecular imaging [108]. This technique is more appropriate compared with CSI or MR spectroscopy imaging because it provides relatively high resolution. The principle of CEST is based on the use of the magnetization transfer effects from other molecules to water molecules. Therefore, the requirement of CEST is that the chemical species must have in their structures a 1H proton that is exchangeable with those of water. Known endogenous diamagnetic CEST agents are involved with exchangeable groups of amide proton (-NH), amine proton (-NH2), and hydroxyl proton (-OH), whose chemical shifts are ~3.5, ~1.8–3.0, and ~0.5–1.5 parts per million (ppm), re- spectively [109]. Amide CEST is usually referred to as amide proton transfer (APT). CEST techniques have been applied to map glutamate (amine proton), creatine (amine proton), glycosaminoglycan (Gag) (hydroxyl proton), myoinositol (MI) (hydroxyl proton), and glucose (hydroxyl proton). The detailed principle of CEST technique has been described in numerous previous papers [110-116].
3. Clinical applications
The goal of clinical spectroscopy is to provide physicians with biochemical information that will assist in the differ- ential diagnosis when standard clinical and radiologic tests fail or are too invasive. Proton spectroscopy has attained clinical value in that it can monitor the evolution of diseas- es and associated therapies. Disease can sometimes lead to large changes in metabolite levels.
MR spectroscopy has also been shown to be of diagnostic value for evaluating and monitoring the progression of cer- tain brain diseases, such as stroke [117], epilepsy, multiple sclerosis [118], Alzheimer’s disease [119,120], brain tumors [121] and other tumors, such as prostate cancer [122] and breast cancer [123]. Lactate signal levels are elevated in ischemic brain tissue. Choline signal levels are elevated in some neoplastic or inflamed tissues.
The main applications for amide CEST or APT are the detection of cancer and ischemic stroke. In tumor regions, the concentration of proteins are elevated compared with surrounding tissues, and thus lead to increased APT levels [124]. This method was applied to classify tumor progres- sion from radiation necrosis [125]. The CEST technique is applied in stroke because reduced pH in the ischemic region leads to lowered APT exchange rate, and results in decreased CEST values [126]. CEST was applied in other- than-brain pathologies, such as breast [127], prostate [128], and knee [129].
Hybrid MRI Systems
1. PET–MRI
PET–MRI is an imaging system that incorporates MRI and PET to gain from the benefits of soft tissue morphological imaging (MRI) and metabolic imaging (PET). This hybrid system is mainly used in the fields of oncology and neurol- ogy for clinical and preclinical studies. Some systems oper- ate in totally separate rooms, but other systems do operate in the same room with separate machines. In these cases, a bed is shared to transfer the subjects from MRI to PET or to fully integrated systems. The first whole-body PET–
MRI systems were produced by Philips (Amsterdam, The Netherlands) and were installed in the US (Mount Sinai Medical Center, New York, NY) and in Switzerland (Geneva University Hospital, Geneva) in 2010. The system featured a PET and MRI scanner separated by a revolving bed. The simultaneous PET–MR acquisition system (Siemens) was installed in 2010. The fully integrated whole-body systems were provided in 2011 by Siemens and in 2014 by GE. In Ko- rea, the first PET–MRI system was installed at the Gachon University Hospital (Inchen, Korea) [7,8].
1) Technical developments
In this part, we only discussed the issues of the fully in- tegrated PET–MRI system. Placing PET detectors in the MR magnet can alter the local magnetic field strength causing the protons to spin at wrong frequencies, thus leading to the formation of severe image distortions and artifacts, such as susceptibility artifacts. The presence of PET hardware
within the gradient coil significantly alters the MR eddy current characteristics of the system possibly leading to degraded spatial linearity. The gradient imperfection would impact imaging spatial resolution and image homogeneity.
The lutetium-based scintillation crystals have acceptable magnetic properties [130]. The avalanche photodiode for PET can be used in a 7 T MRI system without inducing ma- jor effects to magnetic fields [131].
Attenuation correction describes a method to account for the self-absorption of the emitted annihilation pho- tons, and is a prerequisite for accurate quantification of the PET data [132]. It is not possible to directly derive the attenuation properties of tissues from MRI measurements.
MRI-based attenuation correction methods have been in- troduced [133]: segmentation-based [134] that are usually used in T1-weighted images [135] or Dixon-sequence-based images [136], atlas-based [133], and reconstruction-based [137] methods. Attenuation correction of bone is calculated by using ultrashort echo time images [138].
The simultaneous acquisition of MRI and PET data in the fully integrated PET–MRI systems has major advantages compared with sequential acquisitions. Two-dimensional or three-dimensional (3D) navigator MRI is used to correct respiratory motion in PET images [139]. 3D Cine MRI has been used to correct cardiac motion in PET images [140]. A high resolution MRI has been used for the correction of the partial volume effect in PET images [141]. MR-guided PET reconstruction techniques have been developed by incor- porating “a priori” anatomical information from the MRI [142]. Finally, MR anatomical images have been used for aligning functional information obtained from PET [143].
2) Clinical applications
While PET provides a) the high sensitivity required to detect minute amounts of radiotracers and b) the abil- ity to quantify radiotracer activity throughout the body in absolute terms, MRI provides excellent soft-tissue contrast according to multiple contrast mechanisms at high-spatial resolution. Therefore, PET/MRI imaging combines the di- agnostic breadth and information content of both PET and MRI. The PET–MRI system has been used for the study of patients with hepatobiliary cancer [144], neuroendocrine tumors [145], pancreatic adenocarcinoma [146], prostate
cancer [147], primary brain tumors [148], dementia [149], epilepsy [150], musculoskeletal tumor [151], and coronary artery disease [152].
2. MR-guided focused ultrasound surgery
High-intensity focused ultrasound (HIFU) is a noninva- sive therapeutic technique that uses nonionizing ultrasonic waves to heat tissue [153]. HIFU has been combined with MRI to enable guidance of the treatment and monitoring.
It is referred to as MR-guided focused ultrasound surgery (MRgFUS). It is a 3D imaging technique that features high- soft-tissue contrast and provides information about tem- perature, thus allowing the monitoring of ablation. In 1992, reports were published that described MRgFUS on ex vivo muscle tissue [154], and the following year on in vivo tissue [155]. MRgFUS developed by Hynynen [155] was later trans- ferred to InsighTec in Haifa, Israel in 1998. The InsighTec ExAblate 2000 was the first MRgFUS system used to obtain Food and Drug Administration market approval in the US in 2004.
1) Technical developments
In MRgFUS, MR is used for both target localization and in vivo real time monitoring of temperature based on a technique referred to as MR thermometry [155], and for verifying tissue destruction using a postprocessing tool. The thermometric technique of temperature-dependent phase changes in gradient-recalled echo pulse sequences are commonly used to determine the temperature change [156].
The change in temperature is represented as
where Δϕ is the phase change, γ is the gyromagnetic ratio, c is the proton-resonance frequency shift constant (–0.01 ppm/°C) [157], Bo is the main magnetic field strength, and TE is the echo time. For the bone tumors, the calcification issues can be resolved be using susceptibility-weighted MRI to identify calcifications rather than computer tomography.
An ultrashort TE sequence can be used to improve ther- mometry in bone.
2) Clinical applications
Clinical applications of MRgFUS are still limited. MRg- FUS has been used in clinical studies in patients with uter- ine fibroids [158], bone metastases [159], prostate cancer [160], breast cancer [161], and brain diseases, such as brain tumors [162], intractable essential tremor [163], Parkinson’s disease [164], obsessive-compulsive disorder [165], major depressive disorders [166], and neuropathic pain [167].
3. MRI-guided linear accelerator
MRI-guided linear accelerator (MRI–LINAC) is a recently developed and advanced radiation treatment system. As indicating the name, the MRI–LINAC is fully integrated with the MRI for imaging soft-tissue tumors together with LINAC for the radiotherapy to treat cancers throughout the body. The advantage of MRI-based imaging on a linear ac- celerator has superior high-definition image quality, espe- cially for some soft-tissue cancers compared with CT-based imaging in the traditional linear accelerators to visualize the target area and adjacent anatomy for treatment setup and delivery. The first technical prototype MR–Linac was developed and installed in the University Medical Center Utrecht in Utrecht, The Netherlands. Similar types of mea- surements have been performed on a hybrid MRI Cobalt-60 device [168]. The first clinically active MRI-guided radia- tion therapy machine (ViewRay) was installed at the Alvin J. Siteman Cancer Center at Barnes-Jewish Hospital at the Washington University School of Medicine (St. Louis, MO, USA). The treatment of the first patients was announced in February 2014.
1) Technical developments
LINAC is affected by MRI. Two main configurations of MRI–LINAC that are being pursued with the radiotherapy beam are either parallel or perpendicular to the main mag- netic field. This configuration is affected by the interference between the delivery of the radiation beam of LINAC and MRI. The operation of the multileaf collimator in the strong magnetic field can be a problem in the shaping of the X- ray beam [169]. Both configurations have this problem, and vendors lowered magnetic field to minimize this issue.
Another issue in the MRI–LINAC is that the accelerated
electrons used to produce the X-ray beam can be deviated or defocused, thus causing a loss of the beam current. Pre- vious studies showed that the perpendicular configuration is dominant to the total beam loss compared with the par- allel one [170,171]. Skin dose can be increased by second- ary electrons owing to the influence of the magnetic field [172]. In this case, the perpendicular configuration should be advantageous, although the electron return effect can still appear [173]. Receiver coils can cause attenuation of the primary beam and can increase the skin dose. Detailed explanation can be found in another paper [174].
MRI quality is also affected by the LINAC. Any RF noise generated by the LINAC can cause artifacts or noise in im- ages. In addition, LINAC components, such as the accel- erator or multileaf collimators cause inhomogeneity of the main magnetic field, thus worsening the imaging quality [175]. Finally, the radiation beam can affect conductors or electronics in the coil, causing imaging artifacts [176,177].
2) Clinical applications
The MRI-LINAC can adapt the radiation treatment plan based on movement of the organs or tumor, and also track the motion of the tumor. This system reduces complications after radiation treatments. The MRI–LINAC can be used to improve the personalization of the radiation therapy using existing contrast imaging mechanisms, such as diffusion, perfusion, functional, and metabolic, to evaluate treatment effects. The hybrid system has been focused on daily plan changes based on geometric changes in the organs-at-risk [178,179]. Furthermore, MRI has been used to evaluate ra- diation treatment effects [180]. Currently, this hybrid system is used to treat patients with prostate cancer [181], pelvic lymph nodes [182], and the esophagus [183].
Acknowledgements
The research was supported by the National Research Foundation of Korea grant funded by Ministry of Science and ICT (No. 2020R1A2C1004749, GHJ), Republic of Korea.
Conflicts of Interest
The authors have nothing to disclose.
Availability of Data and Materials
The authors confirm that the data supporting the findings of this study are available within the article.
Author Contributions
Conceptualization: Geon-Ho Jahng. Data curation: Geon- Ho Jahng, Soonchan Park, Chang-Woo Ryu, and Zang-Hee Cho. Writing–original drafting: Geon-Ho Jahng. Writing–
review & editing: Geon-Ho Jahng, Soonchan Park, Chang- Woo Ryu, and Zang-Hee Cho.
References
1. Jackson JA, Langham WH. Whole-body NMR spectrom- eter. Rev Sci Instrum. 1968;39:510-513.
2. Damadian R. Tumor detection by nuclear magnetic reso- nance. Science. 1971;171:1151-1153.
3. Lauterbur PC. Image formation by induced local interac- tions. Examples employing nuclear magnetic resonance.
1973. Clin Orthop Relat Res. 1989;(244):3-6.
4. Lauterbur PC. Magnetic resonance zeugmatography. Pure Appl Chem. 1974;40:149-157.
5. Mansfield P, Grannell P. “Diffraction” and microscopy in solids and liquids by NMR. Phys Rev B. 1975;12:3618.
6. Damadian R, Minkoff L, Goldsmith M, Stanford M, Koutcher J. Field focusing nuclear magnetic resonance (FONAR): visualization of a tumor in a live animal. Sci- ence. 1976;194:1430-1432.
7. Cho ZH, Kim YB, Han JY, Kim NB, Hwang SI, Kim SJ, et al.
Altered T2* relaxation time of the hippocampus in major depressive disorder: implications of ultra-high field mag- netic resonance imaging. J Psychiatr Res. 2010;44:881-886.
8. Cho ZH, Lee YB, Kang CK, Yang JW, Jung IH, Park CA, et al. Microvascular imaging of asymptomatic MCA steno- occlusive patients using ultra-high-field 7T MRI. J Neurol.
2013;260:144-150.
9. Cho ZH, Son YD, Kim HK, Kim KN, Oh SH, Han JY, et al.
A fusion PET-MRI system with a high-resolution research tomograph-PET and ultra-high field 7.0 T-MRI for the mo- lecular-genetic imaging of the brain. Proteomics. 2008;8:
1302-1323.
10. Kim M, Kim KE, Jeong SW, Hwang SW, Jo H, Lee J, et al.
Effects of the ultra-high-frequency electrical field radio- frequency device on mouse skin: a histologic and molecu- lar study. Plast Reconstr Surg. 2016;138:248e-255e.
11. Oh SH, Chung JY, In MH, Zaitsev M, Kim YB, Speck O, et al. Distortion correction in EPI at ultra-high-field MRI using PSF mapping with optimal combination of shift de- tection dimension. Magn Reson Med. 2012;68:1239-1246.
12. Richards K, Calamante F, Tournier JD, Kurniawan ND, Sadeghian F, Retchford AR, et al. Mapping somatosensory connectivity in adult mice using diffusion MRI tractogra- phy and super-resolution track density imaging. Neuro- image. 2014;102 Pt 2:381-392.
13. Hahn EL. Spin echoes. Phys Rev. 1950;80:580.
14. Hahn EL. Nuclear induction due to free larmor preces- sion. Phys Rev. 1950;77:297.
15. Hajnal JV, De Coene B, Lewis PD, Baudouin CJ, Cowan FM, Pennock JM, et al. High signal regions in normal white matter shown by heavily T2-weighted CSF nulled IR sequences. J Comput Assist Tomogr. 1992;16:506-513.
16. Ogawa S, Lee TM, Kay AR, Tank DW. Brain magnetic reso- nance imaging with contrast dependent on blood oxygen- ation. Proc Natl Acad Sci U S A. 1990;87:9868-9872.
17. Reichenbach JR, Venkatesan R, Schillinger DJ, Kido DK, Haacke EM. Small vessels in the human brain: MR ve- nography with deoxyhemoglobin as an intrinsic contrast agent. Radiology. 1997;204:272-277.
18. Hennig J, Nauerth A, Friedburg H. RARE imaging: a fast imaging method for clinical MR. Magn Reson Med. 1986;
3:823-833.
19. Ahn CB, Kim JH, Cho ZH. High-speed spiral-scan echo planar NMR imaging-I. IEEE Trans Med Imaging. 1986;5:
2-7.
20. Meyer CH, Hu BS, Nishimura DG, Macovski A. Fast spiral coronary artery imaging. Magn Reson Med. 1992;28:202- 213.
21. Hennig J, Friedburg H. Clinical applications and meth- odological developments of the RARE technique. Magn Reson Imaging. 1988;6:391-395.
22. Kiefer B, Grassner J, I-lausman K. Image acquisition in a second with half fourier acquisition single shot turbo spin echo. J Magn Reson Imaging. 1994;4(P):86.
23. Oshio K, Feinberg DA. GRASE (Gradient- and spin-echo)
imaging: a novel fast MRI technique. Magn Reson Med.
1991;20:344-349.
24. Nayak KS, Hargreaves BA, Hu BS, Nishimura DG, Pauly JM, Meyer CH. Spiral balanced steady-state free preces- sion cardiac imaging. Magn Reson Med. 2005;53:1468- 1473.
25. Mansfield P. Multi-planar image formation using NMR spin echoes. J Phys C. 1977;10:L55.
26. Du J, Lu A, Block WF, Thornton FJ, Grist TM, Mistretta CA.
Time-resolved undersampled projection reconstruction magnetic resonance imaging of the peripheral vessels using multi-echo acquisition. Magn Reson Med. 2005;53:
730-734.
27. Sodickson DK, Manning WJ. Simultaneous acquisition of spatial harmonics (SMASH): fast imaging with radiofre- quency coil arrays. Magn Reson Med. 1997;38:591-603.
28. Pruessmann KP, Weiger M, Scheidegger MB, Boesiger P.
SENSE: sensitivity encoding for fast MRI. Magn Reson Med. 1999;42:952-962.
29. Griswold MA, Jakob PM, Heidemann RM, Nittka M, Jellus V, Wang J, et al. Generalized autocalibrating partially par- allel acquisitions (GRAPPA). Magn Reson Med. 2002;47:
1202-1210.
30. Hamilton J, Franson D, Seiberlich N. Recent advances in parallel imaging for MRI. Prog Nucl Magn Reson Spec- trosc. 2017;101:71-95.
31. Feinberg DA, Setsompop K. Ultra-fast MRI of the human brain with simultaneous multi-slice imaging. J Magn Re- son. 2013;229:90-100.
32. Larkman DJ, Hajnal JV, Herlihy AH, Coutts GA, Young IR, Ehnholm G. Use of multicoil arrays for separation of sig- nal from multiple slices simultaneously excited. J Magn Reson Imaging. 2001;13:313-317.
33. Feinberg DA, Reese TG, Wedeen VJ. Simultaneous echo refocusing in EPI. Magn Reson Med. 2002;48:1-5.
34. Panda A, Mehta BB, Coppo S, Jiang Y, Ma D, Seiberlich N, et al. Magnetic resonance fingerprinting-an overview.
Curr Opin Biomed Eng. 2017;3:56-66.
35. Ma D, Gulani V, Seiberlich N, Liu K, Sunshine JL, Duerk JL, et al. Magnetic resonance fingerprinting. Nature.
2013;495:187-192.
36. Tsao J. Ultrafast imaging: principles, pitfalls, solutions, and applications. J Magn Reson Imaging. 2010;32:252-266.
37. Saini S, Stark DD, Rzedzian RR, Pykett IL, Rummeny E, Hahn PF, et al. Forty-millisecond MR imaging of the ab- domen at 2.0 T. Radiology. 1989;173:111-116.
38. Doyle M, Rzedzian R, Mansfield P, Coupland RE. Dynam- ic NMR cardiac imaging in a piglet. Br J Radiol. 1983;56:
925-930.
39. Glover GH, Lee AT. Motion artifacts in fMRI: comparison of 2DFT with PR and spiral scan methods. Magn Reson Med. 1995;33:624-635.
40. Muthurangu V, Lurz P, Critchely JD, Deanfield JE, Taylor AM, Hansen MS. Real-time assessment of right and left ventricular volumes and function in patients with con- genital heart disease by using high spatiotemporal resolu- tion radial k-t SENSE. Radiology. 2008;248:782-791.
41. Nayak KS, Cunningham CH, Santos JM, Pauly JM. Real- time cardiac MRI at 3 tesla. Magn Reson Med. 2004;51:
655-660.
42. Yu AC, Badve C, Ponsky LE, Pahwa S, Dastmalchian S, Rogers M, et al. Development of a combined MR finger- printing and diffusion examination for prostate cancer.
Radiology. 2017;283:729-738.
43. Cloos MA, Knoll F, Zhao T, Block KT, Bruno M, Wiggins GC, et al. Multiparametric imaging with heterogeneous radiofrequency fields. Nat Commun. 2016;7:12445.
44. Hamilton JI, Jiang Y, Chen Y, Ma D, Lo WC, Griswold M, et al. MR fingerprinting for rapid quantification of myo- cardial T1, T2, and proton spin density. Magn Reson Med.
2017;77:1446-1458.
45. Su P, Mao D, Liu P, Li Y, Pinho MC, Welch BG, et al. Multi- parametric estimation of brain hemodynamics with MR fingerprinting ASL. Magn Reson Med. 2017;78:1812-1823.
46. Christen T, Pannetier NA, Ni WW, Qiu D, Moseley ME, Schuff N, et al. MR vascular fingerprinting: a new ap- proach to compute cerebral blood volume, mean vessel radius, and oxygenation maps in the human brain. Neu- roimage. 2014;89:262-270.
47. Einstein A. Investigations on the theory of the Brownian movement. Chelmsford: Courier Corporation; 1956.
48. Le Bihan D, Breton E, inventor; General Electric CGR SA, assignee. Method to measure the molecular diffusion and/or perfusion parameters of live tissue. United States patent US4809701A. 1989 Mar 7.
49. Howe FA, Filler AG, Bell BA, Griffiths JR. Magnetic reso-
nance neurography. Magn Reson Med. 1992;28:328-338.
50. Le Bihan D, Breton E, Lallemand D, Grenier P, Cabanis E, Laval-Jeantet M. MR imaging of intravoxel incoherent motions: application to diffusion and perfusion in neuro- logic disorders. Radiology. 1986;161:401-407.
51. Basser PJ, Mattiello J, LeBihan D. Estimation of the effec- tive self-diffusion tensor from the NMR spin echo. J Magn Reson B. 1994;103:247-254.
52. Niendorf T, Dijkhuizen RM, Norris DG, van Lookeren Campagne M, Nicolay K. Biexponential diffusion attenu- ation in various states of brain tissue: implications for dif- fusion-weighted imaging. Magn Reson Med. 1996;36:847- 857.
53. Assaf Y, Freidlin RZ, Rohde GK, Basser PJ. New modeling and experimental framework to characterize hindered and restricted water diffusion in brain white matter.
Magn Reson Med. 2004;52:965-978.
54. Behrens TE, Woolrich MW, Jenkinson M, Johansen-Berg H, Nunes RG, Clare S, et al. Characterization and propa- gation of uncertainty in diffusion-weighted MR imaging.
Magn Reson Med. 2003;50:1077-1088.
55. Tuch DS. Q-ball imaging. Magn Reson Med. 2004;52:1358- 1372.
56. Wedeen VJ, Wang RP, Schmahmann JD, Benner T, Tseng WY, Dai G, et al. Diffusion spectrum magnetic resonance imaging (DSI) tractography of crossing fibers. Neuroim- age. 2008;41:1267-1277.
57. Tournier JD, Calamante F, Gadian DG, Connelly A. Direct estimation of the fiber orientation density function from diffusion-weighted MRI data using spherical deconvolu- tion. Neuroimage. 2004;23:1176-1185.
58. Zhang H, Schneider T, Wheeler-Kingshott CA, Alexander DC. NODDI: practical in vivo neurite orientation disper- sion and density imaging of the human brain. Neuroim- age. 2012;61:1000-1016.
59. Jensen JH, Helpern JA, Ramani A, Lu H, Kaczynski K.
Diffusional kurtosis imaging: the quantification of non- gaussian water diffusion by means of magnetic resonance imaging. Magn Reson Med. 2005;53:1432-1440.
60. Basser PJ, Pajevic S, Pierpaoli C, Duda J, Aldroubi A. In vivo fiber tractography using DT-MRI data. Magn Reson Med. 2000;44:625-632.
61. Mori S, Crain BJ, Chacko VP, van Zijl PC. Three-dimen-
sional tracking of axonal projections in the brain by mag- netic resonance imaging. Ann Neurol. 1999;45:265-269.
62. Jones DK. Tractography gone wild: probabilistic fibre tracking using the wild bootstrap with diffusion tensor MRI. IEEE Trans Med Imaging. 2008;27:1268-1274.
63. Bullmore E, Sporns O. Complex brain networks: graph theoretical analysis of structural and functional systems.
Nat Rev Neurosci. 2009;10:186-198.
64. Sotak CH. The role of diffusion tensor imaging in the eval- uation of ischemic brain injury - a review. NMR Biomed.
2002;15:561-569.
65. Alexander AL, Hurley SA, Samsonov AA, Adluru N, Hos- seinbor AP, Mossahebi P, et al. Characterization of cere- bral white matter properties using quantitative magnetic resonance imaging stains. Brain Connect. 2011;1:423-446.
66. Baliyan V, Das CJ, Sharma R, Gupta AK. Diffusion weight- ed imaging: technique and applications. World J Radiol.
2016;8:785-798.
67. Zhang Y, Schuff N, Jahng GH, Bayne W, Mori S, Schad L, et al. Diffusion tensor imaging of cingulum fibers in mild cognitive impairment and Alzheimer disease. Neurology.
2007;68:13-19.
68. Zhang Y, Du AT, Hayasaka S, Jahng GH, Hlavin J, Zhan W, et al. Patterns of age-related water diffusion changes in human brain by concordance and discordance analysis.
Neurobiol Aging. 2010;31:1991-2001.
69. Jahng GH, Xu S, Weiner MW, Meyerhoff DJ, Park S, Schuff N. DTI studies in patients with Alzheimer’s disease, mild cognitive impairment, or normal cognition with evalua- tion of the intrinsic background gradients. Neuroradiol- ogy. 2011;53:749-762.
70. Jahng GH, Xu S. Local susceptibility causes diffusion al- terations in patients with Alzheimer’s disease and mild cognitive impairment. Brain Imaging Behav. 2012;6:426- 436.
71. Jahng GH, Xu S, Kim MJ. Mapping of distributions of a lo- cal b-matrix cross-term strength using diffusion tensor MRI in patients with Alzheimer’s disease. Med Phys. 2012;
39:6324-6331.
72. Charles-Edwards EM, deSouza NM. Diffusion-weighted magnetic resonance imaging and its application to can- cer. Cancer Imaging. 2006;6:135-143.
73. Takahara T, Imai Y, Yamashita T, Yasuda S, Nasu S, Van
Cauteren M. Diffusion weighted whole body imaging with background body signal suppression (DWIBS): technical improvement using free breathing, STIR and high resolu- tion 3D display. Radiat Med. 2004;22:275-282.
74. Larsen EH. [August Krogh (1874-1949): 1920 nobel prize].
Ugeskr Laeger. 2007;169:2878. Danish.
75. Villringer A, Rosen BR, Belliveau JW, Ackerman JL, Lauffer RB, Buxton RB, et al. Dynamic imaging with lan- thanide chelates in normal brain: contrast due to mag- netic susceptibility effects. Magn Reson Med. 1988;6:164- 174.
76. Koretsky AP. Early development of arterial spin labeling to measure regional brain blood flow by MRI. Neuroimage.
2012;62:602-607.
77. Jahng GH, Li KL, Ostergaard L, Calamante F. Perfusion magnetic resonance imaging: a comprehensive update on principles and techniques. Korean J Radiol. 2014;15:554- 577.
78. Ostergaard L, Weisskoff RM, Chesler DA, Gyldensted C, Rosen BR. High resolution measurement of cerebral blood flow using intravascular tracer bolus passages. Part I: Mathematical approach and statistical analysis. Magn Reson Med. 1996;36:715-725.
79. Tofts PS. Modeling tracer kinetics in dynamic Gd-DTPA MR imaging. J Magn Reson Imaging. 1997;7:91-101.
80. Buxton RB, Frank LR, Wong EC, Siewert B, Warach S, Edelman RR. A general kinetic model for quantitative per- fusion imaging with arterial spin labeling. Magn Reson Med. 1998;40:383-396.
81. Dai W, Garcia D, de Bazelaire C, Alsop DC. Continuous flow-driven inversion for arterial spin labeling using pulsed radio frequency and gradient fields. Magn Reson Med. 2008;60:1488-1497.
82. Keir SL, Wardlaw JM. Systematic review of diffusion and perfusion imaging in acute ischemic stroke. Stroke. 2000;
31:2723-2731.
83. Cha S, Knopp EA, Johnson G, Wetzel SG, Litt AW, Zagzag D. Intracranial mass lesions: dynamic contrast-enhanced susceptibility-weighted echo-planar perfusion MR imag- ing. Radiology. 2002;223:11-29.
84. Ostergaard L, Sorensen AG, Chesler DA, Weisskoff RM, Koroshetz WJ, Wu O, et al. Combined diffusion-weighted and perfusion-weighted flow heterogeneity magnetic