DOI : http://dx.doi.org/10.5394/KINPR.2019.43.6.450
Study on the Relationship and Validity of the Management Evaluation Factors in Public Firms With a Focus on the Port Authorities
Sung-Yhun Lee*․†Ki-Myung Ahn
*Assistant Professor, School of Port and Logistics, Kaya University, Gimhae 50830, Korea
†Professor, Division of Shipping Management, Korea Maritime and Ocean University, Busan 49112, Korea
Abstract : According to the results of the management evaluation of the nation’s public firms over the past seven years, the rating of the port corporation is generally insufficient. According to the results of the seven-year study 2011-2017, the average debt ratio of the port corporation was 34.5%, two to three times lower than that of the general public company, the operating profit ratio of sales was three times higher, and the value added per person was 1.6-1.9 times better. However, the aggregate score and grade were generally low, with 4.1% of the total number of employees of the general public corporation, 10% of the average total assets, and 1% of the average sales volume. The distributed analysis results and panel return analysis results show that the size significantly impacts the overall score and grade. Additionally, major business standards such as port volume, not controlled by the port corporation, appear to have a decisive influence on the low grade of the port corporation. Thus, it appears that improvement and supplementation of key business indicators of port construction are urgently needed in the management evaluation system, which can be properly controlled.
Key words : Public Firm, Port Authorities, Management Performance Evaluation, Analysis of Variance, Panel Regression Analysis, T-Test
†Corresponding author, [email protected] 051)410-4385
* [email protected] 055)330-1197
1. Introduction
The korean management evaluation system of public firms objectively evaluates the performance of public institutions in the previous year and links the results to executive personnel and employee performance. This system was first implemented by the Ministry of Economy and Finance in 1984 as a system to induce publicity, efficiency and responsible management of public institutions. Although the management evaluation system was introduced by the enactment of the Government Investment Management Framework Act in 1984, it was not organized as a performance management tool for public firms due to incomplete evaluation organization and manpower composition, evaluation procedure, evaluation index system, and incentive system(Park, S.H., 2006). Since 1998, many improvements have been made throughout the management system of public firm, including management evaluation systems such as evaluation indexes and utilization systems, but the effects of the system change were somewhat limited due to limitations in data and environmental factors(Park, 2006). Under the Act on the operaten of Public Institutions enacted in 2007, the government classified public institutions established and operated under the government's investment, investment, or
government financial support as public firms, quasi-government organizations, and other public agencies, and sought to change the system of management of public firms. In other words, the government intended to induce public firms to innovate their management and improve productivity based on specific performance indicators.(Kim, J.K, 2001). This has led to the gradual development of the management evaluation system as a means to induce efficient performance management of public firms. 그And it was recognized that by promoting learning and competition, it could contribute to organizational performance and improvement.(Oh, 2003; Kwak, 2003). This management evaluation system gradually reduced the management system of state-owned firm through proactive and bureaucratic control in a way to expand autonomous responsibility management. And performance management could be established in a post-apartheid way.(Park, 2006).
As such, the management evaluation system of public
firm has continuously improved since 1984, but the
diversity of the purpose of establishment and environmental
characteristics has not been fully reflected in the
management evaluation index. In particular, port firms with
relatively few years or sizes are increasingly exposed to
problems that are considered disadvantageous. Lee and
Ahn(2013). Therefore, the purpose of this study was to
Authorities provide improvement measures for evaluation problems by diagnosing the relevance and validity of the indicators between the current management evaluation indexes and scores of public firm. The purpose of this research is to present improvement measures with emphasis on PA and public firm.
2. Theoretical Background
According to Article 48 of the Act on the Operaten of Public Institutions, “The purpose of this service is to improve public service and management efficiency and to provide professional consulting on matters that need improvement”(the Ministry of Economy and Finance, 2011) Management evaluations are being conducted on public firm. The purpose, necessity, and evaluation criteria of management evaluation of state-owned firm were first studied by the Korea Development Institute in 1987.
According to this report, the purpose of the management evaluation is to induce total improvement in the management of public firm by setting an indicator of the goals and directions to be achieved by public firm in advance, and by assessing their performance at a later date and taking responsibility for compensation and liability.
However, unlike private firms, public firm managers have serious problems with inefficient management such as lax management and rigidity in decision-making. Therefore, it suggests that management evaluation is necessary to control and improve this. The theory of neo-institutionalism explains the inefficiency of management of state-owned firm as a matter of property rights, agency theory, X-Inefficiency and market failure theory.
The final owner of a public corporation is the people, but because the people cannot manage it themselves, it is called an ownerless firm. The ownership characteristics of such a public entity create a agency problem, which results in lower performance of the public entity.
X-efficiency(Leibenstein) refers to the inefficiency that results from lax management and lax management of the organization's members in the effort to pursue management efficiency or in the reduction of incentives, a concept similar to moral hazard in agency theory. Problems of X-efficiency arise due to excessive costs due to the complacent working posture and risk-averse behavior of executives and employees of public firm. This can be said to be preventing public firms from functioning efficiently.(Oh and Jang, 2003).
According to the market failure theory of C. Wolf, the conditions for demand and supply for public sector activities indicate the failure of the public sector in the form of additional costs, internal effects and derivative externalities.
In other words, the vast internal organization and personnel of public firm, the establishment of excessive subsidiaries, and the lax management of excess production and over-investment are shown.(Shin, 2011). Therefore, the management evaluation system has developed as a post-performance management system to solve the above problems and provide appropriate information for management decision making, to promote management innovation and secure the responsibilities of the organization. Also, public firms are run by appointed managers who take responsibility for the appointees, so there is a high possibility of political intervention in the management process and political motivation taking precedence. Therefore, it was emphasized that it is desirable to control the performance of the management in a follow-up manner, not to interfere in the management process in detail, for efficient management(Park, 2006).
As a prior study, prescriptive and empirical studies have been conducted on the necessity, usefulness and improvement measures of the management evaluation system. In relation to this research, the recent empirical research conducted on the usefulness and improvement measures of the management evaluation system of public firm is as follows.
Choi and Park(2009)'s research analyzed the evaluation results between 2001 and 2005. According to the analysis, no significant improvement was found in terms of comprehensive management, major business and management. This suggests that the current management evaluation system of public firm does not properly grasp the efficiency of public firms and that the evaluation system and evaluation index have limitations.
An(2014)'s study analyzed the relevance between the
comprehensive evaluation scores of public firms and
quasi-government organizations between 2008 and 2012 and
the scores of non-metering and metric indices by evaluation
category (leadership, responsibility management,
management efficiency, and major projects). According to
the analysis results, management efficiency category scores
by evaluation category and non-metric index scores have a
significant impact on the final overall evaluation score. In
addition, the larger the size of the institution, the higher the
profitability, growth rate, and the longer the agency's chief
executive's tenure, the higher the overall score of management evaluation. In the leadership, accountability, and major projects, the size and profitability of the institution were significantly shown, and in the management efficiency category, the financial characteristics (profitability, activity, growth) were significantly shown. It has demonstrated that non-criticality scores are high in cases where institutions are large and belong to market-type public firms. However, the higher the profitability, activity and growth, the higher the index score and the lower the index score for semi-market-type public firm.
3. Size․Financial rate of PA
3.1 Comparison of Size between PA and Public firm
Busan Port Authority(BPA)'s total employees for 2017 stood at 223, an annual increase of 7% compared to 149 in 2011 The total number of employee in 2017 at Incheon Port Authority(IPA), Yeosu Gwangyang Port Authority(YGPA) and Ulsan Port Authority(UPA) increased by 9.4%, 8.3%
and 14.4%, respectively, compared to 199, 109 and 78 in 2011, respectively. The average total number of employees at the four PA increased 9% annually to 174 in 2017, compared with 104 in 2011. During the seven years, the average employees of the four PA was 142, which is only 4.1% for market-type(Public firmⅠ:Pub.Ⅰ) and semi- market-type(Public firmⅡ:Pub.Ⅱ) public firms.
PA BPA IPA YGPA UPA Average staff Contrast(%)
Pub.Ⅰ Pub.Ⅱ Pub.Ⅰ Pub.Ⅱmean 181 199 109 78 3,475 3,444 4.1 4.1
2011 149 139 83 45 3,076 3,215 3.4 3.2 2012 149 177 83 57 3,194 3,298 3.6 3.5 2013 177 187 110 71 3,334 3,331 4.1 4.1 2014 185 212 115 86 3,494 3,461 4.3 4.3 2015 185 216 118 93 3,577 3,491 4.3 4.4 2016 200 221 119 94 3,752 3,570 4.2 4.4 2017 223 238 134 101 3,894 3,742 4.5 4.6
CAGR 7.0 9.4 8.3 14.4 4.0 2.6
Table 1 Contrast of Average staff between PA and Public firm (unit: person, %)
BPA's total assets in 2017 totaled 5.62 trillion won, up 2% annually from 5.27 trillion won in 2011. The total assets of the IPA, YGPA and UPA stood at 2.943 trillion won, 1.825.4 trillion won and 797.4 billion won, respectively, in 2017, down 2.8 %, - 4.9 % and 6.1 %, respectively, from 2.4658 trillion won, 2.469 trillion won and 558.4 billion won
in 2011, respectively. The average total assets of the four PA increased 1% annually to 2.793 trillion won in 2017, compared with 2.724 trillion won in 2011. During the seven-year period, the average assets of the four port firms stood at 2.724 trillion won, accounting for only 11.7 % of market-type public firms and 14.4 % of quasi-market-type public firms. The BPA posted 341.4 billion won in sales in 2017, up 5.3% annually from 251 billion won in 2011. Sales of IPA, YGPA, and UPA decreased by 10.2%, 29.8%, and 5.8% annually, respectively, from 82.3 billion won, 23.4 billion won and 59.1 billion won in 2011.
PA BPA IPA YGPA UPA Av_PA Av_Asset Contrast(%) Pub.Ⅰ Pub.Ⅱ Pub.ⅠPub.Ⅱ mean 5,371 2,710 2,146 673 2,725 23,252 18,952 11.7 14.4
2011 5,028 2,466 2,470 558 2,630 19,961 17,947 13.2 14.7 2012 5,099 2,556 2,344 573 2,643 21,324 18,680 12.4 14.2 2013 5,220 2,668 2,291 592 2,693 22,772 19,355 11.8 13.9 2014 5,444 2,726 2,165 662 2,749 23,974 19,380 11.5 14.2 2015 5,542 2,802 2,010 743 2,774 24,576 18,716 11.3 14.8 2016 5,620 2,845 1,916 783 2,791 24,970 19,140 11.2 14.6 2017 5,646 2,904 1,825 797 2,793 25,191 19,449 11.1 14.4 CAGR 2.0 2.8 -4.9 6.1 1.0 4.0 1.3
Table 2 Contrast of asset between PA and Public firm
(unit: billion won)
PA BPA IPA YGPA UPA AV_PA Av_Sales Contrast(%) Pub.Ⅰ Pub.Ⅱ Pub.ⅠPub.Ⅱ mean 320 113 87 71 148 8,606 3,218 1.7 4.6
2011 251 82 23 59 104 7,847 2,855 1.3 3.6 2012 255 93 81 63 123 9,104 2,970 1.3 4.1 2013 275 99 83 65 131 9,194 2,988 1.4 4.4 2014 341 109 96 72 154 9,299 3,244 1.7 4.8 2015 427 126 106 74 183 8,431 3,539 2.2 5.2 2016 350 136 110 78 169 8,145 3,452 2.1 4.9 2017 341 148 112 83 171 8,219 3,475 2.1 4.9 CAGR 5.3 10.2 29.8 5.8 8.6 0.8 3.3
Table 3 Contrast of sales between PA and Public firm
(unit: billion won)
The average sales of the four PA reached 171 billion won in 2017, up 8.6% annually from 147.8 billion won in 2011. The average sales of the four PA over the seven-year period amounted to 1,47.8 billion won, only 1.7
% of the market-type public firms and 4.6 % of the quasi-market public firms.
3.2 Comparison of Financial rate between PA and Public firm
BPA's debt rate stood at 45.6 % in 2017, up 5.3 %
annually from 39.8% in 2011. The debt rate of IPA, YGPA
Authorities and UPA stood at 35 %, 30.5% and 23.5% in 2017, respectively, with the annual average increase of 11.9%, -13.5% and 43.3%, respectively, compared to 17.9%, 72.7%
and 2.7% in 2011. The average debt-to-equity ratio of the four PA increased 0.2 % annually to 33.7 % in 2017, compared with 133.2 % in 2011. The average debt rate of the four PA over the seven years is 34.5%, which is only 27.6 % for market-type public firms and 40.5% for semi-market-type public firms.
PA BPA IPA YGPA UPA Av_PA Debt rate Contrast(%) Pub.ⅠPub.ⅡPub.ⅠPub.Ⅱ mean 43.2 27.7 53.4 13.6 34.5 124.9 85.2 27.6 40.5
2011 39.8 17.9 72.7 2.7 33.2 114.8 92.5 29.0 35.9 2012 40.9 21.8 68.9 3.7 33.8 121.3 109.7 27.9 30.8 2013 42.0 26.5 63.5 4.5 34.1 136.5 90.7 25.0 37.7 2014 44.7 28.4 55.5 13.0 35.4 144.6 84.5 24.5 41.9 2015 43.5 31.5 44.9 22.1 35.5 136.9 77.3 25.9 45.9 2016 46.3 33.1 38.0 25.3 35.7 96.8 74.3 36.9 48.0 2017 45.6 35.0 30.5 23.5 33.7 126.4 67.7 26.6 49.8 CAGR 2.3 11.9 -13.5 43.3 0.2 1.6 -5.1
Table 4 Contrast of debt rate between PA and Public firm
(unit: %)
The BPA's current rate stood at 10 % in 2017, down 37.2% annually from 162.2% in 2011.
PA BPA IPA YGPA UPA Av_PA Current(%) Contrast(%) Pub.ⅠPub.ⅡPub.ⅠPub.Ⅱ mean 94.1 131.0 69.3 238.5 133.2 115.1 251.9 115.8 52.9
2011 162.2 84.1 79.3 239.3 141.2 125.7 223.7 112.3 63.1 2012 59.5 46.0 43.3 332.5 120.4 101.1 215.8 119.0 55.8 2013 43.1 106.7 63.0 109.6 80.6 114.6 224.3 70.3 35.9 2014 257.1 318.0 49.9 229.0 213.5 148.2 258.0 144.1 82.7 2015 34.3 110.6 133.1 205.6 120.9 104.9 247.5 115.2 48.8 2016 92.8 200.6 81.2 211.4 146.5 120.0 287.6 122.1 50.9 2017 10.0 50.9 35.3 342.0 109.5 90.8 306.0 120.7 35.8 CAGR -37.2 -8.0 -12.6 6.1 -4.1 -5.3 5.4
Table 5 Contrast of current rate between PA & Public firm
(unit: %)
Current rate of IPA, YGPA and UPA in 2017 was 50.9
%, 35.3% and 342%, respectively, with the annual average rate of –8%, -12.6% and 6.1%, respectively, compared to 84.1%, 79.3% and 239.3% in 2011. The average current rate of the four PA stood at 109.5% in 2017, down 4.1%
annually from 141.2% in 2011. The average current rate of the four PA over the seven-year period stood at 133.2%, or 115.1% of market-type public firm and 251.9% of semi-market-type public firm.
The BPA's Non-current rate stood at 144.7% in 2017, down 1.1% annually from 135.2% in 2011. Non-current rate
of IPA, YGPA and UPA in 2017 was 133.3%, 126.1%, and 114.2%, respectively, with the annual average rate of 2.4%%, -3.9% and 2.9%, respectively, compared to 115.7%, 160.3% and 96.2% in 2011. The average Non-current rate of the four PA stood at 129.6% in 2017, down 0.4% annually from 126.9% in 2011. The average Non-current rate of the four PA over the seven-year period stood at 124.9%, half that of market-type public firm and double that of semi-market-type public firm.
PA BPA IPA YGPA UPA Av_PANoncurrent(%) Contrast(%) Pub.ⅠPub.ⅡPub.ⅠPub.Ⅱ mean 139.8 108.4 144.8 106.8 124.9 254.3 113.4 49.1 110.2
2011 135.2 115.7 160.3 96.2 126.9 182.0 110.8 69.7 114.5 2012 137.5 120.3 159.3 98.4 128.9 190.8 119.2 67.5 108.2 2013 139.4 121.4 154.1 101.7 129.2 204.6 120.7 63.1 107.0 2014 141.0 125.0 148.5 106.9 130.4 214.4 113.7 60.8 114.7 2015 139.5 12.7 136.0 112.2 100.1 612.3 109.3 16.4 91.6 2016 140.9 130.5 129.1 117.6 129.5 174.7 111.8 74.1 115.8 2017 144.7 133.3 126.1 114.2 129.6 201.1 108.4 64.4 119.6
CAGR
1.1 2.4 -3.9 2.9 0.4 1.7 -0.4Table 6 Contrast of Noncurrent between PA and Public Co.
(unit: %)
The BPA's NI/sale(rate of net income for sales) stood at 41.7% in 2017, down 7.1% annually from 64.8% in 2011.
PA BPA IPA YGPA UPA AV_PA NI/sale Contrast Public
Co.Ⅰ Public Co.Ⅱ Public
Co.Ⅰ Public Co.Ⅱ mean 54.3 21.1 -4.5 41.4 28.1 9.8 9.1 2.9 3.1
2011 64.8 15.8 -57.4 51.6 18.7 14.5 4.2 1.3 4.4 2012 60.3 16.9 -18.1 29.9 22.2 12.2 6.6 1.8 3.3 2013 57.6 17.5 -7.9 37.6 26.2 13.2 7.0 2.0 3.8 2014 57.9 22.6 5.1 45.1 32.7 9.4 12.5 3.5 2.6 2015 46.9 26.8 13.6 43.1 32.6 -7.6 10.6 -4.3 3.1 2016 50.9 24.2 14.8 45.2 33.8 13.3 11.5 2.5 2.9 2017 41.7 23.7 18.7 37.6 30.4 13.3 10.5 2.3 2.9 CAGR -7.1 6.9 81.9 -5.1 8.5 -1.4 16.3
Table 7 Contrast of NI/sale between PA and Public Co.
(unit: %)
NI/sale of IPA, YGPA and UPA in 2017 was 23.7%, 18.7%, and 37.6%, respectively, with the annual average rate of 6.9%, 81.9% and –5.1%, respectively, compared to 15.8%, -57.4% and 51.6% in 2011. The average NI/sale of the four PA stood at 30.4% in 2017, up 8.5% annually from 18.7% in 2011. The average NI/sale of the four PA over the seven-year period stood at 28.1%, or 290% of market-type public firm and 310% of semi-market-type public firm.
The BPA's turnover of total asset(Sale/TA) stood at
6.0% in 2017, up 3.2% annually from 5.0% in 2011.
PA BPA IPA YGPA UPA Av_PA Sale/TA Contrast(%) Public
Co.Ⅰ Public Co.Ⅱ Public
Co.Ⅰ Public mean 5.9 4.2 4.2 10.5 6.2 38.3 53.1 16.2 11.7Co.Ⅱ
2011 5.0 3.3 0.9 10.6 5.0 46.4 55.7 10.7 8.9 2012 5.0 3.6 3.4 11.0 5.8 50.1 49.8 11.5 11.6 2013 5.3 3.7 3.6 11.0 5.9 43.7 51.3 13.5 11.5 2014 6.3 4.0 4.4 10.8 6.4 37.3 53.1 17.1 12.0 2015 7.7 4.5 5.3 10.0 6.9 31.4 55.2 21.9 12.5 2016 6.2 4.8 5.7 9.9 6.7 28.9 53.9 23.1 12.4 2017 6.0 5.1 6.1 10.4 6.9 30.6 52.5 22.6 13.2 CAGR 3.2 7.3 36.5 -0.3 5.7 -6.7 -1.0
Table 8 Contrast of Sale/TA between PA and Public Co.
(unit: %)
Turnover of total asset of IPA, YGPA and UPA in 2017 was 5.1%, 6.1%, and 10.4%, respectively, with the annual average rate of 7.3%, 36.5%, and –0.3% respectively, compared to 3.3%, 0.9% and 10.6% in 2011. The average turnover of total asset of the four PA stood at 6.9% in 2017, up 5.7% annually from 5.0% in 2011. The average turnover of total asset of the four PA over the seven-year period stood at 6.2%, or 16.2% of market-type public firm and 11.7% of semi-market-type public firm.
The BPA's growth rate of sale(Gro_sale) stood at – 2.5% in 2017, down 2.5% annually from 1.4% in 2011.
PA BPA IPA YGPA UPA Av_PA Gro_Sale Contrast rate Pub.ⅠPub.ⅡPub.ⅠPub.Ⅱ mean 6.4 10.3 46.6 5.8 17.3 3.3 5.2 5.3 3.3
2012 1.4 13.3 245.4 6.3 66.6 14.7 11.6 4.5 5.8 2013 8.1 6.3 2.9 3.7 5.2 -1.1 9.2 -5.0 0.6 2014 23.8 10.5 15.1 10.0 14.8 0.3 5.6 44.9 2.7 2015 25.3 15.3 11.2 3.8 13.9 -3.0 6.9 -4.7 2.0 2016 -18.0 8.2 3.1 4.5 -0.5 -2.6 -1.6 0.2 0.3 2017 -2.5 8.2 2.2 6.5 3.6 11.2 -1.1 0.3 -3.2 CAGR -212 -9.2 -61.0 0.6 -44.2 -5.3 -162.6
Table 9 Contrast of Gro_sale between PA and Public Co.
(unit: %)
Growth rate of sale of IPA, YGPA and UPA in 2017 was 8.2%, 2.2%, and 6.5%, respectively, with the annual average rate of 9.2%, 61%, and –0.6% respectively, compared to 13.3%, 245.4% and 6.3% in 2011. The average growth rate of sale of the four PA stood at 3.6% in 2017, down 44.2% annually from 7.5% in 2011. The average growth rate of sale of the four PA over the seven-year period stood at 17.3%, or 530% of market-type public firm and 330% of semi-market-type public firm.
PA BPA IPA YGPA UPA Av_PA Gro_debt Contrast(%) Public
Co.Ⅰ Public Co.Ⅱ Public
Co.Ⅰ Public Co.Ⅱ mean 3.7 12.6 -13.6 58.4 15.3 8.8 2.6 174 591
2012 3.4 22.5 -8.0 37.7 13.9 11.6 12.6 120 110 2013 4.3 22.2 -6.9 26.8 11.6 18.9 -3.1 61 -371 2014 8.9 7.9 -13.2 196.1 49.9 9.8 5.7 512 870 2015 -0.1 11.2 -19.4 76.6 17.1 5.0 -0.1 342 -25048 2016 5.9 5.5 -15.4 17.2 3.3 4.1 1.8 80 185 2017 -0.6 6.6 -19.1 -3.8 -4.2 3.2 -1.4 -131 301 CAGR -170.7 -21.8 19.0 -163.3 -178.8 -22.6 -164.5
Table 10 Contrast of Gro_Debt between PA and Public firm
(unit: %)
The BPA's growth rate of debt(Gro_debt) stood at 3.7%
in 2017, down 170% annually from 3.4% in 2012. Growth rate of debt of IPA, YGPA and UPA in 2017 was 6.6%, -19.1%, and –3.8%, respectively, with the annual average rate of –21.8%, 19%, and –163.3% respectively, compared to 22.5%, -8.0% and 37.7% in 2012. The average growth rate of debt of the four PA over the seven-year period stood at 15.3%, or 174% of market-type public firm and 591% of semi-market-type public firm.
PA BPA IPA YGPA UPA Av_PA VAD Contrast(%) Public
Co.Ⅰ Public Co.Ⅱ Public
Co.Ⅰ Public 평균 313 82 96 73 141 30,656 24,380 0.46 0.58Co.Ⅱ
2012 243 68 70 95 18,128 25,798 0.52 0.37 2013 279 73 83 51 122 19,075 23,767 0.64 0.51 2014 342 84 91 66 146 25,159 25,439 0.58 0.57 2015 387 96 106 81 167 22,178 27,844 0.76 0.60 2016 354 91 112 84 160 51,271 22,224 0.31 0.72 2017 336 106 116 83 160 59,268 21,702 0.27 0.74 CAGR 6.7 9.2 10.7 12.9 11.0 26.7 -3.4
Table 11 Contrast of VAD between PA and Public firm
(unit:billion won)
The average value added for the seven-year period between BPA and IPA is 313 billion won and 82 billion won, while YGPA and UPA are 96 billion won and 73 billion won, respectively. The average of the four PA is 141 billion won, 0.46% that of market-type firm and 0.58% that of semi-market-type public firm.
The average value added per person for the seven-year
period between BPA and IPA is 1,414 million won and 3.62
million won, while YGPA and UPA are 764 million won and
5.48 million won, respectively. The average of the four port
firms is 7.72 million won, 1.6 times that of market-type
firm and 1.9 times that of semi-market-type public firm.
Authorities
PA BPA IPA YGPA UPA Av_PAVAD/1person Contrast rate Public
Co.Ⅰ Public Co.Ⅱ Public
Co.Ⅰ Public Co.Ⅱ 평균 1,414 362 764 548 772 496 413 1.6 1.9 2012 1,340 325 727 0 598 483 356 1.2 1.7 2013 1,366 305 831 471 743 464 382 1.6 1.9 2014 1,436 331 877 524 792 470 408 1.7 1.9 2015 1,558 407 866 612 861 457 470 1.9 1.8 2016 1,466 394 642 557 765 535 437 1.4 1.7 2017 1,291 471 645 577 746 554 424 1.3 1.8 CAGR -0.7 7.7 -2.4 5.2 4.5 2.8 3.6
Table 12 Contrast of VAD/person between PA and Public firm
(unit:million won)
Over the seven-year period, the average total capital investment efficiency of BPA and IPA is 5.9 % and 3.0 %, while YGPA and UPA are 4.6 % and 10.5 %, respectively.
The figure is 61.9 % for market-type public firms and 24.9
% for semi-market public firms, which is not enough. The reason is that the value added amount is much smaller than the total capital.
PA BPA IPA YGPA UPA Av_PA
VAD/TA Contrast rate Public
Co.Ⅰ Public Co.Ⅱ Public
Co.Ⅰ Public Co.Ⅱ 평균 5.9 3.0 4.6 10.5 6.0 9.7 24.0 0.6 0.2 2012 4.8 2.7 2.9 0.0 2.6 9.5 20.3 0.3 0.1 2013 5.4 2.8 3.6 8.8 5.2 9.0 21.0 0.6 0.2 2014 6.4 3.1 4.1 10.5 6.0 9.1 25.1 0.7 0.2 2015 7.0 3.5 5.1 11.5 6.8 5.6 26.6 1.2 0.3 2016 6.3 3.2 5.7 11.0 6.6 12.1 25.5 0.5 0.3 2017 6.0 3.7 6.2 10.5 6.6 11.5 24.6 0.6 0.3 CAGR 4.4 6.3 16.4 4.6 20.5 3.9 3.9
Table 13 Contrast of VAD/TA between PA and Public firm.
(unit:%)
4. Research Methodology and Analysis
4.1 Research Model and Variables
In this paper, First, the significant relationship between the seven management evaluation items and the evaluation results(scores and scores) was measured. Second, the significant relationship between key financial rates(size) and the evaluation results(scores and scores) was measured. In addition, the evaluation items and key financial rates were tested to determine whether they were appropriate as the basis for management evaluation. Therefore, the following research models were constructed to achieve this purpose.
HⅠ
HⅡ evaluation Items
1) Strategy
2) Social contribution 3) Work efficiency
4) Organization management 5) Financial management 6) Welfare management 7) Major business
Performance
․Total Score
․Quantitative Score
․Qualitative Score
․Grade Financial rate & Size
1) Debt rate 2) Current rate 3) Non-current rate 4) Profitablity 5) Productity 6) Efficiency 7) Sales(Firm Size) Fig. 1 Research model
4.1.1 Dependent variables(performance)
The performance measurements of public firm as defined in this study were measured by four variables: the overall score, the metric score, the non-measuring score and the score derived from the management evaluation.The measurement method uses the inspection (released data in Alio) scored by the public firm for seven years from 2011 to 2017.
4.1.2 Independent variables
There are two main independent variables defined in this study. The first type is seven management evaluation items: strategy, social contribution, work efficiency, organization management, financial management, welfare management, major businesss. The second type is financial stability (Debt rate), liquidity(current rate), asset-capital adequacy (non-current rate), profitability(return on capital), productivity(total capital investment efficiency), efficiency (turnover on total asset), and sales size as the main factors.
These variables are also measured using calculated figures by obtaining data on the financial statements of public firm (data disclosed in Alios) for seven years from 2011 to 2017.
4.2 Research Hypothesis and analysis method
Hypothesis I was established as follows by testing the
relevance of seven evaluation items to their management
performance.
[HⅠ] Evaluation items will affect public-firm’s performance.
[HⅠ-1] Strategy will affect public-firm’s performance.
[HⅠ-2] Social contribution will affect performance.
[HⅠ-3] Work efficiency will affect performance.
[HⅠ-4] Organizational management will affect performance.
[HⅠ-5] Financial management will affect performance.
[HⅠ-6] Welfare management will affect performance.
[HⅠ-7] Major business will affect performance.
Hypothesis II was established as follows by testing the relevance of financial rates and size to management performance to assessing adequacy.
[HⅡ] Size․financial rate will affect public-firm’s performance.
[HⅡ-1] Debt rate will affect performance.
[HⅡ-2] Current rate will affect performance.
[HⅡ-3] Non-current rate will affect performance.
[HⅡ-4] Return on capital will affect performance.
[HⅡ-5] Turnover of total asset will affect performance.
[HⅡ-6] Investment efficiency of total capital will affect performance.
[HⅡ-7] Size(sales) will affect performance.
The test model is divided into Model I, which tests the relationship between the management evaluation criteria and the management performance, and Model II, which tests the relationship between the major financial rates and the magnitude variables and the performance. In addition, the analysis method used to analyse Model I and Model II is as follows. First, the T-test and the ANOVA method were used to test the difference between relevant variables according to their size or score. Second, the evaluation of the impact relationship on the performance of public firm was analyzed using the Panel Multivariate Regression.
[ModelⅠ] Relationship Test Model between Evaluation items and public firm’s performance
MPi = β0 + β1Stij + β2SCij + β3WEFij + β3 ORij + β 5FINij + β6WELij + β7BUSij + ei
MPij : Performance of Public Co.[ i = 2011년–2017년, j=
30 public firms total score(y1), Qualitative Score(y2), Quantitative Score(y3), Grade(A=5, B=4, C=3, D=1, E=0)]
Stij : strategy score, SCij : social contribution score, WEFij : work efficiency score, ORij : organizational management score, FINij : financial management score, WELij : welfare management score, BUSij : major
business score, β 0 : constant, ei : random error
[ModelⅡ] Relationship Test Model between financial rate․size and public firm’s performance
MPij = β0 + β1X1ij + β2X2ij + β3X3ij + β4X4ij + β5X5ij + β6X6ij + β7X7ij + ei
MPij : Performance of Public Co.[ i = 2011–2017, j= 30 Public Total score(y1), Qualitative Score(y2), Quantitative Score(y3), Grade(A=5, B=4, C=3, D=1, E=0)]
X1ij : debt rate, X2ij : current rate, X3ij : non-current rate, X4ij : return on capital, X5ij : turnover rate of total asset, X6ij : investment efficiency of total asset, X7ij : size(sales), β0 : constant, ei : random error
4.3 Statistics․T-test․ANONA results
4.3.1 Score and Evaluation items
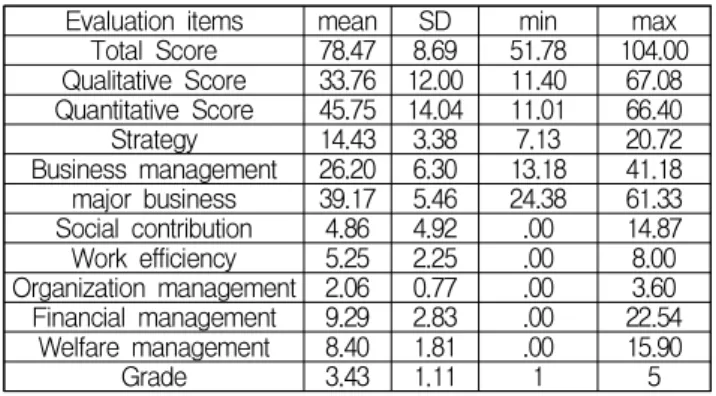
Evaluation items mean SD min max Total Score 78.47 8.69 51.78 104.00 Qualitative Score 33.76 12.00 11.40 67.08 Quantitative Score 45.75 14.04 11.01 66.40 Strategy 14.43 3.38 7.13 20.72 Business management 26.20 6.30 13.18 41.18 major business 39.17 5.46 24.38 61.33 Social contribution 4.86 4.92 .00 14.87 Work efficiency 5.25 2.25 .00 8.00 Organization management 2.06 0.77 .00 3.60 Financial management 9.29 2.83 .00 22.54
Welfare management 8.40 1.81 .00 15.90
Grade 3.43 1.11 1 5
Table 14 Score and Evaluation items
* p<0.05; ** p<0.01; *** p<0.001
The average total score of 30 public firm over the seven years from 2011 to 2017 is 78.476 (the min score is 51.76 and the max score is 104). Of these, the Qualitative score is 33.76 (the min score is 11.40 and the max score is 67.04), and the Quantitative score is 45.7511 (the min score is 11.01 and the max score is 66.40).
4.3.2 Financial rate and size Table 15 Financial rate and size
(unit: billion won, %) Financial rate and size mean SD min max
Debt/Capital rate 138.2% 4.91 -619.2% 6905.0%
Debt/TA rate 51.3% 0.39 2.6% 224.2%
Current rate 182.9% 1.63 0.0% 927.0%
Non-current rate 183.8% 4.37 -456.2% 6243.0%
OI/sales 9.4% 0.35 -388.4% 82.6%
sales/Ta 45.7% 0.57 0.9% 321.4%
VAD/TA 16.8% 0.22 -74.4% 128.3%
Tota Sales 5,912 11,217 23 60,190 Total Asset 21,102 41,495 109, 181,788
Employees 3,459 6,090 45 28,773
Authorities
rate Classification N mean SD t-value P debt/capital other public co. 182 154.1%PA 28 34.5% 5.250.18 3.060* .003
debt/TA other public co. 182PA 28 55.5%24.3% 0.400.10 8.751** .000 current rate other public co. 182 191.2%PA 28 129.3% 1.691.02 2.694* .009 Non-current other public co. 182 192.9%PA 28 124.9% 4.690.28 1.935 .054 OI/sales other public co. 181PA 28 28.1%6.5% 0.360.26 -3.801** .000 sales/Ta other public co. 182 51.8% 0.59 10.335** .000
Table 17 T-test results between PA and other public firm
(unit:billion won, %)
PA 28 6.2% 0.03
VAD/TA other public co. 180PA 25 18.4%5.7% 0.230.03 7.142** .000 VAD/sales other public co. 182PA 25 40.7%90.7% 0.860.14 -7.206** .000 personVAD/ other public co. 163 348.91PA 18 547.70 293.82 -3.935* .001190.80 Grade other public co. 180PA 25 3.493.00 1.130.87 2.540* .015 Sales other public co. 182 6,798,435 11,805,172 7.598** .000PA 28 147,841 108,427 Total Asset other public co. 182 23,929,738 43,903,680 6.483** .000PA 28 2,724,927 1,740,484 Employee other public co. 182PA 28 3,970142 6,39256 8.077** .000
The average debt rate is 138.2% and the average debt
rate to total capital is 51.3%. Its average total assets are 21.02 trillion won and its average number of employees is 3,459.
4.3.3 T-Test results between PA and other public co.
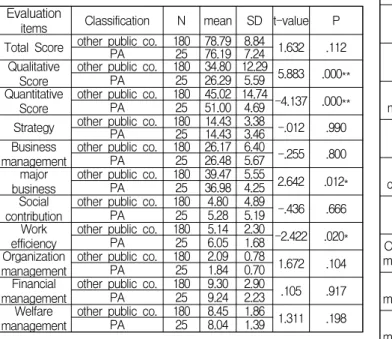
Table 16 shows the results of a T-test between the scores and evaluation indexes between the Port Authority and the General Public firm. Items that show significant differences are Qualitative score, Quantitative score, major business and work efficiency, and others do not show significant differences.
Table 17 shows the results of a T-test between the financial rate and sales size between the Port Authority and the general public firm. Items that show significant differences are debt/capital, debt/ta, current rate, oi/sales, sales/ta, vad/ta, vad/sales, vad/person, Grade, sales, total asset and, employee number.
Evaluation
items Classification N mean SD t-value P Total Score other public co. 180 78.79 8.84 1.632PA 25 76.19 7.24 .112
Qualitative
Score other public co. 180 34.80 12.29 5.883 .000**PA 25 26.29 5.59 Quantitative
Score other public co. 180 45.02 14.74 -4.137 .000**PA 25 51.00 4.69 Strategy other public co. 180 14.43 3.38 -.012 .990PA 25 14.43 3.46 Business
management other public co. 180 26.17 6.40 -.255 .800PA 25 26.48 5.67 major
business other public co. 180 39.47 5.55 2.642 .012*PA 25 36.98 4.25 Social
contribution other public co. 180PA 25 4.80 4.89 -.436 .6665.28 5.19 efficiencyWork other public co. 180PA 25 5.14 2.30 -2.422 .020*6.05 1.68 Organization
management other public co. 180PA 25 2.09 0.78 1.672 .1041.84 0.70 Financial
management other public co. 180PA 25 9.30 2.90 .1059.24 2.23 .917 Welfare
management other public co. 180PA 25 8.45 1.86 1.311 .1988.04 1.39
Table 16 T-test results between PA and other public firm
* p<0.05; ** p<0.01; *** p<0.001
4.3.4 ANOVA results Evaluation items & rate by size
score & Evaluation
items
squaressum of df meansquares liar P Total Score between 644 2 322.109 4.411 0.013*
within 14,752 202 73.03
sum 15,396 204
Qualitative Score
between 3,833 2 1916.411 15.026 0**
within 25,764 202 127.543
sum 29,597 204
Quantitative Score
between 4,431 2 2215.436 13.244 0**
within 33,791 202 167.283
합계 38,222 204
Grade between 8 2 4.219 3.525 0.031*
within 242 202 1.197
sum 250 204
Strategy between 23 2 11.595 1.444 0.238
within 1,622 202 8.029
sum 1,645 204
Business managmen
between 77 2 38.39 1.769 0.173 within 4,384 202 21.703
sum 4,461 204
major business
between 198 2 99.063 3.403 0.035*
within 5,880 202 29.108
sum 6,078 204
Social contribution
between 4 2 2.197 3.186 0.043
within 139 202 0.69
sum 144 204
efficiencyWork
between 24 2 12.129 2.529 0.082
within 969 202 4.797
sum 993 204
Organization management
between 1 2 0.396 0.681 0.507
within 117 202 0.581
sum 118 204
Financial management
between 42 2 21.104 2.839 0.061
within 1,502 202 7.433
sum 1,544 204
Welfare management
between 23 2 11.584 4.056 0.019*
within 577 202 2.856
sum 600 204
Table 18 ANOVA results-1 for Evaluation items by size
Note: Standard for Classification of size: Small Public firm with gross sales of less than 500 billion won (0), Medium Public firm with 500 billion won or more to 1 trillion won (1 trillion won) and Large Public firm with 1 trillion won or more, * p<0.05; ** p<0.01; *** p<0.001
Table 18 shows the variance of analysis results for score
and Evaluation items by sales difference. Items that show
significant differences are total Score, Qualitative Score,
Quantitative Score, grade, major business and Welfare
management. But other Items don’t show significant
differences. Table 19 shows the variance of analysis results
for financial rate by sales difference.
financial rate
squaressum ofdf
squares liarmeanP debt/capital between 52 2 25.909 1.078 0.342
within 4,977 207 24.044
sum 5,029 209
debt/ta between 2 2 0.822 5.667 0.004**
within 30 207 0.145
sum 32 209
current rate between 127 2 63.742 30.899 0***
within 427 207 2.063
sum 555 209
non-current between 60 2 30.164 1.59 0.206 within 3,926 207 18.966
sum 3,986 209
OI/sales between 1 2 0.58 4.787 0.009**
within 25 206 0.121
sum 26 208
BIT/capital between 8 2 4.182 0.814 0.444 within 1,063 207 5.137
sum 1,072 209
sales/ta between 3 2 1.595 5.081 0.007**
within 65 207 0.314
sum 68 209
vad/ta between 0 2 0.221 4.896 0.008**
within 9 202 0.045
sum 10 204
vad/person between 1,298,244 2 649122. 8.284 0***
within 13,950,000 178 78354
sum 15,250,000 180
Table 19 ANOVA results for financial rate
1Items that show significant differences are debt/ta, current rate, OI/sales, sales/ta, vad/ta and vad/person. But other Items don’t show significant differences.
4.4 Panel Regression Analysis results
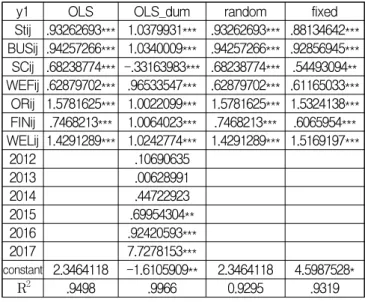
The panel analysis results between the management evaluation items and the overall score(y1) by the OLS, OLS dum, random effect and fixed effect models are shown in Table 20. The four panel regression models have very high R 2 (determination coefficient) of 0.9498, 0.9966, 0.9295 and 0.9319, respectively, indicating that the models are very suitable. Among them, the R 2 of OLS dum is the best analysis model with 0.9966. In addition, all seven management evaluation criteria in all models show very significant relevance(p<0.000) to the overall score, which is the final score of the public firm. Therefore, all seven management evaluation criteria are deemed appropriate for assessing the performance of public firm.
The panel analysis results between the management evaluation items and grade by the OLS, OLS dum, random effect and fixed effect models are shown in Table 21. The four panel regression models have very high R 2 of 0.5547, 0.6985, 0.4100 and 0.4291, respectively, indicating that the models are suitable.
y1 OLS OLS_dum random fixed
Stij .93262693*** 1.0379931*** .93262693*** .88134642***
BUSij .94257266*** 1.0340009*** .94257266*** .92856945***
SCij .68238774*** -.33163983*** .68238774*** .54493094**
WEFij .62879702*** .96533547*** .62879702*** .61165033***
ORij 1.5781625*** 1.0022099*** 1.5781625*** 1.5324138***
FINij .7468213*** 1.0064023*** .7468213*** .6065954***
WELij 1.4291289*** 1.0242774*** 1.4291289*** 1.5169197***
2012 .10690635
2013 .00628991
2014 .44722923
2015 .69954304**
2016 .92420593***
2017 7.7278153***
constant
2.3464118 -1.6105909** 2.3464118 4.5987528*
R 2 .9498 .9966 0.9295 .9319
Table 20 Panel regression results for total score by Evaluation items
Among them, the R 2 of OLS dum is the best analysis model with 0.6985. In addition, all seven management evaluation criteria in all models show very significant relevance(p<0.05) to the grade of the public firm. Therefore, all seven management evaluation criteria are deemed appropriate for assessing the performance of public firm.
Grade OLS OLS_dum random fixed
Stij .00744262 .14195989*** -.00268008 -.05209228 BUSij .03902983*** .05760324*** .03747138*** .03140015**
SCij .10252263 -.21234276** .09178409 .01966043 BUEFij .18463689*** .19305501*** .180213*** .17227541***
ORij .37444624*** .47165696*** .38646602*** .44985231***
FINij .05353592* .0518088* .04773748* .00874903 WELij .19764323*** .21441463*** .17735333*** .07845349
2012 - -.18716458 - -
2013 - .2211088 - -
2014 - 1.2687943*** - -
2015 - 1.0556253*** - -
2016 - 1.8728682*** - -
2017 - 1.1884824*** - -
constant
-2.3259141*** -5.341181*** -1.8890941*** .25188661
R 2 .5547 .6985 .4100 .4291
Table 21 Panel regression results for grade by Evaluation
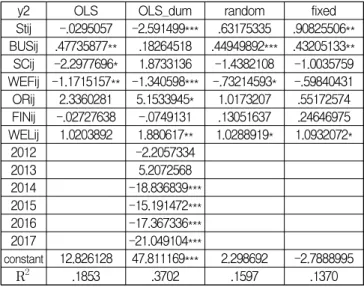
The panel analysis results between the management
evaluation items and
Qualitative Score(y2)by the OLS, OLS
dum, random effect and fixed effect models are shown in
Table 22. The four panel regression models have R 2 of
0.1853, 0.3702, 0.1597 and 0.1370, respectively, indicating
that the models are suitable. Among them, the R 2 of OLS
dum is the best analysis model with 0.3702. In addition,
strategy(Stij) and
Work efficiency(WSij) have very
Authorities significant relevance (p<0.000), welfare management(WELij) has significant relevance(p<0.001) and organizational management(ORij) show significant relevance(p<0.05) to the
Qualitative Scoreof the public firm. But major business(BUSij), social contribution(SCij) and financial management(FINij) don’t show significant relevance.
y2 OLS OLS_dum random fixed
Stij -.0295057 -2.591499*** .63175335 .90825506**
BUSij .47735877** .18264518 .44949892*** .43205133**
SCij -2.2977696* 1.8733136 -1.4382108 -1.0035759 WEFij -1.1715157** -1.340598*** -.73214593* -.59840431 ORij 2.3360281 5.1533945* 1.0173207 .55172574 FINij -.02727638 -.0749131 .13051637 .24646975 WELij 1.0203892 1.880617** 1.0288919* 1.0932072*
2012 -2.2057334
2013 5.2072568
2014 -18.836839***
2015 -15.191472***
2016 -17.367336***
2017 -21.049104***
constant
12.826128 47.811169*** 2.298692 -2.7888995
R 2 .1853 .3702 .1597 .1370
Table 22 Panel regression results for y2 by Evaluation
The panel analysis results between the management evaluation items and
Quantitative Score(y3)by the OLS, OLS dum, random effect and fixed effect models are shown in Table 23.
y3 OLS OLS_dum random fixed
Stij .96180805* 3.6233019*** .31458434 -.02252381 BUSij .46636497** .85081887*** .4819113** .49824492***
SCij 2.9708571** -2.1790021 2.0974297* 1.5449702 WEFij 1.7948671*** 2.3018851*** 1.3617378*** 1.2026753***
ORij -.74122564 -4.1451594* .46900222 .99293412 FINij .77600107* 1.0811235** .5453035 .36709725 WELij .40486975 -.86742944 .47816221 .43169057
2012 2.3085205
2013 -5.2271425
2014 19.242115***
2015 15.795872***
2016 18.09394***
2017 28.68067***
constant
-10.523538 -49.231594*** .51247019 7.120122
R 2 .2826 .5126 .2716 .2518
Table 23 Panel regression results for y3 by Evaluation
The four panel regression models have R 2 of 0.2826, 0.5126, 0.2716 and 0.2518, respectively, indicating that the models are suitable. Among them, the R 2 of OLS dum is the best analysis model with 0.5126. And, strategy(Stij), major business(BUSij) and
Work efficiency(WEFij) have
very significant relevance (p<0.000), financial management (FINij) has significant relevance(p<0.001) and organizational management(ORij) show significant relevance(p<0.05) to the
Quantitative Scoreof the public firm. But social contribution(SCij) and welfare management(WELij) don’t show significant relevance.
The panel analysis results between the financial rate․
size and total
Score(y1)by the OLS, OLS dum, random effect and fixed effect models are shown in Table 24.
The four panel regression models have R 2 of 0.2456, 0.4889, 0.1428 and 0.0597, respectively, indicating that OLS and OLS_dum models are suitable. Among them, the R 2 of OLS dum is the best analysis model with 0.4889. And, debt rate(X1ij), investment efficiency of total capital(X6ij) and size(sales)
(X7ij) have very significant relevance (p<0.000), non-current rate(X3ij) and return on capital(X4ij) have significant relevance(p<0.001) to the total
Scoreof the public firm. But current rate(X2ij) and turnover rate of total asset(X5ij) don’t show significant relevance.
y1 OLS OLS_dum random fixed
X1ij -8.0120752*** -7.3736339*** -8.0456054*** -8.0456054***
X2ij -.48578862 .03604692 -.90474914 -.90474914 X3ij -2.3085654** -1.9444169** -1.8346376* -1.8346376*
X4ij -4.0431374** -3.2928018** -3.1877914* -3.1877914*
X5ij -.23070975 -1.0350881 .56465182 .56465182 X6ij 11.074249*** 10.978934*** 12.182731*** 12.182731***
X7ij 1.388824*** 1.2868739*** 1.1279905* 1.1279905*
2012 -1.251561
2013 -5.2014228**
2014 -10.895087***
2015 -3.9817369*
2016 -12.830266***
2017 -5.7425331***
constant
65.795881*** 71.602173*** 68.932363*** 68.932363***
R 2 .2456 .4889 .1428 .0597
Table 24 Panel regression results for score by rate․size
The panel analysis results between the financial rate․
size and grade by the OLS, OLS dum, random effect and fixed effect models are shown in Table 25.
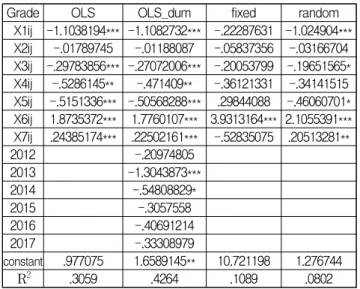
The four panel regression models have R 2 of 0.3059,
0.4264, 0.1089 and 0.0802, respectively, indicating that OLS
and OLS_dum models are suitable. Among them, the R 2 of
OLS dum is the best analysis model with 0.4264. And, debt
rate(X1ij), non-current rate(X3ij), turnover rate of total
asset(X5ij), investment efficiency of total capital(X6ij) and
size(sales)
(X7ij) have very significant relevance (p<0.000),
return on capital(X4ij) have significant relevance(p<0.001)
to the grade of the public firm. But current rate(X2ij) don’t
show significant relevance.
Grade OLS OLS_dum fixed random X1ij -1.1038194*** -1.1082732*** -.22287631 -1.024904***
X2ij -.01789745 -.01188087 -.05837356 -.03166704 X3ij -.29783856*** -.27072006*** -.20053799 -.19651565*
X4ij -.5286145** -.471409** -.36121331 -.34141515 X5ij -.5151336*** -.50568288*** .29844088 -.46060701*
X6ij 1.8735372*** 1.7760107*** 3.9313164*** 2.1055391***
X7ij .24385174*** .22502161*** -.52835075 .20513281**
2012 -.20974805
2013 -1.3043873***
2014 -.54808829*
2015 -.3057558
2016 -.40691214
2017 -.33308979
constant