DOI : http://dx.doi.org/10.5394/KINPR.2020.44.5.400
A Study on the Productivity Measurement and Effect Factors of Management Evaluation in Public Firms with a Focus on the Port Authorities
Ki-Yong Eom*․†Ki-Myung Ahn
*Deputy manager, Gamcheon Office, Busan Port Authority, Busan 49448, Korea
†Professor, Division of Shipping Management, Korea Maritime and Ocean University, Busan 49112, Korea
Abstract : In this study, we first measured the malmquist productivity index by DEA among the Korean public firms. Second, there are 12 public corporations whose productivity (MPI) has decreased compared to 2014. This is mainly because of a decrease in productivity, as well as a decrease in the technical efficiency change index (TECI), impacted by the internal environment, and the increase in productivity because of an increase in the technology change index (TCI) impacted by the external environment. Finally, the analysis of the impact on the management assessment scores showed that the productivity (MPI), scale efficiency (CRS), size of sales, operating profitability, and total capital investment efficiency are significantly related (+), except for the asset turnover, which is a static financial ratio. Meanwhile, the management evaluation scores between the high-productivity public corporations and low-performing public corporations were significantly discriminating. Thus, it is confirmed that the nation's state-run companies must manage their MPIs in a time series to score high in management evaluation.
Key words: public firm, port authority, management performance evaluation, data envelopment analysis, malmquist productivity index, panel multiple regression method, panel probit analysis, panel logit regression analysis
†Corresponding author, [email protected] 051)410-4385
* [email protected] 051)999-2131
1. Introduction
Korea's Public Firms are in charge of key national industries and major infrastructure, which has a significant impact on the national economy. Unlike private companies, however, the company lacks responsibility as an ownerless company. Although the management evaluation system was introduced by the enactment of the Government Investment Management Framework Act in 1984, it was not organized as a performance management tool for public firms due to incomplete evaluation organization and manpower composition, evaluation procedure, evaluation index system, and incentive system(Park, S.H., 2006). Under the Act on the operaten of Public Institutions enacted in 2007, the government classified public institutions established and operated under the government's investment, investment, or government financial support as public firms, quasi-government organizations, and other public agencies, and sought to change the system of management of public firms. In other words, the government intended to induce public firms to innovate their management and improve productivity based on specific performance indicators.(Kim, J.K, 2001).
As such, the management evaluation system of public firm has continuously improved since 1984, but the
diversity of the purpose of establishment and environmental characteristics has not been fully reflected in the management evaluation index. In particular, port authorities with relatively few years or sizes are increasingly exposed to problems that are considered disadvantageous. Lee and Ahn(2013). Therefore, In this study, the Malmquist Productivity Index (MPI) by data envelopment analysis was first measured in Korea's public firms. MPIs can measure productivity changes over time through longitudinal and transverse area analysis of outputs for different inputs.
This is because the reasons for the change in the productivity of the public firm can be explained separately from the changes in technology and efficiency. Second, the impact relationship between productivity and major financial ratios (profitability, financial stability, liquidity, efficiency, and productivity) was identified to derive measures to improve the productivity of public firms. This paper is aimed at enhancing the profitability and global competitiveness of Korean public firms, including port authorities.
2. Theoretical Background
Efficiency is generally expressed as output/input, and
the greater the value of the ratio, the more efficient it is.
the Port Authorities firm efficiency can be classified as Technical Efficiency
(TE) and Distribution Efficiency (AE). Technical efficiency breaks down into the product of pure technical efficiency and scale efficiency. The efficiency of scale is a measure of whether a company's production scale is optimal across the firm(Farrell, 1959). This is assessed by defining it as a revenue constant(CRS) for size from the operational perspective of the entity. DEA is a nonparametric methodology that uses inputs and outputs to measure firm efficiency through a DMU (Decision Making Unit) efficiency and productivity analysis. The Malmquist Productivity Index (MPI) used in this study was defined by Caves, Christensen and Diewert in 1982. Unlike the analysis method of cross-sectional area of DEA, it measures the change in productivity over time through longitudinal and cross-sectional area analysis, and explains the cause of change in productivity by utilizing technological change and efficiency change.
×
×
=TECI× TCI
A value of 1 or more indicates an improvement in productivity, while a value of 1 or less indicates a stagnation and a decline in productivity. Technical Efficiency Change Index(TECI) refers to an index that indicates the extent to which efficiency changes contributed to technological productivity changes. TECI consists of a purely technical production change(PECI) and a scale technical production change(SECI) that increases or decreases the index under the influence of the internal environment. Technical Change Index(TCI) indicates the degree of change in productivity due to changes in technology, which means advances in technology when the index is greater than 1, and backward when less than 1.
The TCI is affected by the external environment.
3. Management status analysis
3.1 Comparison of Size between PA and Public firm
In 2018, the number of public firms is 35 (Public firmⅠ
=15, Public firmⅡ=20). The number of public firms is 30 from 2014 to 2016, the period during which MPIs are
measured. Consequently, the number of firms subject to research was limited to 30 units. And the four Port Authority are busan, incheon, yeosu-guangyang and ulsan port authority. The average total number of employees at the four PA increased 8.8% annually to 188 in 2018, compared with 104 in 2011. During the seven years, the average employees of the four PA was 146, which is only 3.9% for market-type(Public firmⅠ: Pub.Ⅰ) and 4.4% for semi- market-type(Public firmⅡ: Pub.Ⅱ) public firms.
Table 1 Contrast of Average staff and Asset between PA and Public firm
Year Average staff(person) Average Asset(billion won) PA Public
Co.Ⅰ Public
Co.Ⅱ PA Public
Co.Ⅰ Public Co.Ⅱ mean 146 3,782 3,315 2,731 25,036 18,045 2011 104 3,286 3,023 2,630 21,210 16,979 2012 117 3,410 3,103 2,643 22,664 17,672 2013 136 3,559 3,134 2,693 24,208 18,312 2014 150 3,728 3,258 2,749 25,492 18,340 2015 153 3,817 3,287 2,774 26,131 17,722 2016 159 4,005 3,361 2,791 26,550 18,121 2017 174 4,156 3,523 2,793 26,783 18,415 2018 188 4,297 3,827 2,898 27,288 18,800
CAGR 8.8% 3.9% 3.4% 1.4% 3.7% 1.5%
Contrast ratio 3.9% 4.4% 10.9% 15.1%
The average total assets of the four PA increased 1.4%
annually to 2.898 billion won in 2018, compared with 2.724 trillion won in 2011. During the seven-year period, the average assets of the four port Authoritys stood at 2.731 billion won, accounting for only 10.9% of market-type public firms and 15.1% of quasi-market-type public firms.
Year Average Capital Average Sales PA Public
Co.Ⅰ Public
Co.Ⅱ PA Public
Co.Ⅰ Public mean 1,968 9,637 5,827 150 9,238 Co.Ⅱ 3,011
2011 1,916 8,807 5,258 104 8,402 2,682 2012 1,915 8,733 5,324 123 9,748 2,791 2013 1,938 8,833 5,485 131 9,843 2,807 2014 1,966 9,201 5,762 154 9,955 3,048 2015 1,997 10,066 5,621 183 9,025 3,326 2016 1,998 10,635 5,975 169 8,717 3,245 2017 2,018 10,542 6,371 171 8,796 3,267 2018 2,024 10,289 6,820 171 9,416 2,924
CAGR 0.8 2.2 3.8 7.4 1.6 1.2
Contrast ratio 20.4 33.8 1.6 5.0
Table 2 Contrast of Average Capital and Sales between PA and Public firm
(unit: billion won)
The average capital of the four PA reached 2,034 billion won in 2018, up 0.8% annually from 1,916 billion won in 2011. During the seven-year period, the average capital of the four port Authorities stood at 1,968 billion won, accounting for only 20.4% of market-type public firms and 33.8% of quasi-market-type public firms.
The average sales of the four PA reached 171 billion won in 2018, up 7.4% annually from 104 billion won in 2011. During the seven-year period, the average sales of the four port Authoritys stood at 150 billion won, accounting for only 1.6% of market-type public firms and 5.0% of quasi-market-type public firms.
3.2 Comparison of Financial rate between PA and Public firm
The average debt ratio of the four PA reached 36.7% in 2018, up 1.4% annually from 33.2% in 2011. During the seven-year period, the average debt ratio of the four PA stood at 34.5%, accounting for only 23.4% of market-type public firms and 43.8 % of quasi-market-type public firms.
The average current ratio of the four PA reached 188.9%
in 2018, up 4.2% annually from 141.2% in 2011. During the seven-year period, the average sales of the four port Authoritys stood at 142.2%, accounting for125.7% % of market-type public firms and 57.1% of quasi-market-type public firms.
Year Debt ratio(%) Current ratio(%) PA Public
Co.Ⅰ Public
Co.Ⅱ PA Public
Co.Ⅰ Public mean 34.5 147.7 78.8 142.2 113.2 Co.Ⅱ 248.9 2011 33.2 121.7 87.8 141.2 128.7 215.0 2012 33.8 128.4 104.2 120.4 105.1 205.2 2013 34.1 144.3 86.7 80.6 115.2 216.9 2014 35.4 152.9 81.0 213.5 136.0 261.8 2015 35.5 144.4 74.5 120.9 104.5 239.0 2016 35.7 101.3 71.7 146.5 114.3 282.2 2017 33.7 132.9 65.6 109.5 93.6 290.1 2018 36.7 262.0 59.1 188.9 103.3 281.4
CAGR 1.4 11.6 -5.5 4.2 -3.1 3.9
Contrast ratio 23.4 43.8 125.7 57.1 Table 3 Contrast of Debt ratio and Current ratio between PA
and Public firm
The average OI/sale ratio of the four PA reached 29.4%
in 2018, up 6.7% annually from 18.7% in 2011. During the seven-year period, the average OI/sale ratio of the four PA stood at 28.7%, accounting for 330.1% of market-type public firms and 289.4 % of quasi-market-type public firms.
The average BTI/sale ratio of the four PA reached 23.2
% in 2018, up 16.4 % annually from 8% in 2011. During the
seven-year period, the average BTI/sale ratio of the four port Authoritys stood at 19.3%, accounting for 620.9% of market-type public firms and 317% of quasi-market-type public firms.
Year OI/sale(%) BTI/sale(%)
PA Public
Co.Ⅰ Public
Co.Ⅱ PA Public
Co.Ⅰ Public mean 28.7 8.7 9.9 19.3 -3.1 Co.Ⅱ 6.1
2011 18.7 14.4 5.0 8.0 9.7 3.5
2012 22.2 11.9 7.3 4.1 6.9 -0.4
2013 26.2 12.9 7.6 13.5 8.4 10.7
2014 32.7 8.5 13.2 21.9 2.0 9.0
2015 32.6 -10.1 11.7 34.0 -45.9 1.5
2016 33.8 12.5 12.3 23.3 -7.8 8.0
2017 30.4 12.6 11.3 24.2 4.9 8.5
2018 29.4 5.9 10.2 23.2 -3.7 7.9
CAGR 6.7 -12.1 10.8 16.4 -187.0 12.5 Contrast ratio 330.1 289.4 620.9 317.0 Table 4 Contrast of OI/sale and BTI/sale between PA and
Public firm
* OI/Sale ; Operating Income/sale profitability. BTI/sale ; Before Tax Income/sale profitability.
The average turnover of total asset(Sale/TA) ratio of the four PA reached 0.9% in 2018, up 4.7% annually from 5%
in 2011. During the seven-year period, the average turnover of total asset ratio of the four PA stood at 6.3%, accounting for 15.7% of market-type public firms and 12.7% of quasi-market-type public firms.
Year Sale/TA(%) VAD/TA(%)
PA Public
Co.Ⅰ Public
Co.Ⅱ PA Public
Co.Ⅰ Public mean 6.3 40.1 49.7 6.1 9.9 Co.Ⅱ 22.5
2011 5.0 49.5 52.4 0.0 0.0 0.0
2012 5.8 53.4 46.9 2.6 10.0 19.2
2013 5.9 46.5 48.3 5.2 9.5 19.9
2014 6.4 39.7 50.0 6.0 9.5 23.7
2015 6.9 33.4 52.1 6.8 5.8 25.2
2016 6.7 30.6 50.8 6.6 12.7 24.1
2017 6.9 32.4 49.6 6.6 12.1 23.3
2018 6.9 35.5 47.6 6.7 8.3 20.7
CAGR 4.7 -4.6 -1.4 20.5 3.8 3.9
Contrast ratio 15.7 12.7 61.2 27 Table 5 Contrast of Sale/TA and VAD/TA between PA and
Public firm
* Sale/TA ; turnover of total asset ratio, VAD/TA ; the average total capital investment efficiency
The average VAD/TA ratio of the four PA reached 6.7
% in 2018, up 20.5% annually from 0% in 2011. During the
seven-year period, the average VAD/TA ratio of the four
port Authoritys stood at 6.1%, accounting for 61.2% of
the Port Authorities market-type public firms and 27% of quasi-market-type
public firms.
4. Research Methodology and Analysis
4.1 Research Model and Variables
In this paper, First, the efficiency index(CRS) of public firms in Korea was derived by the DEA-BCC model.
Second, the productivity index(MPI) was derived in accordance with the calculation DEA model of the Malmquist to measure the productivity, taking into account the time series of the Korea Port Authority and the Korean public firms. Second, the significant relationship between Malmquist Productivity Index(MPI)·CRS and the management evaluation results(total scores) was measured.
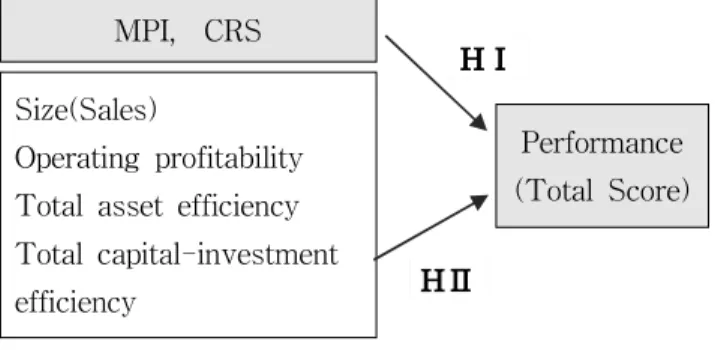
Third, the significant relationship between key financial rates(size) and the management evaluation results(scores) was measured. Therefore, the following research models were constructed to achieve this purpose.
HⅡ MPI, CRS
Size(Sales)
Operating profitability Total asset efficiency Total capital-investment efficiency
Performance (Total Score) HⅠ
Fig. 1 Research model
4.1.1 Dependent variables(performance)
The performance measurements of public firm as defined in this study were measured by the overall management evaluation score. The measurement method uses the inspection (released data in Alio) scored by the public firm for five years from 2014 to 2017.
4.1.2 Independent variables
The first type are MPI and CRS derived by the DEA-BCC model with Malmquist. The second type are key financial ratios and size. The key financial ratios are operating profitability(operating profit/sales), total capital investment efficiency and turnover on total asset. These variables are also measured using calculated figures by obtaining data on the financial statements of public firm (data disclosed in Alios) for seven years from 2014 to 2018.
4.2 Research Hypothesis and analysis method
Hypothesis I was established as follows by testing the relevance of seven evaluation items to their management performance.
[HⅠ] MPI and CRS will affect public-firm’s performance.
[HⅠ-1] MPI will affect public-firm’s performance.
[HⅠ-2] CRS will affect public-firm’s performance.
Hypothesis II was established as follows by testing the relevance of financial rates and size to management performance to assessing adequacy.
[HⅡ] Size․financial rate will affect public-firm’s performance.
[HⅡ-1] Size(sales) will affect performance.
[HⅡ-2] Investment efficiency of total capital will affect performance.
[HⅡ-3] Turnover of total asset will affect performance.
4.3 Analysis procedure and method
In this study, prior studies were referenced to derive the Scale Efficiency(CRS) and Malmquist Productivity Index (MPI) by the optimal DEA analysis model. In addition, the MPI is calculated from the time series data for five years, so there are input and output variables restrictions.
Consequently, the inputs from the optimal DEA analysis model are the total assets and the total number of employees, and the outputs are the total operating profit and overall scores obtained as a result of the management evaluation. In addition, the following analysis procedures were performed. First, research hypotheses ware tested by Panel Multivariate Regression in relation to the impact of the scale efficiency index(CRS), productivity index(MPI), financial ratio and sales volume on the overall score of the management evaluation derived from the DEA model.
Yi = overall score (i = 30 Public Firms, 2014-2018 years) MPIi = DEA Malmquist productivity index
CRSi = DEA Size efficiency index, i = panel items Xi = operating profitability, total capital investment efficiency and turnover on total asset, sales), εi = error.
Second, the overall score between public corporations
whose MPIs are derived from the DEA model are greater
than 1 and those whose productivity is less than 1 were
tested and the ability to distinguish the above independent variables was tested. Analysis methods are Panel Probit Resistance and Panel Logit Resistance.
MPi = Productivity classification of public Firms(1= MPI>1, 0= MPI<1) 2014 year(1=13, 0=17), 2015 year(1=12, 0=18), 2016 year(1=4, 0=26), 2017 year(1=17, 0=13), 2018 year(1=9, 0=21).
4.4 Statistics of Variables
The average MPI of 30 public firm over the five years from 2014 to 2018 is 0.96(min is 0.65 and max is 1.31).
The average total score of 30 public firm over the five years from 2014 to 2018 is 77(the min score is 64 and the max score is 85.4).
2018 Year meam sd min max
MPI 0.96 0.14 0.65 1.31
TECI 1.03 0.53 0.02 3.43
TCI 0.85 0.09 0.72 1.05
PECI 1.22 0.84 0.01 3.79
SECI 1.01 0.36 0.16 2.26
CRS 0.48 0.36 0.01 1.00
x1 0.08 0.26 -0.68 0.74
x2 0.16 0.21 -0.26 1.04
x3 0.42 0.52 0.05 2.90
sale 5,953 11,597 86 60,628
Total Asset 22,761 44,585 221 185,249
Y 77.0 5.1 64.0 85.4
Table 6 Statistics of MPI and variables
(Sale and Total asset unit: billion won)
* Y; overall score, X1 ; operating profitability, X2 ; total capital investment efficiency X3 ; turnover on total asset
4.4 Correlation Analysis Result between Score and MPI and Related Variables
Correlation Score MPI CRS Sale x1 x2
MPI corr .231 1
P .004
CRS corr .185 -.003 1
P .024 .968
Sale corr .045 -.005 -.271 1
P .584 .952 .001
x1 corr .306 -.045 .371 .014 1
P .000 .582 .000 .870
x2 corr .372 .079 .349 -.126 .207 1 P .000 .336 .000 .124 .011 x3 corr .125 -.064 .032 .044 -.038 .260
P .126 .439 .699 .595 .645 .001 Table 7 Correlation Analysis Results of Score·MPI
Table 7 is the result of analysis of Pearson correlation between management evaluation scores of Korean public
corporations and management efficiency(CRS) and productivity(MPI) and related variables. There is a strong correlation between management evaluation scores and productivity(MPI) and management efficiency(CRS).
4.5 DEA Malmquist Productivity Analysis Results
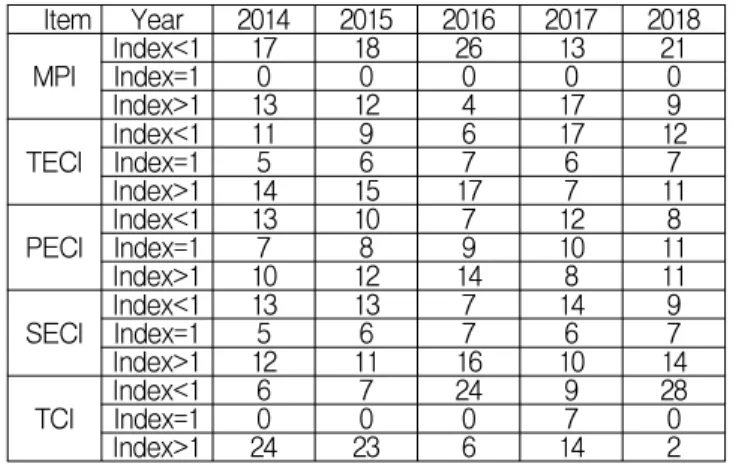
The number of state-owned firms with increased technical efficiency change index(>1) affected by the internal environment increased slightly from 14 in 2014 to 16 in 2016, but decreased to 7 in 2017 and 11 in 2018. On the other hand, the number of Public Firms that declined (<1) decreased from 11 to six in 2016, but increased to 17 in 2017 and 12 in 2018, indicating that productivity has deteriorated significantly. Meanwhile, the number of public corporations affected by the external environment increased (>1) from 24 in 2014 to 6 in 2016 and recovered to 14 in 2017. However, the number dropped significantly to two again in 2018. On the other hand, the number of reduced public corporations (<1) increased significantly from six in 2014 to 28 in 2018, indicating that internal environmental factors played a greater role in the productivity of public corporations than external factors. As a result, the number of Public Firms with increased productivity is nine and the number of Public Firms with a drop in productivity is far higher at 21, worsening the total output of Public Firms.
Item Year 2014 2015 2016 2017 2018
MPI Index<1 17 18 26 13 21
Index=1 0 0 0 0 0
Index>1 13 12 4 17 9
TECI Index<1 11 9 6 17 12
Index=1 5 6 7 6 7
Index>1 14 15 17 7 11
PECI Index<1 13 10 7 12 8
Index=1 7 8 9 10 11
Index>1 10 12 14 8 11
SECI Index<1 13 13 7 14 9
Index=1 5 6 7 6 7
Index>1 12 11 16 10 14
TCI Index<1 6 7 24 9 28
Index=1 0 0 0 7 0
Index>1 24 23 6 14 2
Table 7 MPI Analysis Result by DEA Model
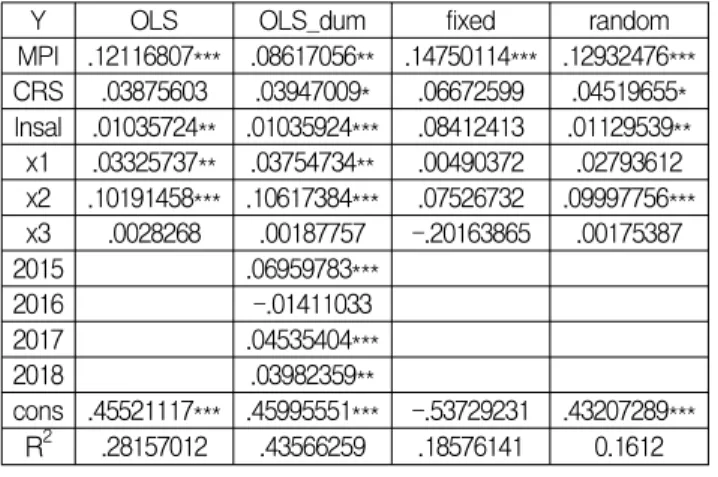
4.6 Panel Regression Analysis results
The panel analysis results between the management
evaluation items and the overall score(Y) by the OLS, OLS
dum, fixed effect and random effect models are shown in
Table 8. The four panel regression models have very high
R 2 (determination coefficient) of 0.2815 0.4356, 0.1857. 0.1612
respectively, indicating that the models are suitable. Among
them, the R 2 of OLS dum is the best analysis model with
the Port Authorities 0.4356. Productivity(MPI) is a significant positive(p<0.05)
influence relationship that is strong in scoring the management evaluation of a public firm, so [H I-1] is adopted. However, [H I-2] is also acceptable, although the scale efficiency(CRS) shows a somewhat weak positive influence(p<0.1) on the management evaluation scores of public firms. Total capital productivity, the scale of sales and the financial ratio, shows a significant positive impact relationship (p<0.01) on management evaluation scores, so [H II-1] and [H II-2] were adopted. However, [H II-3] was rejected because the total asset turnover, a measure of asset efficiency as a financial ratio, does not have an impact on management assessment scores.
Y OLS OLS_dum fixed random
MPI .12116807*** .08617056** .14750114*** .12932476***
CRS .03875603 .03947009* .06672599 .04519655*
lnsal .01035724** .01035924*** .08412413 .01129539**
x1 .03325737** .03754734** .00490372 .02793612 x2 .10191458*** .10617384*** .07526732 .09997756***
x3 .0028268 .00187757 -.20163865 .00175387
2015 .06959783***
2016 -.01411033
2017 .04535404***
2018 .03982359**
cons .45521117*** .45995551*** -.53729231 .43207289***
R 2 .28157012 .43566259 .18576141 0.1612 Table 8 Panel regression results for total score by MPI
* p<.1; ** p<.05; *** p<.01, N=149
4.7 MPI Discriminant Analysis Results
Table 9 is a multivariate regression analysis of panel probit and panel logit between the productivity(MPI) of Korean public firms and related variables. Although the Pseudo R2/χ2 values and significant probabilities(P) are not suitable for all three models, but the interpretation of the meaning is as follows.
MP probit xtprobit xtlogit
Y .03631131** .03630037** .05864561**
CRS -.02262734 -.02242988 -.02272879 X1 -.21260838 -.21275319 -.33650129 X2 .19050581 .1905668 .27457553 X3 -.0952559 -.09526878 -.13695325 lnsal -.04715601 -.04711982 -.07979214 constant -2.4032086 -2.4029444 -3.8411334 Log likelihood -94.5803 -94.5803 -94.6108
Pseudo R 2 /χ 2 0.0360 6.70 6.48 Prob > χ 2 0.3145 0.3490 0.3712 Table 9 Panel Probit & Logit Results for MPI
* p<.1; ** p<.05; *** p<.01, N=149.