태안 바다목장 해역에서 새우조망에 어획된 수산생물의 종조성 및 군집구조
박준·조현수*·임양재·차병열·권대현·류동기1·황학진2
국립수산과학원 서해수산연구소 자원환경과, 1군산대학교 수산과학과, 2한국수산자원관리공단 전략사업실
Species composition and community structure caught by shrimp beam trawl in the marine ranching ground of Taean, Korea
Jun P
ARK, Hyun-Su J
O*, Yang-Jae I
M, Byung-Yeul C
HA, Dae-Hyeon K
WON, Dong-ki R
YU1and Hak-Jin H
WANG2Fisheries Resources and Environment Division, West Sea Fisheries Research Institute, National Fisheries Research & Development Institute, Incheon 400-420, Korea
1
Department of Fisheries Science, Kunsan National University, Kunsan 573-701, Korea
2
Strategic Project Division, Korea Fisheries Resources Agency, Busan 612-020, Korea
Species composition and seasonal variation of aquatic organism in the marine ranchig ground of Taean, Korea were investigated using shrimp beam trawl from January to December 2010. A total of 99 species, 5,355,816ind./km
2and 84,697 ㎏/km
2of aquatic organism were collected. Among them, fish include 9 orders 33 families 54 species, crustaceans include 2 orders 15 families 30 species, cephalopods consist of 3 orders 4 families 5 species, gastropods include 2 orders 3 families 4 species, echinoidea sp. include 1 order 2 families 2 species, bivalves were composed of 2 orders 2 families 2 species, and holothuroids include 1 family 1 order. According to the dominants by month, Palaemon gravieri was dominant in January, Cynoglossus
joyneri was dominant in February, March, and June, and Hexagrammos otakii was dominant, in July. AndOratosquilla oratoria was dominant echinoidea sp. was dominant in April, May, and August and in September, October, November, and December. Cluster analysis based on species composition of the 38 most common species showed that the species were separated into 5 different groups. Group A was composed of species which were abundant in spring and summer, group B was composed of year-round residents, and group C was composed of species which were abundant in autumn.
Keywords: Species composition, Community structure, Taean marine ranching area, Shrimp beam trawl
*Corresponding author: [email protected], Tel: 82-32-745-0610, Fax: 82-32-745-0569 J. Kor. Soc. Fish. Tech., 49 (3), 238-249, 2013
http://dx.doi.org/10.3796/KSFT.2012.49.3.238
서 론
1960 년대 이후 황해 연안 역에는 한국과 중국 의 급속한 산업화와 도시화로 많은 인구와 산업 시설이 들어서 있으며, 산업폐기물 및 오염물질 의 발생량과 발생증가율이 매우 높아져 생산 잠 재력이 급격히 감소한 것으로 나타나고 있다. 이 러한 연안의 생산 잠재력을 회복하고 생물자원 의 지속가능한 높은 생산력을 효율적으로 유지, 이용하기 위하여 다양한 방안들이 적용되어 왔 으며, 자원조성 및 유지관리 그리고 체계적인 어 장관리를 위한 방안 중 가장 환경 친화적이고 생 태계를 보전할 수 있는 대단위의 첨단기술을 도 입한 방법이 대규모 바다목장의 조성이다. 1998 년 9개년 계획으로 통영해역에서 먼저 실시되었 고, 현재 전남, 동, 서, 제주해역의 5개 지역으로 추진되고 있으며, 자원조성을 위하여 조피볼락, 볼락, 감성돔, 참돔, 노래미, 넙치, 전복, 개조개 등의 대상종을 매년 방류하고 있다. 그 중 본 연 구의 대상지역인 태안 바다목장은 2002년부터 2012년까지 국비를 투입하여 충남 태안군 안면 읍 일대 2,500ha를 대상으로 어장환경 조성 및 갯벌생태 체험형 바다목장 조성을 목표로 하고 있으며, 서해안의 특성을 잘 갖추고 있는 태안지 역에 바다목장 기반조성, 바다목장 조성, 사후 관리 및 효과조사의 총 3단계로 추진하였다 (NFRDI, 2009).
지금까지 서해를 중심으로 한 어류군집에 관 한 연구는 고군산군도 연안의 어류상 (Kim and Lee, 1993), 태안 연안의 어류상 (Choi and Jang, 2007), 한국 서해 어류상의 재검토 (Lee, 2004), 오터트롤에 채집된 황해 동부해역 어류의 종조 성 및 자원밀도 (Im, 2007), 천수만 어류의 종조 성 변화 (Lee, 1996), 아산만 천해역 수심에 따른 어류 종조성의 계절변동 (Hwang and Lee, 1999) 등이 있고, 바다목장의 군집 대한 연구는 울진 (Yoon et al., 2011), 제주 (Oh et al., 2010), 사천 (Kim et al., 2010) 등에서 이루어져 왔으나, 바다 목장이 조성되고 있는 태안 주변해역의 수산생
물 자원에 대한 연구가 부족한 실정이다.
본 조사는 태안 바다목장해역에서 출현하는 수산생물의 자원생물학적 연구의 일환으로, 새 우조망에 어획되는 수산생물을 정량적으로 조 사하여 월별 어종별 자원밀도를 구하였고, 종조 성 및 종다양도지수를 구하여 군집구조를 분석 함으로써 태안 바다목장에 서식하는 수산생물 들을 파악하고자 하였다.
재료 및 방법
본 조사는 태안 바다목장 지역에서 2010년 1 월부터 12월까지 매월 1회씩 조사하였고, 사용된 선박은 FRP 6.67톤이며 시험어구는 새우조망이 었다. 새우조망 그물의 총 길이는 25m, 빔 길이는 6m 로써 그물코 크기는 날개그물 40mm, 몸통그 물 35mm, 끝자루그물 30mm이었다 (Fig. 1). 수온 및 염분은 YSI (YSI사, 650MDS)를 이용하여 5개 정점의 저층수온 및 염분을 각 1회씩 측정하였으 며 평균으로 계산하여 월별 수온 및 염분으로 사 용하였다. 어획조사는 어구 예망이 가능한 태안 바다목장 해역내 5개 정점 (Fig. 2)에서 실시하였 다. 예망시간은 30분을 기준으로 하였으나, 저층 상태 및 주변 어구 설치 등을 고려하여 정점에 따 라 15∼30분간 예망하였다. 채집된 어획물의 종 동정 및 검색은 Kim et al. (2005)을 참고로 하였 고, 분류체계 및 학명은 Kim et al. (2005)에 따라 정리하였다. 어획조사를 통하여 자원밀도를 추 정하기 위하여 소해면적법을 이용하였으며, 이 때 예망거리는 예망시간 및 평균 예망속도로부 터 계산하였다. 계산된 소해면적과 개체수, 생체 량을 다음과 같은 식에 적용하여 자원밀도를 계 산하였다. 계산 시 어획효율은 0.5로 적용하였다.
소해면적〓어구망폭 (6m)×예망거리
자원밀도〓개체수 (생체량) / (소해면적×0.5)
군집구조의 분석은 월별로 출현종수, 개체수,
생체량에 대하여 양적변동을 비교하였다. 군집
의 특성을 설명하는 생태지수는 종다양도지수
Fig. 1. Layout of net and schematic diagram for the shrimp beam trawl gear.
PVC 105m/m 13pcs
Steel pipe f50 6.00
Steel pipe f50
0.85 Weigth 1kg
96pcs MAT
Td (ply)
PE
260 (30) 40 350
PE
260 (45) 35 332
PE
260 (30) 120
PPf3 1.50
PPf15
1.20 SBRf50
1.20 80
130
150 100 150 100
30 110
PPf15, 9.50
PPf15, 9.50
PPf15 , 11.45
SBRf50, 12.00
100 110
200 200
100 130
80 mm ML
(Shannon and Weaver, 1949)를 사용하였으며 다 음과 같다.
ni ni
H´
〓- ∑
si〓1
[___ ln (___)]
N N
여기서, S는 전체 어획 종수, N은 군집내의 총 개 체수, n
i는 i번째 종의 개체수를 각각 나타낸다.
종간 출현시기의 유사성을 분석하기 위하여 조사기간 동안 5회 이상 출현한 38종을 대상으 로 Bray and Curtis (1957)의 백분유사도 (percent similarity) 지수를 이용하였다. 구해진 유사도는 group-average 방법을 이용하여 집괴분석 (cluster analysis)을 실시한 뒤, 그 결과를 수상도 (dendrogram) 로 나타내었다.
결 과
수온 및 염분
조사기간 동안 태안 바다목장의 각 정점에서 관측된 저층수온과 염분은 정점에 따른 차이는 거의 없었다. 월별 수온은 4.5∼24.3℃의 범위를 보였다. 2010년 2월에 4.5℃로 가장 낮게 나타났 으며, 4월과 5월에 점점 증가하기 시작하여 10℃
이상의 수온을 유지하였고, 9월에 24.3℃로 가장 높게 나타났다. 그 이후 10월에 18.4℃로 점차 수 온이 내려갔다. 월별 염분은 4월에 33.21로 가장 높은 염분을 보였으며, 그 후 6월부터 점점 낮아
져 9월에 29.95로 가장 낮은 염분을 나타내었다.
10월부터는 점차 염분이 상승하기 시작하여 12 월에 31.50으로 다소 높게 나타났다 (Fig. 3).
분류군별 종조성 및 출현양
조사기간 동안 어획된 수산생물은 총 20목 60 과 99종으로 단위면적당 개체수와 생체량은 각
Fig. 2. Map showing the study area in the marineranching ground of Taean, Korea.
36。48′N
36。36′
36。24′
126。06′ 126。18′ 126。30′E
Fig. 3. Monthly variation of bottom water temperature and salinity in the marine ranching ground of Taean, Korea from January to December 2010.
34
32
30
28 30
20
10
0
1 2 3 4 5 6 7 8 9 10 11 12 Month
Watertemperature(。C) Salinity (psu)
Fig. 4. Ratio (%) of individuals (a) and biomass (b) by taxa of aquatic organism caught by shrimp beam trawl in the marine ranchig ground of Taean, Korea from January to December 2010.
각 5,355,816ind./km
2, 84,697kg/km
2이었다. 어류 가 54종으로 가장 많았고, 갑각류가 30종, 두족 류가 5종, 복족류가 4종, 성게류가 2종, 이매패 류가 2종, 해삼류가 1종이었다 (Table 1). 개체 수의 비율은 성게류가 65.6%로 가장 높았고, 다 음으로는 어류가 17.9%, 갑각류가 8.4%, 두족류 가 7.2%, 복족류가 0.7%, 이매패류가 0.1%, 해 삼류가 0.1%의 순이었다. 생체량의 비율은 어 류가 66.1%로 가장 높았고, 갑각류가 11.7%, 성 게류가 7.6%, 두족류가 6.4%, 이매패류가 3.7%, 복족류가 3.6%, 해삼류가 0.9%의 순이었다 (Fig. 4).
월별 종조성 및 출현양
조사시기별 평균자원밀도의 변동을 보면 10 월에 12,586kg/km
2으로 가장 높았고, 12월이 2,931kg/km
2로 가장 낮은 자원밀도를 차지하였 다. 9월과 10월의 경우 성게의 다량 어획으로 10,000kg/km
2이상의 자원밀도를 나타냈으며, 5 월, 6월, 8월은 8,000kg/km
2이상의 높은 자원밀 도를 나타내었다. 분류군별로 보면 조사기간 동 안 모두 어류의 자원밀도가 높았으며, 어류는 5 월에 6,596kg/km
2으로 가장 높았고, 12월에 2,599 ㎏/km
2으로 가장 낮았다. 갑각류의 경우 8 월에 3,193kg/km
2으로 가장 높았고, 12월에 19kg/km
2으로 가장 낮았다. 복족류는 10월에 1,248kg/km
2로 가장 높았고, 12월에 30kg/km
2으 로 가장 낮았다. 두족류는 10월에 1,499kg/km
2로 가장 높았고, 6월에 152kg/km
2로 가장 낮았다.
이매패류의 경우 5월, 6월, 9월, 11월에 어획되었 으며 6월에 2,181kg/km
2로 가장 높았고, 9월에 96kg/km
2으로 가장 낮았다. 성게류는 3월, 6월, 7 월을 제외한 전월에 어획되었으며 10월에 3,786kg/km
2으로 가장 높은 자원밀도를 나타냈 고, 8월에 19kg/km
2로 가장 낮은 자원밀도를 나 타냈다. 해삼류는 4, 5, 11, 12월을 제외한 월에 어획되었으며, 6월에 213kg/km
2으로 가장 높았 지만 다른 분류군에 비해 낮은 자원밀도를 보였
다. 월별 개체수를 보면 10월에 총 3,336,769 ind./km
2으로 가장 많은 개체수를 나타냈으며, 전체 개체수의 50.6%를 차지하였다. 12월에 총 68,613ind./km
2으로 조사기간 중 가장 낮은 개체 수를 나타내었고 전체 개체수의 1.6%를 차지하 였다. 어종별로 보면 성게 (echinoidea sp.)가 2,959,926ind./km
2으로 가장 많은 개체수를 나타 냈고 전체 개체수의 55.3%를 차지하였다. 다음 으로는 말똥성게 (Hemicentrotus pulcherrimus)가 550,484ind./km
2으로 전체 개체수의 10.3%를 차 지하였다.
월별 생체량은 총 84,697kg/km
2로 10월에 12,586kg/km
2로 전체 생체량의 13.9%를 차지하 여 가장 높은 생체량을 나타냈고, 12월에 2,931kg/km
2로 2.8%를 차지하여 가장 낮은 생체 량을 나타내었다. 어종별로 보면 홍어 (Okamejei
kenojei)가 26,734kg/km2로 전체 생체량의 31.6%
를 차지하여 가장 높은 생체량을 나타냈다. 다음 은 참서대 (Cynoglossus joyneri)가 6,565kg/km
2로 전체 생체량의 7.8%를 차지하였다 (Table 1).
군집구조
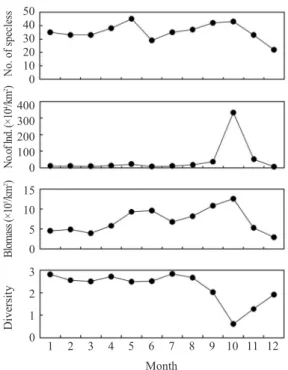
월별 출현종수는 5월에 45종으로 가장 많았
고, 고수온기인 8, 9, 10월에 각각 37종, 42종, 43
종으로 많은 종수를 나타냈으며, 저수온기인 11
월부터 감소하여 12월에 22종으로 가장 적은 종
수를 나타냈다. 개체수의 경우 가을철인 10월에
3,336,769ind./km
2로 가장 많은 개체수를 보였고,
겨울철인 12월에 68,613ind./km
2로 가장 낮은 개
체수를 보였다. 생체량 역시 개체수와 같이 10월
에 12,586kg/km
2로 가장 높았고, 12월에
2,932kg/km
2로 가장 낮았다. 월별 종다양도지수
는 7월에 가장 높은 지수를 보였고, 1월부터 9월
까지 2.02∼2.83의 범위로 큰 차이를 보이지 않
았다. 11월과 12월에 1.28, 1.92로 다소 낮은 지수
를 보였으며, 성게류가 극우점 하였던 10월에
0.62로 가장 낮았다 (Fig. 5).
Table 1. Species composition of the aquatic organism caught by shrimp beam trawl in the marine ranching ground of Taean, Korea from January to December 2010. N and W represent the number of individuals and biomass in kilogram per 1km2 Scientific nameJan.Feb.Mar.Apr.MayJun.Jul.Aug.Sep.Oct.Nov.Dec.TotalPercetage NWNWNWNWNWNWNWNWNWNWNWNWNWNW Pisces Acentrogobius pellidebilis Amblychaeturichthys hexanema Apogon lineatus Careproctus rastrinus Chaeturichthys stigmatias Chirolophis japonicus Chirolophis wui Cociella crocodila Coilia mystus Coilia nasus Collichthys lucidus Collichthys niveatus Conger myriaster Cottiuscuius schmidti Cryptocentrus filifer Cynoglossus abbreviatus Cynoglossus joyneri Engraulis japonicus Hemitripterus villosus Hexagrammos otakii Johnius grypotus Konosirus punctatus Larimichthys polyactis Leiognathus nuchalis Liparis chefuensis Liparis tanakai Lophius litulon Okamejei kenojei Pagrus major Pampus echinogaster Paralichthys olivaceus Paraplagusia japonica Pennahia argentata
203 7,467 254 8,688 891 3,721 1,313 13,621 254 1,929 863 254 10,232 711
1 94 8 62 12 47 9 374 57 86 1,298 38 1,101 76
154 3,480 11,959 462 2,384 154 21,378 988 1,038 154 15,915 526
0 53 92 7 27 1 580 58 12 501 2,185 115
3,558 346 3,002 4,258 208 346 562 346 19,134 346 216 11,448 707
19 3 39 38 3 1 4 21 519 88 409 1,501 71
563 11,729 3,645 1,148 261 684 447 234 17,213 684 19,370 237
2 74 39 13 3 7 3 11 412 38 2,704 14
623 8,794 257 214 447 31,561 1,119 5,215 1,860 270 21,414 893 189
2 69 2 21 3 863 213 1,147 12 9 2,581 169 1
2,930 158 162 15,320 158 12,107 1,195 14,511 158 1,420
22 2 1 514 73 706 12 3,214 119 638
1,729 1,126 150 904 13,191 150 18,060 1,350 15,362 301 150 2,031
11 7 38 7 441 44 599 23 3,053 77 13 93
5,551 1,180 166 542 20,452 332 9,943 14,437 9,961 2,798 4,175
12 7 21 4 493 1 389 2,045 69 116 98
7,298 181 466 900 32,687 160 2,377 1278 17,516 68,610 181 3,918 16,558
19 1 66 7 842 0 49 6 2,580 1,621 18 158 359
11,709 360 3,921 1101 157 26,640 37,505 4,730 540 11,633 1,502 6,967 30,914
38 0 37 135 1 932 157 206 6 2,227 53 780 282
34,234 6,211 2557 13,615 1091 500 187 11,469 5,161 1,303
151 79 19 343 3 48 0 1,718 531 5
2,307 4,481 313 10,355 758 783 189 4,894 1,161
13 67 3 251 1 51 215 1,825 141
1,187 90,197 2,665 346 32,387 254 150 1,567 9,837 16,217 926 1,152 380 7,293 8,456 580 235,167 39,846 2,028 57,315 4,945 270 1,278 187 1,038 1,422 254 168,200 80,232 181 24,801 150 55,172
4 428 15 3 409 8 38 201 75 130 11 15 42 84 64 32 6,565 162 475 3,376 54 9 6 0 12 2,423 38 26,734 1,862 18 2,887 13 838
0.0 1.7 0.0 0.0 0.6 0.0 0.0 0.0 0.2 0.3 0.0 0.0 0.0 0.1 0.2 0.0 4.4 0.7 0.0 1.1 0.1 0.0 0.0 0.0 0.0 0.0 0.0 3.1 1.5 0.0 0.5 0.0 1.0
0.0 0.5 0.0 0.0 0.4 0.0 0.1 0.2 0.1 0.1 0.0 0.0 0.1 0.1 0.1 0.0 7.3 0.2 0.5 4.7 0.1 0.0 0.0 0.0 0.0 3.1 0.0 30.4 2.1 0.0 3.6 0.0 1.0
Table 1. continued Scientific nameJan.Feb.Mar.Apr.MayJun.Jul.Aug.Sep.Oct.Nov.Dec.TotalPercetage NWNWNWNWNWNWNWNWNWNWNWNWNWNW Pholis fangi Platycephalus indicus Pleuronectes yokohamae Pleuronichthys cornutus Pseudorhombus cinnamoneus Repomucenus koreannus Saurida elongata Scomber japonicus Sebastes koreanus Sebastes schlegelii Setipinna tenuifilis Sillago japonica Sphyraena obtusata Takifugu niphobles Tarphopselegans Thamnaconus modestus Trachurus japonicus Tridentiger barbatus Uranoscopus tosae Zebrias fasciatus Zoarces gillii Crustacean Alpheus digitalis Alpheusjaponicus Charybdis bimaculata Charybdis japonica Crangonhakodatei Decapoda.sp Eucrate crenata Exopalaemon carinicauda Fenneropenaeus chinensis Heptacarpus futilirostris Heptacarpusrectirostris Hyascoarctatus alutaceus Hyastenus diacanthus Leptodius exaratus
1,016 254 231 203 1,094 1,820 5,091 711 1,625 254 254 3,138
93 24 1 8 137 6 12 3 3 2 0 6
632 2,327 1,152 462 343 745 154 496 260 1,218
3 310 7 49 1 2 1 1 1 2
1,038 1,886 554 346 424 640 1,916 208 2,233 1,087
8 312 3 3 1 1 2 5 2 1
671 1,665 721 1,645 495 11,472 467 467 224 6,095 1,879
8 489 3 429 1 33 1 1 14 13 1
2,014 1,917 244 2,727 3,351 691 404 3,928 704 2,080 214 12,536 244 257
279 521 3 142 530 24 2 13 1 7 59 23 2 0
1,531 4,516 158 224 2,500 566 1,960 378
138 706 1 10 340 9 10 6
2,575 3,043 2,093 225 1,598 2,365 907 1,731 4,934 676 1,465 376
235 448 100 38 24 80 19 9 22 58 19 1
4,927 755 166 944 2,688 333 166 4,258 1,683 1,497 167 611 3,906 1,328 499
524 95 7 83 32 59 10 246 29 132 12 3 19 97 4
1,712 3,399 571 166 1,482 166 181 752 2,604 1,125 0 181 752 760 1,403 513
208 350 27 16 9 8 5 11 56 8 1 1 1 4 134 6
2,137 994 180 321 7,367 1,222 336 658 3,695 200 180 180 1014 1,440 157
360 118 23 40 21 25 7 31 14 91 2 0 68 56 0
727 667 3,689 167 833 562 167 557 333 546 10,699
170 130 12 9 87 1 0 1 2 64 12
157 157 313 643 4,202 643
16 1 16 1 8 2
2,341 15,622 22,341 3,422 1,657 19,884 1,555 166 4,003 18230 562 6,851 41,01 691 2,858 200 1,125 180 0 167 346 20,675 9,778 12,480 6,269 37,073 4,203 634 254 1,440 2,729 2,966 3,398 1,218 157
19 1,915 3,587 182 177 116 84 8 190 1,955 1 71 188 24 13 91 8 2 1 12 3 66 21 55 498 62 45 2 0 56 3 2 7 2 0
0.0 0.3 0.4 0.1 0.0 0.4 0.0 0.0 0.1 0.3 0.0 0.1 0.1 0.0 0.1 0.0 0.0 0.0 0.0 0.0 0.0 0.4 0.2 0.2 0.1 0.7 0.1 0.0 0.0 0.0 0.1 0.1 0.1 0.0 0.0
0.0 2.3 4.2 0.2 0.2 0.1 0.1 0.0 0.2 2.3 0.0 0.1 0.2 0.0 0.0 0.1 0.0 0.0 0.0 0.0 0.0 0.1 0.0 0.1 0.6 0.1 0.1 0.0 0.0 0.1 0.0 0.0 0.0 0.0 0.0