A Study on Multi Fault Detection for Turbo Shaft Engine Components of UAV Using Neural Network Algorithms
Changduk Kong *, †Jayoung Ki **, Seonghee Kho*, Changho Lee***
* Dept. of Aerospace Eng., Chosun Univ.
375, Seosuk-dong, Dong-gu, Kwangju, Republic of Korea
†** Easy Gas Turbine R&D Co., Ltd.
1412, Dunsan-dong, Seo-gu, Daejeon, Republic of Korea [email protected]
***Korea Aerospace Research Institute
45 Eoeun-dong, Yuseong-gu, Daejeon, Republic of Korea
Abstract
Because the types and severities of most engine faults are various and complex, it is not easy that the conventional model based fault detection approach like the GPA (Gas Path Analysis) method can monitor all engine fault conditions. Therefore this study proposed newly a diagnostic algorithm for isolating and diagnosing effectively the faulted components of the smart UAV propulsion system, which has been developed by KARI(Korea Aerospace Research Institute), using the fuzzy logic and the neural network algorithms.
A precise performance model should be needed to perform the model-based diagnostics. The based engine performance model was developed using SIMULINK. For the work and mass flow matching between components of the steady-state simulation, the state-flow library was applied. The proposed steady-state performance model can simulate off- design point performance at various flight conditions and part loads, and in order to evaluate the steady- state performance model their simulation results were compared with manufacturer’s performance deck data.
According to comparison results, it was confirm that the steady-state model well agreed with the deck data within 3% in all flight envelop.
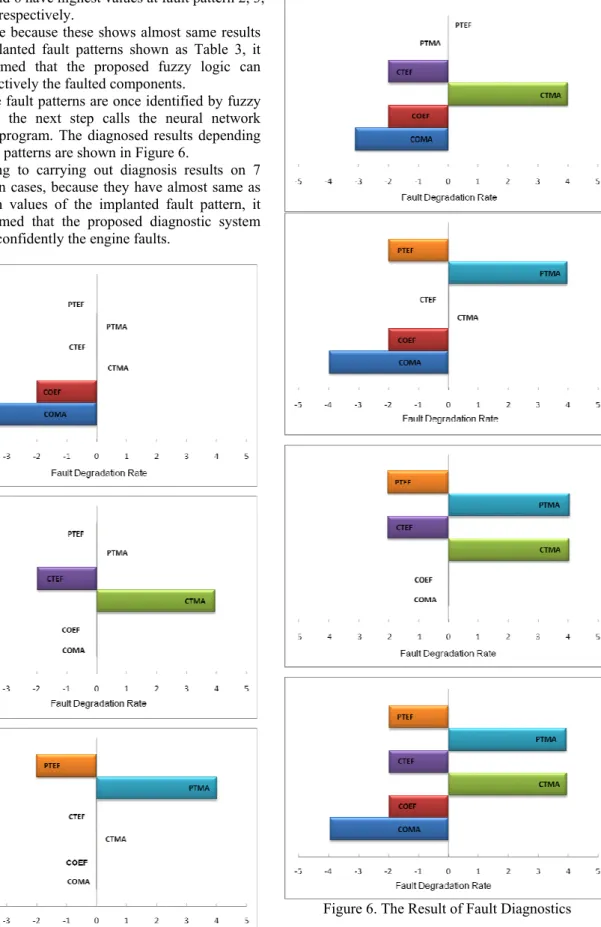
The diagnosis procedure of the proposed diagnostic system has the following steps. Firstly after obtaining database of fault patterns through performance simulation, then secondly the diagnostic system was trained by the FFBP networks. Thirdly after analyzing the trend of the measuring parameters due to fault patterns, then fourthly faulted components were isolated using the fuzzy logic. Finally magnitudes of the detected faults were obtained by the trained neural networks.
Because the detected faults have almost same as degradation values of the implanted fault pattern, it was confirmed that the proposed diagnostic system can detect well the engine faults.
Introduction
During gas turbine operation, both obtaining high reliability and minimizing the operating cost are very important issues to engine manufacturers as well as
engine users. Especially if the UAV propulsion system has faults, it is not easy to recover the system from the abnormal, and hence more accurate diagnostic technology must be needed to keep the operational reliability. For this purpose, the development of the health monitoring system which can monitor remotely the engine condition and detect engine faults and performance deterioration should be required.
Performance degradations of the propulsion system are caused by faults of engine major components such as compressors and turbines, faults of engine related accessory systems including fuel and lubrication systems, and mechanical faults of rotor shaft and bearings.
Although outage rate of compressor or turbine is low, its failure gives great severe impact to overall engine performance and down time for its repair and maintenance is much longer than other components.
Therefore the model based engine heath monitoring methods like the GPA(Gas Path Analysis) has been used for ground base monitoring or on-condition monitoring of major gas path components such as compressor and turbine. Performance diagnosis of major gas path components using the GPA can be carried out by relationships of independent parameters such as component efficiencies, mass flow parameters, dependent parameters such as measurable performance parameters and the FCM(Fault Coefficient Matrix). Because the FCM, which is a inverse matrix of the ICM(Influence Coefficient Matrix) that is relationship between measurable dependent parameters (for instance, pressure, temperature, fuel flow, etc.) and independent parameters, is a non-square matrix, there might be some error to obtain the inverse matrix due to numerical treatment
1).
Recently AI(Artificial Intelligence) techniques including especially NN(Neural Network) have been applied to gas turbine engine diagnostics. The NN has inherent features that make them particularly suited to diagnostic tasks
2).
Generally, changes of measured parameters in the engine gas path reflect changes of components’
characteristics. If the interrelationship between their
changes can be found using the NN, the different
types of faults can be diagnosed. Therefore lots of
research works have been conducted on engine fault diagnosis using the NN, and several NN approaches for engine diagnostics have been developed
3).
it takes long time to training the Neural Network.
Moreover in order to detect effectively various types of multi faults due to combination of single faults, the diagnostic system can be more complicated.
Therefore this study proposed a diagnostic method that after identifying faulted major gas path components, and then the Neural Network diagnostic system trained by artificially implanted faults at various operation conditions can diagnose quantitatively the engine condition. The fuzzy logic was applied for isolating the faulted components, and the FFBP(Feed Forward Back Propagation) algorithms was used for training measured data of faulted components. And artificially implanted deteriorate performance data for training the Neural Network were obtained from the performance simulation using GASTURB program.
The Study Engine
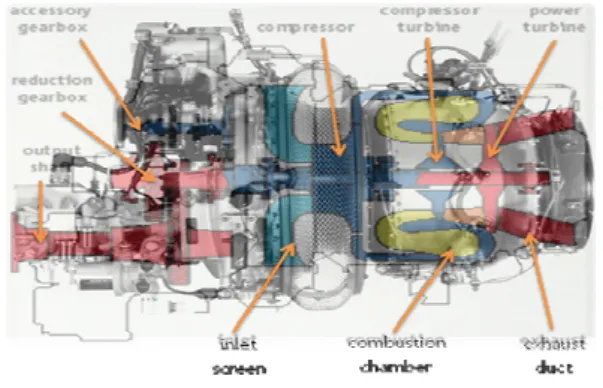
A performance simulation program for the PW206C turbo shaft engine that was selected as a power plant for the tilt rotor type Smart UAV (Unmanned Aerial Vehicle) developing by KARI (Korea Aerospace Research Institute) was developed. Figure 1. shows the schematic engine layout.
Figure 1. Engine schematic layout of PW206C turbo shaft engine
As seen in Figure 1, the engine has a gas generator composed of single stage centrifugal compressor, a reverse flow annular type combustion chamber and a single stage compressor turbine, and a power section composed of single stage free power turbine, a exhaust duct, a reduction gear box and an output drive shaft. System Integration Group of the Smart UAV R&D Center of KARI provided the following required operating range for the propulsion system as shown in Table 1.
Table 1. Operating range of propulsion system smart UAV
Ambient Temp. ISA ± 30
Altitude (km) 0 ~ 5
Flight Velocity (km/hr) 0 ~ 500
Table 2. shows design performance data at maximum take-off condition, which were provided by the engine manufacturer (EEPP Manual), and Table 3 explains the engine operation limit.
Table 2. Design performance data
Variable Values
Atmospheric condition S/L, Static STD Condition Mass flow rate (kg/s) 2.004 Fuel flow rate (kg/s) 0.0392 Compressor pressure
ratio 7.912
Exhaust Gas
temperature (K) 865
Power (kW) 416
SFC (kg/kW hr) 0.34
Gas generator rotational
speed (100% RPM) 54751
Propeller rotational
speed (100% RPM) 6000
Table 3. Engine operating limit
Torque (N·m) 759.26
Power (kW) 418
Bleed air (%) 5
Compressor speed (rpm) 58900
Fuel flow(kg/hr) 192.78
Comp. delivery pressure (kPa) 1034.2
Power limit (kW) 5.96
Steady-State Performance Modeling
The overall SIMULINK® model for the PW206C turbo shaft engine is expressed by Figure 2.
Figure 2. Steady-state performance model using SIMULINK
®The overall model is composed of modular blocks
representing individual components such as the
ambient subsystem for flight environment condition,
the intake subsystem, the compressor subsystem, the combustor subsystem, the compressor turbine subsystem, the power turbine subsystem and the match subsystem for work and mass flow matching between components.
In this SIMULINK model, the β-line method was used for rapid convergence, and the Reynolds’s effect was considered for precise calculation. Work matching between the compressor and the compressor turbine and mass flow matching between the gas generator and the power turbine, the subsystem ‘State Flow’ was proposed. After this subsystem calculates the error on the mass flow and work matching, it searches repeatedly the updated β values until the matching error reaches to 0.5%. Figure 3 shows the flow chart for the steady-state performance simulation model.
Figure 3. Flow chart for steady-state performance simulation
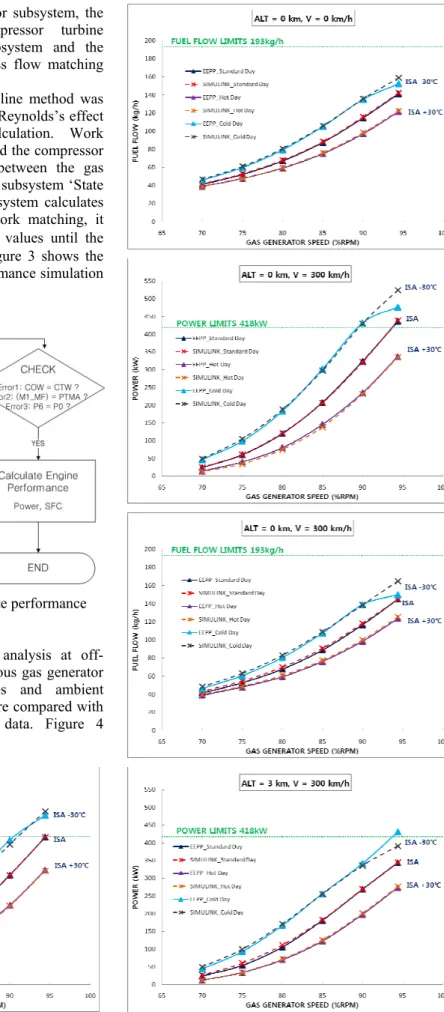
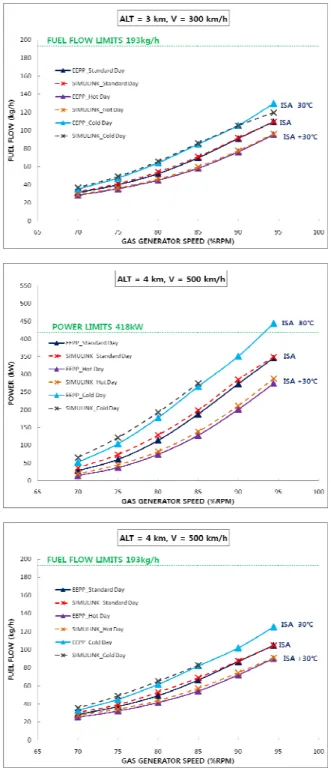
After carrying out performance analysis at off-
design point conditions such as various gas generator
rotational speeds, flight velocities and ambient
temperatures, the analysis results were compared with
manufacturer’s performance deck data. Figure 4
shows the comparison result.
Figure 4. Results of steady-state performance analysis According to comparison results, analysis results of the proposed model were well agreed with the performance deck data within 3% error. At specific operation regions, because the engine performance exceeds the engine operation limit, the engine operator must give attention to handle the engine in these regions.
Fuzzy Logic for Faulted Components Isolation The fuzzy logic is conceptually easy to understand and tolerant of imprecise data. Also the fuzzy logic can model nonlinear functions with arbitrary complexity and it is based on natural language.
Furthermore, it allows much greater flexibility in
formulating system descriptions at the appropriate level of details. In fuzzy systems, the reverse situation prevails. The input and output variables are encoded in “fuzzy” representation, while their inter- relationships take the form of well-defined if/then rules
9).
In this study, faulted components identification method using the fuzzy logic is newly proposed with the measurement parameter variation trends. The fuzzy logic is applied by using the Fuzzy Toolbox provided by the MATLAB
10).
Measurement parameters provided by the Smart UAV propulsion system are the gas generator rotational speed(Ng), the power turbine rotational speed(Np), the exhaust gas temperature(EGT), the fuel flow(WF) and the torque(T). However because these measurement parameters are not enough to diagnose more accurately the major component condition, some additional measurement parameters such as the compressor exit pressure(COP) and temperature (COT) are required for this study.
It was considered that major component fault patterns were the single fault patterns of compressor, compressor turbine and power turbine, the multiple fault patterns simultaneously occurred at two components or three components.
Generally according to Diakunchak’s experimental results, the compressor fouling gives rise to decrease of both air mass flow parameter and isentropic efficiency of compressor, and the turbine corrosion and erosion give rise to increase of air mass flow parameter and decrease of isentropic efficiency of turbine
5). Therefore this study classified the fault patterns occurred at major components into 7 cases shown as Table 4.
Table 4. Estimated Fault Patterns FP 1 Compressor fouling
FP 2 Compressor turbine erosion
FP 3 Power Turbine Erosion
FP 4 Comp. Fouling & Comp. turbine erosion
FP 5 Comp. Fouling & & Power Turbine Erosion
FP 6 Comp. turbine erosion & Power Turbine Erosion
FP 7 Comp. Fouling & Comp. turbine erosion
& power turbine erosion
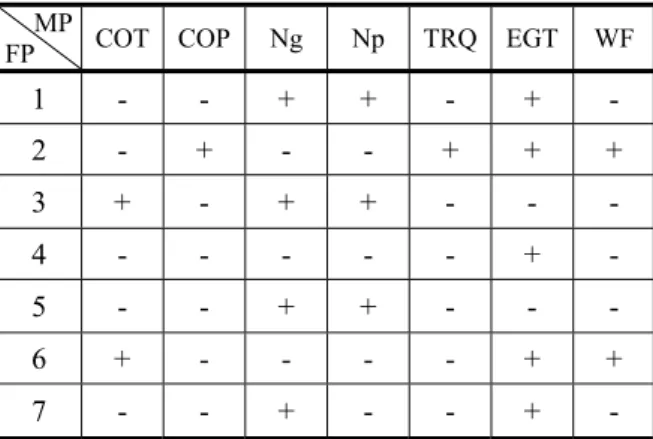
From investigation of measurement parameter
changes, it was found that each fault pattern has its
own different trend shown as Table 5.
Table 5. Measurement Parameter Variation Trend with the Fault Pattern
MP
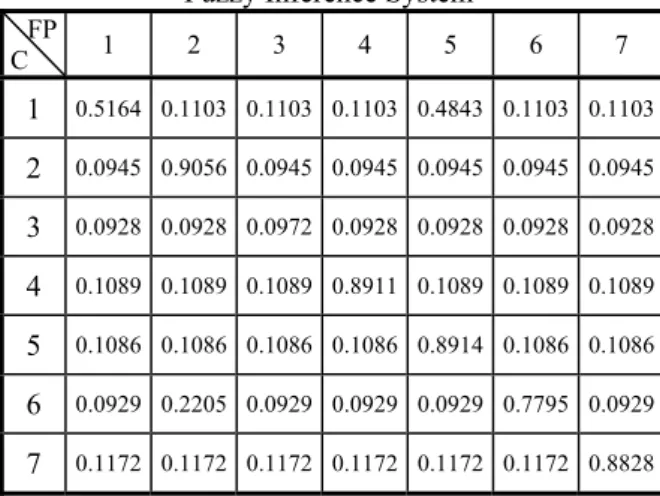
FP COT COP Ng Np TRQ EGT WF 1 - - + + - + - 2 - + - - + + + 3 + - + + - - - 4 - - - + - 5 - - + + - - - 6 + - - - - + + 7 - - + - - + - Figure 5 shows the Mamdani-type fuzzy inference system for isolating the faulted component which is illustrated as FIS Editor of MATLAB commercial program.
Input parameters for fuzzyfication are changes of measurement parameters based on clean engine parameters, and output parameters are 7 fault patterns cases.
The triangular-shaped membership function type is used for calculation, and the ‘Centroid’ calculation scheme, which returns the center of area under the curve, is applied for defuzzification. Output parameters have values of 0 to 1, and if the value approaches to 1 it may be much closer to the predicted fault pattern.
Figure 5 Fuzzy Inference System for Faulted Component Identification
Neural Network Design for Fault Diagnostics The FFBP(Feed Forward Back Propagation) algorithms was used for training measured data of faulted components. The BPN was created by generalizing the Widrow-Hoff learning rule to multiple-layer networks and nonlinear differentiable transfer functions. Input vectors and the corresponding target vectors are used to train to train a network until it can approximate a function, associate input vectors with specific output vectors, or classify input vectors in an appropriate way as defined. Networks with biases, a sigmoid layer, and a linear output layer are capable of approximating any function with a finite number of discontinuities. Back propagation is a gradient descent algorithm, as is the Widrow-Hoff learning rule, in which the network weights are moved along the negative of the gradient of the performance function
11).
The FFBP network consists of one input layer with 7 neurons, one hidden layer with one neurons and one output layer with 6 neurons. . The input layer has 7 neurons such as measurement parameters of COT, COP, Ng, Np, TRQ, EGT and WF, and the output layer has 6 neurons such as mass flow parameters and isentropic efficiencies of compressor, compressor turbine and power turbine.
The tangent sigmoid function (1) was used as the transfer function of the hidden layer, and the linear transfer function (2) was applied as the transfer function of the output layer
6).
x x
x x
e e
e
y e
α αα α
−
−
+
= − (1)
x
y = (2) Where e means exponential, y and x are output and input values respectively, and b is defined as the bias.
α is tangential parameter, and it was set as 1 in this work.
The BPN needs differential operation of the transfer function for effective calculation in the forward pass.
Therefore differential equations of tangent sigmoid and linear transfer functions are respectively as follows
6).
( 1 [ f ( ) x ]2)
y & = α − (3)
= 1
y & (4)
In the NN learning process, in order to increase the
learning speed and maintain the stability the “learning
rate factor”(LRF) increases 1 % of the previous LRF
if the errors between network and goal outputs
decrease, but the LRF decreases 10% of the previous
LRF if the errors increase. Moreover the weight factor
was only updated in case of decrease of the errors. The
errors is defined as the following RMS(Root Mean Square).
( )
n T y error
RMS
n
i
n
∑
n=
−
=
12
(5)
Where T is target output, y is output value calculated by the NN, and n is the number of output layer neurons. In this work the target maximum RMS error was set at 0.01.
The NN was trained with 7 fault pattern cases. The changes of mass flow parameters and isentropic efficiencies which mean performance deteriorations of major components were properly assumed, and measurement parameters were obtained by a performance simulation program with these assumed changes. The well-known commercial performance simulation program ‘GASTURB’ was used for performance analysis
7). Component maps which were used for performance simulation were generated by the hybrid method that was combined with the system identification method and the genetic algorithms. This related work was fully explained at the previous paper
8)