JESK
http://dx.doi.org/10.5143/JESK.2016.35.5.371 http://jesk.or.kr eISSN:2093-8462Development of a Classification Model for Driver's Drowsiness and Waking Status Using Heart
Rate Variability and Respiratory Features
Sungho Kim1, Booyong Choi2, Taehwan Cho3, Yongkyun Lee2, Hyojin Koo2, Dongsoo Kim2
1R.O.K. Air Force Academy, Department of Systems Engineering, Chungcheongbuk-do, 28187
2R.O.K. Air Force Academy, Department of Basic Science, Chungcheongbuk-do, 28187
3R.O.K. Air Force Academy, Department of Electronics and Communications Engineering, Chungcheongbuk-do, 28187
Corresponding Author Dongsoo Kim
R.O.K. Air Force Academy, Department of Basic Science, Chungcheongbuk-do, 28187
Mobile : +82-10-9480-4808 Email : [email protected]
Received : June 29, 2016 Revised : August 29, 2016 Accepted : October 04, 2016
Copyright@2016 by Ergonomics Society of Korea. All right reserved.
○ccThis is an open-access article distributed under the terms of the Creative Commons Attribution Non-Commercial License (http://
creativecommons.org/licenses/by-nc/3.0/), which permits unrestricted non-commercial use, distribution, and reproduction in any medium, provided the original work is properly cited.
Objective:This study aims to evaluate the features of heart rate variability (HRV) and respiratory signals as indices for a driver's drowsiness and waking status in order to develop the classification model for a driver's drowsiness and waking status using those features.
Background: Driver's drowsiness is one of the major causal factors for traffic accidents.
This study hypothesized that the application of combined bio-signals to monitor the alertness level of drivers would improve the effectiveness of the classification techniques of driver's drowsiness.
Method: The features of three heart rate variability (HRV) measurements including low frequency (LF), high frequency (HF), and LF/HF ratio and two respiratory measurements including peak and rate were acquired by the monotonous car driving simulation experiments using the photoplethysmogram (PPG) and respiration sensors. The experiments were repeated a total of 50 times on five healthy male participants in their 20s to 50s. The classification model was developed by selecting the optimal measurements, applying a binary logistic regression method and performing 3-fold cross validation.
Results: The power of LF, HF, and LF/HF ratio, and the respiration peak of drowsiness status were reduced by 38%, 22%, 31%, and 7%, compared to those of waking status, while respiration rate was increased by 3%. The classification sensitivity of the model using both HRV and respiratory features (91.4%) was improved, compared to that of the model using only HRV feature (89.8%) and that using only respiratory feature (83.6%).
Conclusion: This study suggests that the classification of driver's drowsiness and waking status may be improved by utilizing a combination of HRV and respiratory features.
Application: The results of this study can be applied to the development of driver's drowsiness prevention systems.
Keywords: Driver's drowsiness, Photoplethysmogram (PPG), Respiration, Classification model, Heart rate variability (HRV)
1. Introduction
Driver's drowsiness is one of the major causes of fatal traffic accidents. According to
the Korea Expressway Corporation (2015), the accidents due to driver's drowsiness were 2,752 cases (20%) out of 13,873 traffic accidents that occurred during the last 5 years; such was quite a high ratio. Most of these accidents were due to driver's drowsiness, occurring from noon to 15:00, and the accumulation of fatigue and languor after a meal (Korea Transportation Safety Authority, 2015). Because the traffic fatality rate due to driver's drowsiness was more than two times higher than mean traffic accident fatality rate (Korea Road Traffic Authority, 2011), it is important to prevent driver's drowsiness and, therefore, technology development classifying driver's drowsiness and waking status is needed.
The technology classifying driver's drowsiness and waking status can be classified into driving status-based, behavior status-based, and bio signal-based classification technologies (Kang, 2013; Saini and Saini, 2014). First, driving status-based classification technology is the technology classifying driver's drowsiness and waking status through driver's lane deviation and steering wheel manipulation (Fairclough and Graham, 1999; Inger et al., 2006). The technology is non-invasive, but it has a weakness of low accuracy. Second, the behavior status-based classification technology serves to classify driver's drowsiness and waking status through data on drivers' eyelid growing heavy with sleep and their number of head movement (Bergasa et al., 2006; Murphy-Chutorian and Trivedi, 2010).
The technology is non-invasive and its use is easy; however, it has a weakness of being heavily affected by the surrounding environment. Lastly, the bio signal-based classification technology aims to classify the status of driver's drowsiness through driver's bio signals acquired by Electroencephalogram (EEG), Electrocardiogram (ECG), and Electromyogram (EMG) sensors (Liu and Zhang, 2010; Patel et al., 2011). Its accuracy is high, but it is invasive. Acquiring bio signals in a limited environment like the inside of a car is difficult, and these can be weaknesses. Bio signal-based classification technology can quantitatively analyze driver's status and has higher reliability, compared to other technologies (Sahayadhas et al., 2012). Therefore it is widely used in studies on classifying driver's drowsiness.
Existing bio signal-based classification technologies utilized various bio signals to effectively classify driver's drowsiness, but they were insufficient from the aspects of invasiveness and accuracy. For example, Fu et al. (2012) identified brain wave characteristics by attaching EEG sensors on the driver's head, and Miyaji (2014) analyzed heart rate variability (HRV) by attaching ECG sensors on the driver's chest. Existing studies classified driver's drowsiness by utilizing just specific bio signal measures such as brain wave and HRV (Lewicke et al., 2005; Shin et al., 2010; Sukanesh and Vijayprasath, 2013; Werteni et al., 2014). Therefore there is a need to minimize invasiveness by utilizing photoplethysmogram (PPG) and respiration sensors in order to effectively classify driver's drowsiness and waking status. Meanwhile, measurements on HRV and respiration are known to reflect the autonomic nervous system, indicating the changes in human stress, fatigue, and drowsiness (Vicente et al., 2011). Consequently, drowsiness and waking status can be more accurately classified by utilizing all these together.
This study aims to analyze the characteristics of HRV and respiratory measurements according to driver's status to effectively classify driver's drowsiness and develop a classification model for driver's drowsiness and waking status. The characteristics of three HRV measurements [low frequency (LF), high frequency (HF), and LF/HF ratio] and two respiratory measurements (peak and rate) according to driver's drowsiness and waking status were analyzed and grasped through a statistical analysis of the data acquired, with a task involving continuously gazing at a monotonous car driving simulation scene carried out to induce drowsiness, after PPG and respiration sensors were attached to the participants in the experiment. The model to classify driver's drowsiness and waking status was developed by selecting optimal HRV and respiratory measurements, significantly affecting driver's drowsiness and waking status, and by applying the binary logistic regression method.
2. Method
2.1 ParticipantsFive males in their mid-20s to mid-50s and without cardiovascular and respiratory diseases (38.0 ± 10.9 yrs) participated in this
http://jesk.or.kr study. The experiment of this study was carried out under the consent of the participants and the approval of the Institutional Review Board (IRB). For a smooth experiment, the participants with more than 1 year of driving experience were selected, and they were instructed to avoid activities, such as smoking and drinking on the previous day of the experiment, which may affect experiment's results. The experiment duration per participant was about 40 minutes, and the experiment was carried out 10 times for each participant, leading to 50 times of experimentation in total. An experiment participation commission was paid to the participants for motivation to participate in the test.
2.2 Apparatus
This study offered car driving simulation monitor to the participants and the participants' status and bio signal information monitor to the observer in real time using two 24-inch monitors (Samsung Electronics). The simulation driving monitor was controlled for monotonous driving in the two-lane expressway without other cars with 100km in speed and thus for driving straight.
The participant's status was recorded in real time through the camera embedded in the monitor, while the collected bio signal data were automatically stored in the computer for analysis later. Meanwhile, the participants' HRV and respiratory signals were measured using the PPG and respiration sensors of Procomp and BioGraph Infiniti (Thought Technology Ltd., USA) software. The PPG sensor serves to measure the blood flow wave form of peripheral blood vessels and has characteristics similar to those of the ECG sensor. Therefore it can indirectly calculate HRV and minimize invasiveness by attaching the sensor to a finger (Kim et al., 2010). This study attached the PPG sensor and respiratory sensor to a participant's chest and right hand index finger, as shown in Figure 1.
2.3 Experimental design
As shown in Figure 2, the experimental space consisted of bio signal measurement area and bio signal judgment area. In this way, the participant's drowsiness and waking status were identified. In the bio signal measurement area, a participant was instructed to sit comfortably on the seat 60cm away from the monitor and to conduct a task to continuously gaze at the car driving simulation scene. Meanwhile, in the bio signal judgment area, the observer observed the participants' status and bio signals as revealed on the monitor and recorded drowsiness and waking status. As for the standard of drowsiness status, a participant was classified to
be in the drowsy status if the participant blinks his eye for more than two seconds, three times per minute; this was in reference to the literature of Kim et al. (2014) and Heo et al. (2015). Concerning the experimental environment, temperature and humidity were controlled to maintain 20 to 25℃ and 40%, respectively, in order to minimize factors irrelevant to the experiment.
Driver's drowsiness and waking status were classified by applying three HRV measurements (LF, HF, and LF/HF ratio) and two respiratory measurements (peak and rate) used for existing studies. LF is low frequency in the 0.04 to 0.15Hz band among the HRV frequency area's spectrum factors, and HF is high frequency in the 0.15 to 0.4Hz band. They reflect the sympathetic nervous system and parasympathetic nervous system activities of the autonomic nervous system, respectively, (Kim and Min, 2015). LF/HF ratio is the ratio of LF/HF and it indicates the overall balance level of the autonomic nervous system (Moon et al., 2015). Meanwhile, the peak and rate of respiration mean the maximum value of respiration and time interval between the peaks of respiration, respectively (Park et al., 2014). Respiratory activity is known to be closely related with heartbeat activity (Kim and Min, 2015).
The experiment in this study was conducted with four steps: experiment preparation, sensor attachment, experiment, and questionnaire survey. In the experiment preparation step, the introduction of the experiment such as its purpose and procedure was made to the participants, whereas consent to participation in the experiment was acquired. In the sensor attachment step, the PPG and respiration sensors were attached to the participants, and 5-minute standby time was offered for bio signal stabilization.
In the experiment step, HRV and respiratory signal data in the drowsiness and waking status were collected for at least 5 minutes, respectively. Lastly, in the questionnaire survey, opinions on unusual things and the result of the experiment were surveyed.
2.4 Data analysis
The HRV and respiration signal data were processed through five steps: data extraction, data editing, data standardization, analysis section selection, and integration. In the data extraction step, initial stage data were collected with 256Hz sampling frequency for 10~15 minutes, while noise elimination, time, and frequency area conversion were automatically processed through the BioGraph Infiniti software program. In the data editing step, the data from the beginning to 90 seconds were excluded from the analysis in order to eliminate unstable data in the initial stage of the experiment. In the data standardization step, the data were standardized with the rate value that divided individual data by median data value by referring to the method presented in Tjolleng et al. (2015)
http://jesk.or.kr to offset the bio signal data size difference of each participant. In the data analysis section selection step, data were extracted by selecting the section judged to effectively reflect the characteristics of participants' drowsiness and waking status. For example, the data at 30 seconds in the initial stage within the waking section status were extracted for the bio signal data in the waking status.
Data at 30 seconds in the middle stage within the drowsiness section were extracted for the bio signal data in the drowsiness status. Lastly, in the data integration step, the data of 1,500 cases on drowsiness and waking status, respectively, acquired by ten times of repeated experiment among five participants were integrated into one in order to carry out a statistical analysis.
Regarding the bio signal data acquired through data processing, a statistical analysis was performed to identify whether there was a significant difference by driver's drowsiness and waking status. For the test of difference in HRV measurements (LF, HF, and LF/HF ratio) and respiratory measurements (peak and rate) according to driver's drowsiness and waking status, the paired t-test was applied at the significance level of 0.05 since the relevant measurement data followed normal distribution. The SPSS (ver.
21.0) was used for the statistical analysis.
2.5 Classification method
This study applied a three-step procedure, namely optimum variable selection, classification model development, and the validation and comparison of a classification model's performance to develop an effective model to classify drowsiness and waking status.
In the optimum variable selection step, a stepwise method (pin, pout=0.05) was applied to the variables with significant differences between drowsiness and waking.
In the classification model development step, the drowsiness and waking experimental data of the five participants were utilized as learning and test set for classification model development. Through the SPSS (ver. 21.0) program, this study developed a model to classify participants' status as drowsiness or waking by applying a binary logistic regression analysis method. The binary logistic regression analysis is an analysis method that can explain more than one independent variable and two categorical dependent variables. It is effectively utilized to analyze on which group the individually observed values can be classified into (Jun, 2012).
Concerning the rule of binary logistic regression analysis classification in this study, the ith object is classified into drowsiness if Pi > 0.5, and the ith object is classified into waking if Pi ≤ 0.5.
In the validation and comparison step of the classification model's performance, the developed model's performance was validated using sensitivity and specificity. Also, a comparison was made among a model to which HRV and respiration valuables were applied, a model to which only HRV variable was applied, and a model to which only respiratory variable was applied. The sensitivity and specificity values were calculated by using a 3-fold validation technique to solve an overfitting problem that can occur in a classification model developed by using the waking and drowsiness experimental data totally. The 3-fold cross validation is a technique utilizing 2/3 of the entire data as a learning set and 1/3 of the entire data as a test set by dividing the entire data into three parts. This is the method to utilize the mean value after calculating the classification model's performance for the three types of generated test sets, respectively, as the classification model's performance (Jun, 2012).
3. Results
3.1 Difference of driver's drowsiness and waking status
As a result of the experiment in this study as shown in Figure 3, all the values of HRV and respiratory measures by participants' drowsiness and waking status were analyzed to show significant differences at the significance level of 0.05. The LF (0.99 ± 0.26) in the drowsiness status was 38% (MD = -0.60) lower than the LF (1.59 ± 1.18) in the waking status [t(1499) = 21.43, p < .001].
The HF (1.04 ± 0.35) in the waking status was lower by 22% (MD = -0.29) than the HF (1.33 ± 1.30) in the waking status [t(1499)
= 9.95, p < .001]. The LF/HF ratio (0.98 ± 0.19) in the drowsiness status was 31% (MD = -0.44) lower than the LF/HF ratio (1.42
± 0.84) in the waking status [t(1499) = 20.44, p < .001]. The respiration rate (1.01 ± 0.30) in the drowsiness status was higher 3% (MD = 0.03) than the respiration rate (0.98 ± 0.63) in the waking status [t914990 = -23.06, p < .001]. The respiration peak (1.00 ± 0.49) in the drowsiness status was lower by 7% (MD = -0.08) than the respiration peak (1.08 ± 1.56) in the waking status [t(1499) = 22.23, p < .001].
3.2 Development of classification model for driver's drowsiness and waking status
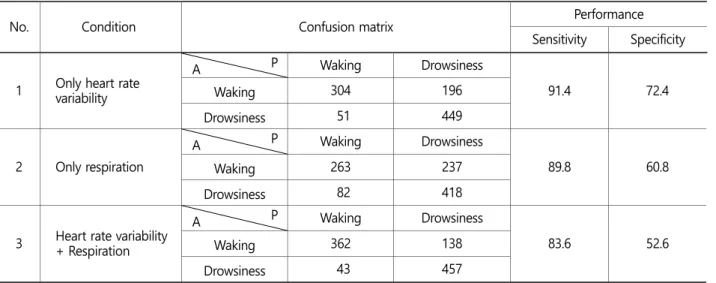
This study developed a model to which a binary logistic regression method was applied as shown in Figure 4 in order to effectively classify drowsiness and waking status. As a result of applying the stepwise method, the LF/HF ratio, respiration peak, respiration rate, and HF were selected as optimum variables for model development. The binary logistic regression model developed by using all the selected optimum variables was revealed to classify drowsiness with 91.4% sensitivity as shown in Table 1. Such was the result of validating the performance by carrying out the 3-fold cross validation technique. Meanwhile, according to the comparison result of the model to which only HRV was applied (first model), the model to which only respiration variable was applied (second model), and the model to which both HRV and respiration variables were applied (third model), the first model could classify
http://jesk.or.kr drowsiness with 89.8% sensitivity and the second model with 83.6% sensitivity; thus, they were slightly lower than the third model'sperformance (Table 1).
4. Discussion
This study used PPG and respiration sensors to effectively identify the characteristics by HRV and respiration measurements according to driver's drowsiness and waking status. Existing studies mainly used EEG and ECG sensors to measure drivers' physiological responses (Hong et al., 2014; Lee et al., 2010; Rogado et al., 2009), which may cause participants' repulsion on the sensor-attached location and the restrictions on participants' actions, due to sensor attachment. The PPG and respiration sensors are considered to be more easily embodied for actual use of a car system, compared to other bio signal sensors. For example, Ju et al. (2015) collected drivers' bio signals by embodying the HRV measuring sensor on the steering wheel, while the respiration measuring sensor is on the safety belt. The driver's drowsiness classification method using the PPG and respiration sensors in this study can help to minimize invasiveness in that they can be effectively applied to the indoor environment of a car.
As a result of HRV and respiration signal characteristics analysis, driver's drowsiness status was significantly lower than driver's waking status in LF, HF, LF/HF ratio, and respiration peak by 38%, 22%, 31%, and 7%, respectively, but it was significantly higher by 3%
in respiration rate. In a study of Parikh and Patel (2014), it was reported that LF decreased and HF increased as driver's status proceeded from waking to drowsiness. However, LF and HF all decreased in this study. The reason is that the trend of HRV signal was not partially reflected since the analysis section set up in this study was short by 30 seconds and HF showed a decreasing trend in the case of fast and shallow respiration (Kim and Min, 2015). As with the study result of Bonjyotsna and Roy (2014), LF/HF ratio decreased as driver's status proceeded from waking to drowsiness in this study. The reason seems to be HF reflecting the parasympathetic nervous system activities such as drowsiness and lethargy relatively decreasing more than LF reflecting the sympathetic nervous system activities including anxiety and tension. In the meantime, respiration peak decreased, and respiration rate increased as driver's status proceeded from waking to drowsiness, which was identified as the same as the study result of Park et al. (2014).
Table 1. Comparison of classification performance among various conditions
No. Condition Confusion matrix Performance
Sensitivity Specificity 1 Only heart rate
variability
A P Waking Drowsiness
91.4 72.4
Waking 304 196
Drowsiness 51 449
2 Only respiration
A P Waking Drowsiness
89.8 60.8
Waking 263 237
Drowsiness 82 418
3 Heart rate variability + Respiration
A P Waking Drowsiness
83.6 52.6
Waking 362 138
Drowsiness 43 457
Actual value was expressed as "A" and Predicted value as "P".
This study selected optimum HRV and respiration variables, applying the binary logistic regression method, and developed a model to classify driver's drowsiness and waking status. As a result of validating the performance by conducting a 3-fold cross validation technique, the binary logistic regression model developed by utilizing all the selected HRV and respiration variables classified driver's drowsiness status with 91.4% sensitivity. However, the model to which only HRV variable was applied had 89.8% sensitivity, and the model to which only respiration variable was applied had 83.6% sensitivity. Therefore, the complex utilization of bio signals was judged to more accurately identify driver's drowsiness and waking status, compared to the single utilization of a specific bio signal.
According to a study of Karlen et al. (2009), a model's performance can be further improved if the model's classification threshold was adjusted.
Indeed, a study conducting an experiment in the actual driving environment targeting many drivers in consideration of gender and age, and comprehensively applying the existing driver's drowsiness and waking status classification technology are needed in addition to this study. This study targeted five males in their mid-20s to mid-50s, all of whom had a driving experience of more than one year and on whom an experiment where the participants continuously gazed at the car driving simulation scene was carried out. To validate the utility of driver's drowsiness and waking status classification using the PPG and respiration sensors, an experiment targeting more drivers needs to be conducted in the actual driving environment. Although research to classify drowsiness and waking status based on bio signals was conducted in this study, comprehensive consideration on the driver's driving and behavior status-based technology are required, in addition to bio signals for accuracy improvement of drowsiness and waking status classification. If driving, behavior status, and bio signal-based technology are comprehensively considered, such a consideration can contribute to the development of a driver's drowsiness prevention system for an intelligent car in the future.
Acknowledgements
This study was carried out with the support for the Civil and Military Cooperation Research Support Project (12-DU-EB-01) of the Institute of Civil Military Technology Cooperation.
References
Bergasa, L.M., Nuevo, J., Sotelo, M.A., Barea, R. and Lopez, M.E., Real-time system for monitoring driver vigilance, IEEE Transactions on Intelligent Transportation Systems, 7(1), 63-77, 2006.
Bonjyotsna, A. and Roy, S., Correlation of drowsiness with electrocardiogram: A review, International Journal of Advanced Research in Electronical, Electronics and Instrumentation Engineering, 3(5), 9538-9544, 2014.
Fairclough, S.H. and Graham, R., Impairment of driving performance caused by sleep deprivation or alcohol: A comparative study, Journal of Human Factors and Ergonomics, 41, 118-128, 1999.
Fu, C.L., Li, W.K., Chun, H.C., Tung, P.S. and Chin, T.L., Generalized EEG-Based Drowsiness Prediction System by Using a Self- Organizing Neural Fuzzy System, IEEE Transactions on Circuits and Systems, 59(9), 2044-2055, 2012.
Heo, Y.S., Lee, J.C. and Kim, Y.N., Analysis and processing of driver's biological signal of workload, Journal of the Korea Society of Industrial Information Systems, 20(3), 87-93, 2015.
Hong, W.G., Lee, W.S., Jung, K.H., Lee, B.H., Park, J.W., Park, S.W., Park, Y.S., Son, J.W., Park, S.K. and You, H.C., Development of an evaluation method for a driver's cognitive workload using ECG signal, Journal of the Korean Institute of Industrial Engineers, 40(3), 325-332, 2014.
http://jesk.or.kr Inger, M., Åkerstedt, T., Peters, B., Anund, A. and Kecklund, G., Subjective sleepiness, simulated driving performance and blink duration: Examining individual differences, Journal of Sleep Research, 15, 47-53, 2006.
Ju, J.H., Park, Y.J. and Park, J.H., Lee, B.G., Lee, J.C. and Lee, J.Y., Real-time driver's biological signal monitoring system, Sensors and Materials, 27(1), 51-59, 2015.
Jun, C.H., Techniques and application of data mining, Hannarae, Korea, 2012.
Kang, H.B., Various approaches for driver and driving behavior monitoring: A review, In Proceedings of IEEE International Conference on Computer Vision Workshops, 616-623, 2013.
Karlen, W., Mattiussi, C. and Floreano, D., Sleep and wake classification with ECG and respiratory effort signals, IEEE Transactions on Circuits and Systems, 3(2), 71-78, 2009.
Kim, B.S. and Min, J.A., Application and interpretation of HRV in stress clinic, Panmun education, Korea, 2015.
Kim, C.J., Whang, M.C., Kim, J.H., Woo, J.C., Kim, Y.W. and Kim, J.H., A study on evaluation of human arousal level using PPG analysis, Journal of the Ergonomics Society of Korea, 29(1), 113-120, 2010.
Kim, M.S., Kim, Y.N. and Heo, Y.S., Characteristics of Heart Rate Variability Derived from ECG during the Driver's Wake and Sleep States, Transaction of the Korean Society of Automotive Engineers, 22(3), 136-142, 2014.
Korea Road Traffic Authority, Statistics of Drowsy Driving Accident, 2011.
Korea Transportation Safety Authority, Survey of Drowsy Driving, 2015.
Korean Expressway Corporation, Current State of Car Accident, 2015.
Lewicke, A.T., Sazonov, E.S., Corwin, M.J. and Schuckers, S.A.C., Reliable determination of sleep versus wake from heart rate variability using neural networks, In Proceedings of International Joint Conference on Neural Networks, 2394-2399, 2005.
Lee, W.S., Park, J.W., Kim, S.J., Yoon, S.H., Yang, X., Lee, Y.T., Son, J.W., Kim, M.H. and You, H.C., Development of an analysis system for biosignal and driving performance measurements, Journal of the Ergonomics Society of Korea, 29(1), 47-53, 2010.
Liu, J. and Zhang, C., EEG-based estimation of mental fatigue by using KPCA-HMM and complexity parameters, Biomedical Signal Processing and Control, 5(2), 124-130, 2010.
Miyaji, M., Method of drowsy state detection for driver monitoring function, International Journal of Information and Electronics Engineering, 4(4), 264-268, 2014.
Moon, K.S., Hwang, K.I., Choi, E.J. and Oah, S.Z., Study on prevention of drowsiness driving using electrocardiography (LF/HF) index, Journal of the Korean Society of Safety, 30(2), 56-62, 2015.
Murphy-Chutorian, E. and Trivedi, M.M., Head pose estimation and augmented reality tracking: An integrated system and evaluation for monitoring driver awareness, IEEE Transactions on Intelligent Transportation Systems, 11(2), 300-311, 2010.
Parikh, A. and Patel, H., Drowsy driving detection based on RR cycle of ECG, International Journal of Innovative and Emerging Research in Engineering, 1(1), 11-14, 2014.
Park, J.H., Kim, J.W. and Lee, J.C., Real Time Driver's Respiration Monitoring, Journal of Sensor Science and Technology, 23(2), 142-147, 2014.
Patel, M., Lal, S.K.L., Kavanagh, D. and Rossiter, P., Applying neural network analysis on heart rate variability data to assess driver fatigue, Expert Systems with Applications, 38(6), 7235-7242, 2011.
Rogado, E., Garcia, J.L., Barea, R. and Bergasa, L.M., Driver fatigue detection system, In Proceedings of IEEE International Conference on Robotics and Biomimetics, 1105-1110, 2009.
Sahayadhas, A., Sundaraj, K. and Murugappan, M., Detecting Driver Drowsiness Based on Sensors: A Review, Sensors, 12, 16937 -16953, 2012.
Saini, V. and Saini, R., Driver drowsiness detection system and techniques: A review, International Journal of Computer Science and Information Technologies, 5(3), 4245-4249, 2014.
Shin, H.S., Jung, S.J., Seo, Y.S. and Chung, W.Y., Real-time intelligent health and attention monitoring system for car driver, Journal of the Korea Institute of Information and Communication Engineering, 14(5), 1303-1310, 2010.
Sukanesh, R. and Vijayprasath, S., Certain investigations on drowsiness alert system based on heart rate variability using LabVIEW, WSEAS Transactions on Information Science and Applications, 10(11), 368-379, 2013.
Tjolleng, A., Jung, K.H., Hong, W.G., Lee, W.S., Lee, B.H., You, H.C., Son, J.W. and Park, S.K., Classification of Driver's Cognitive Workload Levels using Artificial Neural Network on ECG, In Proceedings of KIIE Conference, 1484-1506, 2015.
Vicente, J., Laguna, P., Bartra, A. and Bailon, R., Detection of Driver's Drowsiness by means of HRV analysis, Computing in Cardiology, 38, 89-92, 2011.
Werteni, H., Yacoub, S. and Ellouze, N., An automatic sleep-wake classifier using ECG signals, International Journal of Computer Science Issues, 11(4), 84-93, 2014.
Author listings
Sungho Kim: [email protected]
Highest degree: M.S., Department of Industrial and Management Engineering, POSTECH Position title: Assistant Professor, Department of Systems Engineering, R.O.K. Air Force Academy
Areas of interest: Human factors in aviation and aerospace, Human performance & workload assessment, User interface design &
evaluation, Usability testing, bio signal processing Booyong Choi: [email protected]
Highest degree: Ph.D., Department of mathematical sciences, KAIST
http://jesk.or.kr Position title: Professor, Department of Basic Science, R.O.K. Air Force Academy
Areas of interest: Differential geometry, bio signal processing
Taehwan Cho: [email protected]
Highest degree: Ph.D., Department of Electronics Engineering, Inha University
Position title: Assistant Professor, Department of Electronics and Communications Engineering, R.O.K. Air Force Academy Areas of interest: Human factors in aviation and aerospace, Avionics system, bio signal processing
Yongkyun Lee: [email protected]
Highest degree: M.S., Department of mathematics, Hanyang University
Position title: Assistant Professor, Department of Basic Science, R.O.K. Air Force Academy
Areas of interest: Computational statistics, Reliability analysis, Nonparametric statistics, Deep learning, bio signal processing
Hyojin Koo: [email protected]
Highest degree: M.S., Department of psychology, Chungbuk National University Position title: Researcher, Department of Basic Science, R.O.K. Air Force Academy Areas of interest: Human stress & fatigue assessment, Psychophysiology
Dongsoo Kim: [email protected]
Highest degree: Ph.D., Department of Environmental Health Sciences, SUNY at Albany Position title: Professor, Department of Basic Science, R.O.K. Air Force Academy Areas of interest: Human stress & fatigue assessment, Psychophysiology