RETRIEVAL OF AEROSOL MICROPHYSICAL PARAMETER BY INVERSION ALGORITHM USING
MULTI-WAVELENGTH RAMAN LIDAR DATA
Young Min Noh
Advanced Environmental Monitoring Research Center (ADEMRC) Gwangju Institute of Science and Technology (GIST) Department of Environmental Science & Engineering 1 Oryong-dong, Buk-gu, Gwangju 500-712, Republic of Korea Tel: +82-62-970-2478 Fax: +82-62-970-3404 E-mail: [email protected]
ABSTRACT : Vertical distribution and optical properties of atmospheric aerosols above the Korean peninsula are quite important to estimate effects of aerosol on atmospheric environment and regional radiative forcing. For the first time in Korea, vertical microphysical properties of atmospheric aerosol obtained by inversion algorithm were analyzed based on optical data of multi-wavelength Raman lidar system developed by the Advanced Environmental Monitoring Research Center (ADEMRC), Gwangju Institute Science and Technology (GIST). Data collected on 14 June 2004 at Gwangju (35.10oN, 126.53oE) and 27 May 2005 at Anmyeon island (36.32oN, 126.19oE) were used as raw optical data for inversion algorithm. Siberian forest fire smoke and local originated haze were observed above and within the height of PBL, respectively on 14 June 2004 according to NOAA/Hysplit backstrajectory analysis. The inversion of lidar optical data resulted in particle effective radii around 0.32 μm, single scattering albedo between 0.97 at 532 nm in PBL and effective radii of 0.27 μm and single scattering albedo of 0.92 above PBL. In the case on 27 May 2005, biomass burning from east China was a main source of aerosol plume. The inversion results of the data on 27 May 2005 were found to be particle effective radii between 0.24 μm, single scattering albedo around 0.91 at 532 nm. Additionally, the inversion values were well matched with those of Sun/sky radiometer in measurement period.
KEY WORDS: Lidar; Raman; Effective radius; Single-Scattering Albedo
1. INTRODUCTION
Emissions of atmospheric aerosols originating from anthropogenic pollution sources and biomass burning in China dominate in Northeast Asia region (Streets et al., 2003). Especially, due to combined effects of expansion of arid dust production regions, increasing regional population and increasing fossil fuel usage in China, this kind of aerosol burden may increase in the future (Luo et al., 2001). Also, forest fires in Russia are believed to be a major source of pollution in the Northern Hemisphere each year (Wotawa et al., 2001). Furthermore, these kinds of pollutants have affected global-scale atmospheric environment by a long-range transportation as a result of specific meteorological condition in Northeast Asia. Korea located in the downwind area in Northeast Asia is often affected by long range transported aerosols such as Asian dust, forest fires smoke, and anthropogenic aerosols under westerly wind conditions (Lee et al., 2006). Although a number of researches about transport characteristics and optical and chemical properties of Asian dust aerosol have been conducted (Murayama et al., 2004), most studies performed by point sampling data or in-situ measurement on the ground level. Also, the transport of urban haze aerosols and biomass burning in Northeast Asia has not been extensively studied.
In this paper, retrievals of optical and microphysical properties using multi-wavelength Raman lidar have been
performed to assess the effects of long-range transported haze plume and forest fire smoke observed on 14 June 2004 at Gwangju (35.10oN, 126.53oE) and 27 May 2005 at Anmyeon Island (36.32oN, 126.19oE), respectively.
The objectives of this paper are to investigate the physical and optical characteristics of aerosols in relation according to their transport patterns.
2. METHODOLOGY 2.1 Instrument
Nd:YAG Laser
PMT ( 1064 nm )
Lens
Collimate Lens 1064, 532 nm
BS BS
PBS
I.F I.F
I.F
I.F
I.F
I.F
ND
ND ND
ND PMT ( 532 nm )
PMT( 532 nm )
PMT ( 607 nm )
PMT ( 355 nm )
PMT ( 387 nm ) 1064 nm, 532 nm : P, S
532 nm, 607 nm 355 nm, 387 nm
PMT ( 532 nm ) 355 nm
I.F
computer Discrimi
-nator Photon -countor ADC
computer
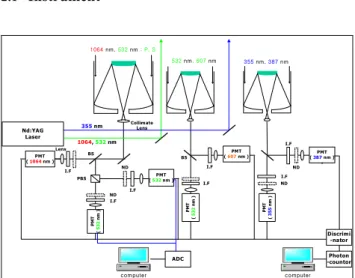
Figure 1. Schematic diagram of GIST Multi-wavelength Raman lidar system
The GIST/ADEMRC multi-wavelength Raman lidar system is shown in Figure 1. The light source is an Nd:YAG laser that emits pulses at 355-nm, 532-nm and 1064-nm wavelengths with a power of 60, 80 and 80 mJ, respectively. The pulse repetition rate is 20Hz. A λ/2 plate is used to control the light angle incident on the polarizer beam splitter of the receiver unit. The receiver unit of the lidar consists of one 14-inch and two 8-inch Cassegrain telescopes, and seven photomultiplier tubes (PMT) acting as detectors. The seven detectors are used to measure elastic backscattered signals at 355 nm, 532 nm and 1064 nm, horizontal (532S) and perpendicular (532P) polarization signals at 532 nm, and two inelastic atmospheric N2 Raman backscattered signals at 387 nm and 607 nm. The channels using a photon counter system were operating only during the night time, with data being stored in a computer. Temporal and spatial resolutions were 10 minutes and 7.5 m, respectively, for photon counter systems. 532P and 532S signals were used to determine the depolarization ratio, which is considered an indicator of the aerosol’s nonsphericity.
Divergent temporal and spatial resolutions were used in data acquisition of Raman signals since they are 103~104 times weaker than the elastic signals. The spatial resolution was reduced to 120 m for the Raman analysis by summing sixteen data points along the beam path. For the temporal resolution, summation of measured lidar data representing at least 216,000 laser shots (3 hours) was necessary to perform Raman data analysis. The Raman lidar signal was normally summed over a period ranging from 3 to 8 hours. Only cases involving consistent aerosol layers checked by a time plot of the extinction coefficient calculated by the Klett method over a 20-minute temporal resolution were included in the summation. Raman analysis was not performed if the consistent aerosol layer was detected for less than 3 hours or showed wide variation in height and optical depth. In the case of aerosol optical depth, variation of less than +/- 0.05 was included for the above process. The systematic error due to variations of optical depth during the data summation period was less than 5% by above process when optical depth was 0.3 at 532 nm
2.2 Data Analysis
The aerosol backscatter coefficient, extinction coefficient, and lidar ratio at 355 and 532 nm were determined from the elastic and inelastic return signals according to the method described by Ansmann et al., (1990) and Whiteman et al., (1992).
Radiosonde data collected about 5 km from the lidar site provided information on the vertical profiles of pressure, temperature and relative humidity, which allowed effects on the signals. The aerosol layers were classified using aerosol extinction coefficients and meteorological conditions such as ambient temperature and RH obtained by radiosonde. The aerosol optical depth (AOD,
τ
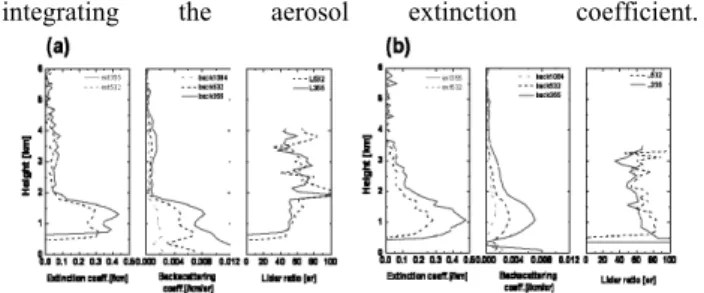
) at 355 nm and 532 nm of each classified accurate correction aerosol layer was calculated byintegrating the aerosol extinction coefficient.
Figure 2. Vertical profiles of the particle extinction coefficient at 355 and 532 nm, the particle backscattering coefficient at 355, 532, and 1064 nm, the lidar ratio at 355 and 532 nm on (a) 14 June 2004 and (b) 27 May 2005.
The Ångström exponent (ä) was calculated using acquired AOD values at 355-nm and of the Rayleigh scattering 532-nm wavelengths. Particle effective radius and complex refractive index were derived with an inversion algorithm (Muller et al., 1999a, 1999b, 2000).
Particle backscatter coefficients at the three laser wavelengths and particle extinction coefficients at 355 and 532 nm only above full overlap height are used as input information. The inversion code provides approximations of volume size distributions from which effective radius, volume and surface-area concentration, single-scattering albedo as well as complex refractive index are derived.
3. RESULTS
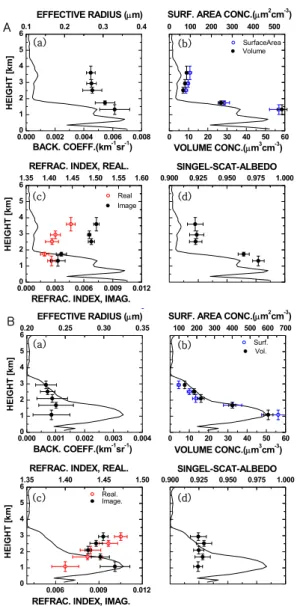
Two extinction coefficients at 355 and 532 nm, three backscatter coefficients at 355, 532 and 1064 nm and lidar ratios at 355 and 532 nm profiles observed on 14 June 2004 and 27 May 2005 are shown in Figure 2 (a) and (b), respectively. Extinction profiles didn’t retrieve below 800 m altitude because of overlap problem in extinction coefficient. Detected aerosol layer was separated as below planetary boundary layer (PBL) and above PBL for 14 June case. The lidar ratio showed similar value with altitude at 532 nm while the value was higher above PBL than within PBL at 355 nm as 67 ± 5 sr and 51 ± 3 sr, respectively. Angstrom exponents also showed lower within PBL than above PBL as 0.95 and 1.20, respectively. However, the optical differences according to height weren’t detected on 27 May case and the PBL didn’t clearly detected in that day. The optical data of the aerosol layers were averaged and subsequently used for the data inversion. Figure 3 and 4 shows inversion results. Table 1 summarized the inversion results for particle effective radius, complex refractive index and single-scattering albedo according to those altitudes. Effective radii show various values from 0.23 to 0.33 µm. And those values separated according to observation day and altitude. The relationship
Figure 3. Microphysical parameters observed on 14 June 2004 (A) and 27 May 2005 (B). (a) Particle effective radius. (b) Surface area concentration (open circle) and Volume concentration (close circle). (c) Refractive index real part (open circle) and Refractive index imaginary part (close circle). (d) Single-scattering albedo at 532 nm.
Vertical bars denote the height ranges across which the optical data were averaged for the data inversion. These bars thus also denote the height range for which the derived parameters hold. Horizontal bars denote statistical uncertainty.
between Angstrom exponent and effective radius was well matched and can be separated as three categories.
Siberian forest fire smoke and local originated haze were observed above and within the height of PBL, respectively on 14 June 2004 according to NOAA/Hysplit backstrajectory analysis while the air mass transported from East China on 27 May 2005 as shown in Figure 4 (a) and (b).
The imaginary part of the complex refractive index and
Figure 4. Five day backward trajectories for different arrival heights over the lidar site. (a)1000m (blue), 2500m (green), and 3500m (red) observed on 24:00 14 June 2004 at Gwangju. (b) 700m (blue), 1500m (green), and 3000m (red) observed on 24:00 27 May 2005 at Anmyeon island.
single-scattering albode showed different values among those categorized values. The mean imaginary part of the complex refractive index of aerosol observed within PBL was lower as 0.003 ± 0.001 than above PBL of 0.007 ± 0.001 on 14 June 2004. The highest imaginary part of the complex refractive index was detected on 27 May 2005 as 0.009 ± 0.001. The imaginary part of the complex refractive index describes the absorption of electro- magnetic radiation by the particles. Muller et al. (2006) found high imaginary part of the complex refractive index as 0.022 ± 0.015 and 0.019 ± 0.012 in the Pearl River Delta (South China) and in Beijing (North China), respectively. The forest fire smoke consisted of moderately absorbing material (Muller et al., 2005). This light absorbing characteristics was also detected in single-scattering albedo. Single-scattering albedo at 532 nm above PBL on 14 June 2004 was lower as 0.93 ± 0.01 than within PBL of 0.97 ± 0.01. The aerosol detected within PBL must be originated at local source. In contrast that aerosol measured above PBL was long-range transported forest fire smoke. Lowest SSA was detected on 27 May 2005 as 0.92 ± 0.01. Light absorbing pollutions observed in urban region of China by other authors are comparable or slightly low to our findings.
Single scattering albedo varied from 0.82 ~ 0.87 at 550 nm at Beijing between 1993 ~ 2001 (Qiu et al., 2004).
Eck et al. (2005) found similar value of 0.88 ± 0.01 at 550 nm in June 2003 at Beijing. Lee et al. (2006) found the value of 0.88 for a haze transported from large urban area in China region to Korean peninsula. Those values mean weak light absorbing characteristics. The single- scattering albedo of the Siberian forest fire plume observed with Raman lidar over Tokyo, Japan on 21 May 2003 (Murayama et al., 2004) showed similar values our results as 0.95 ± 0.06 and 0.93 ± 0.03, respectively. A high single-scattering albedo of around 0.97 at 670 nm was reported for aged biomass-burning plumes advected from Maxico to the United States (Kreidenwise et al., 2001). These column-averaged values were explained by water uptake of the particles during the transportation periods (Muller et al., 2005). Aircraft observations of smoke from the boreal fires that occurred in central
0 1 2 3 4 5 6
0.000 0.002 0.004 0.006 0.008
HEIGHT [km]
SINGEL-SCAT-ALBEDO REFRAC. INDEX, REAL.
REFRAC. INDEX, IMAG.
VOLUME CONC.(μm3cm-3) SURF. AREA CONC.(μm2cm-3)
BACK. COEFF.(km-1sr-1) EFFECTIVE RADIUS (μm)
HEIGHT [km]
0.1 0.2 0.3 0.4
SurfaceArea 0 100 200 300 400 500
0 10 20 30 40 50 60
Volume
Real 1.35 1.40 1.45 1.50 1.55 1.60
0 1 2 3 4 5 6
Image
0.000 0.003 0.006 0.009 0.012
0.900 0.925 0.950 0.975 1.000
(a)
(c) (d)
(b) A
0 1 2 3 4 5 6
0.000 0.001 0.002 0.003 0.004
HEIGHT [km]
SINGEL-SCAT-ALBEDO REFRAC. INDEX, REAL.
REFRAC. INDEX, IMAG.
VOLUME CONC.(μm3cm-3) SURF. AREA CONC.(μm2cm-3)
BACK. COEFF.(km-1sr-1) EFFECTIVE RADIUS (μm)
HEIGHT [km]
0.20 0.25 0.30 0.35
Surf.
100 200 300 400 500 600 700
0 10 20 30 40 50 60
Vol.
y
Real.
1.35 1.40 1.45 1.50
0 1 2 3 4 5 6
Image.
0.006 0.009 0.012
0.900 0.925 0.950 0.975 1.000
(a)
(c) (d)
(b) B
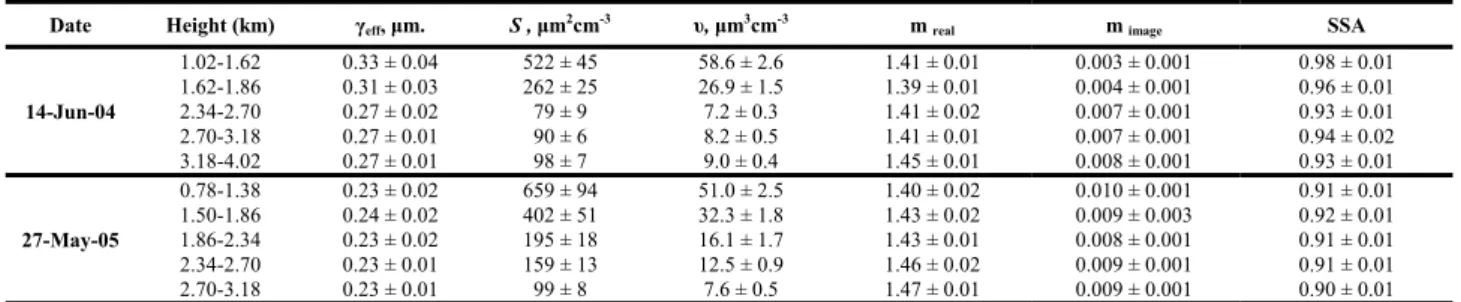
Table 1. Microphysical parameters calculated from inversion algorithm.
Date Height (km) γeff, μm. S , μm2cm-3 υ, μm3cm-3 m real m image SSA
14-Jun-04
1.02-1.62 0.33 ± 0.04 522 ± 45 58.6 ± 2.6 1.41 ± 0.01 0.003 ± 0.001 0.98 ± 0.01
1.62-1.86 0.31 ± 0.03 262 ± 25 26.9 ± 1.5 1.39 ± 0.01 0.004 ± 0.001 0.96 ± 0.01
2.34-2.70 0.27 ± 0.02 79 ± 9 7.2 ± 0.3 1.41 ± 0.02 0.007 ± 0.001 0.93 ± 0.01
2.70-3.18 0.27 ± 0.01 90 ± 6 8.2 ± 0.5 1.41 ± 0.01 0.007 ± 0.001 0.94 ± 0.02
3.18-4.02 0.27 ± 0.01 98 ± 7 9.0 ± 0.4 1.45 ± 0.01 0.008 ± 0.001 0.93 ± 0.01
27-May-05
0.78-1.38 0.23 ± 0.02 659 ± 94 51.0 ± 2.5 1.40 ± 0.02 0.010 ± 0.001 0.91 ± 0.01
1.50-1.86 0.24 ± 0.02 402 ± 51 32.3 ± 1.8 1.43 ± 0.02 0.009 ± 0.003 0.92 ± 0.01
1.86-2.34 0.23 ± 0.02 195 ± 18 16.1 ± 1.7 1.43 ± 0.01 0.008 ± 0.001 0.91 ± 0.01
2.34-2.70 0.23 ± 0.01 159 ± 13 12.5 ± 0.9 1.46 ± 0.02 0.009 ± 0.001 0.91 ± 0.01
2.70-3.18 0.23 ± 0.01 99 ± 8 7.6 ± 0.5 1.47 ± 0.01 0.009 ± 0.001 0.90 ± 0.01
The variable γeff denotes the effective radius, S denotes the surface-area concentration, υ denotes volume concentration, m real denotes complex refractive index real part, m image denotes complex refractive index imaginary part, and SSA denotes single scattering albedo values.
Quebec in summer 2002 showed single-scattering albedos of 0.93 ± 0.02 at 550 nm approximately 1000 km downwind of the source region (Colarco et al., 2004).
Single-scattering albedo observed on 27 May 2005 showed close or higher value to anthropogenic aerosol originated from China, while above PBL on 14 June 2004 was similar to forest fire smoke and/or biomass- burning aerosols in this study.
4. SUMMARY AND CONCLUSION
Vertical microphysical properties of atmospheric aerosol obtained by inversion algorithm were analyzed based on optical data of multi-wavelength Raman lidar system developed by the Advanced Environmental Monitoring Research Center (ADEMRC), Gwangju Institute Science and Technology (GIST). Data collected on 14 June 2004 at Gwangju (35.10oN, 126.53oE) and 27 May 2005 at Anmyeon island (36.32oN, 126.19oE) were used as raw optical data for inversion algorithm. Siberian forest fire smoke and local originated haze were observed above and within the height of PBL, respectively on 14 June 2004 according to NOAA/Hysplit backstrajectory analysis. The inversion of lidar optical data resulted in particle effective radii of 0.32 μm, single scattering albedo between 0.97 at 532 nm in PBL and effective radii of 0.27 μm and single scattering albedo of 0.93 above PBL. In the case on 27 May 2005, urban haze from east China was a main source of aerosol plume. The inversion results of the data on 27 May 2005 were found to be particle effective radii between 0.24 μm, single scattering albedo around 0.91 at 532 nm. Additionally, the inversion values were well matched with those of Sun/sky radiometer in measurement period. It can be concluded that optical and microphysical parameters retrieved from multi- wavelength Raman lidar can detect light absorbing characteristics as well as vertical distribution during long-range transportation. These results will be helpful for global climate change research.
ACKNOWLEDGEMENT
This work was supported by the Korea Meteorological Administration Research and Development Program
under Grant CATER 2007-4108. This research was partially supported by the Brain Korea 21(BK21) program for the fellowship Young M. Noh. The authors would like to thank GSFC/NASA for use of MODIS and AERONET sunphotometer data.
REFERENCES
Ansmann, A., et al., 1990. Measurement of atmospheric aerosol extinction profiles with a raman lidar. Optics Letters 15, 746–748.
Luo Y., et al., 2001. Characteristics of the spatial distribution and yearly variation of aerosol optical depth over China in last 30 years. J Geophys. Res., Vol. 106, 14,501 – 14,513.
Muller, D., et al., 2000a. Microphysical particle
parameters from extinction and backscatter lidar data by inversion with regularization: Experiment, Appl. Opt., 39, 1879–1892.
Muller, D., et al., 1999b. Microphysical particle parameters from extinction and backscatter lidar data by inversion with regularization: Simulation, Appl. Opt., 38, 2358–2368.
Muller, D., et al., 1999a. Microphysical particle parameters from extinction and backscatter lidar data by inversion with regularization: Theory, Appl. Opt., 38, 2346–2357.
Murayama, T., et al., 2004. Characterization of Asian dust and Siberian smoke with multi-wavelength Raman lidar over Tokyo, Japan in spring 2003. Geophysical Research Letter, 31, L23103.
Noh, Y. M., et al., 2007. Aerosol Lidar Ratio Characteristics Measured by a Multi-Wavelength Raman Lidar System at Anmyeon Island, Korea, Atmospheric Research, doi:10.1016/j.atmosres.2007.03.006
Wotawa, G., et al 2001. Inter-annual variability of summertime CO concentrations in the Northern Hemisphere explained by boreal forest fires in North America and Russia, Geophys. Res. Lett., 28, 4575–
4578.
Streets, D. G., et al., 2003. An inventory of gaseous and primary aerosol emissions in Asia in the year 2000, J.
Geophys. Res, VOL. 108, NO. D21, 8809, doi:10.1029/2002JD003093