http://dx.doi.org/10.6111/JKCGCT.2012.22.2.084
NO
2gas sensing based on graphene synthesized via chemical reduction process of exfoliated graphene oxide
Tran Van Khai, Maneeratanasarn Prachuporn and Kwang Bo Shim† Department of Materials Science and Engineering, Hanyang University, Seoul 133-791, Korea (Received February 24, 2012)
(Revised March 30, 2012) (Accepted April 13, 2012)
Abstract Single and few-layer graphene nanosheets (GNs) have successfully synthesized by a modified Hummer’s method followed by chemical reduction of exfoliated graphene oxide (GO) in the presence of hydrazine monohydrate. GO and GNs were characterized by X-ray photoelectron spectroscopy (XPS), Fourier transform infrared spectroscopy (FTIR), X-ray diffractions (XRD), Raman spectroscopy, Transmission electron microscopy (TEM), Atomic force microscopy (AFM), Optical microscopy (OM) and by electrical conductivity measurements. The result showed that electrical conductivity of GNs was significantly improved, from 4.2 × 10⁻⁴S/m for GO to 12 S/m for GNs, possibly due to the removal of oxygen- containing functional group during chemical reduction. In addition, the NO2 gas sensing characteristics of GNs are also discussed.
Key words Graphene, Graphene oxide, Gas sensing
1. Introduction
Graphene, a single layer of sp2-hybridized carbon atoms in a hexagonal two-dimensional lattice, has attracted tre- mendous attention due to its unique physical and chemi- cal properties and potential applications in many fields, including nanoelectronic, sensor for biomolecules, tran- sistors, solar cell and catalysts [1-5]. Up to now, there are major methods have been developed to synthesize graphene, including mechanical exfoliation, epitaxial growth, bottom-up synthesis and chemical reduction of GO suspension. The last method is considered to an efficient approach to produce graphene sheets in bulk quantity at relatively low cost.
Because carbon nanotubes (CNTs) are known to exhibit fast response and high sensitivity for detection of small concentrations of toxic gases at room tempera- ture, CNTs have attracted research interest due to their unique properties and potential applications [6-8]. Recent studies of graphene gas sensors have indicated that it can act as a good sensor [9-13]. Schedin and co-work- ers [14] have been investigated what gas molecules adsorbed on the surface of graphene can be used to fab- ricate sensitive gas sensors. Based on theoretical investi- gations on the adsorption of gas molecules on graphene,
it has been predicted that the doping in carbon nano- structures may improve the sensitivity [15-20]. Function- alized graphite nanostructures have been also detected pollutant gases such as NO2 [21]. Water vapor sensing characteristics of reduced graphene oxide (RGO) has been studied [22]. RGO is also shown to be good sen- sor for toxic vapors [23]. Spin-coated hydrazine func- tionalized graphene dispersions are able to detect NO2, NH3, and 2,4-dinitrotoluene [24]. However, there are no reports about NO2 gas sensor based on GNs prepared through chemical reduction of GO.
In this paper, we employed a simple method for prep- aration of single and few-layer GNs through the chemi- cal reduction of GO. We have studied the relation between structure and electrical conductivity of the GNs. More- over, we introduced a graphene gas sensor what the GNs-based chemical sensor was fabricated onto Pt elec- trode. It is considered to be important to examine gas sensing characteristics of single and few-layer GNs pre- pared by chemical reduction. We have studied sensing of NO2 by the above GNs sample.
2. Experiment
Materials: Graphite powder, H2SO4 (98 %), H3PO4 (98 %), KMnO4 (98 %) and H2O2 (30 wt%), Hydrazine monohydrate (98 %), N,N-Dimethylformamide (DMF, 99.8 %) were obtained from commercial resources and
†Corresponding author
†Tel: +82-2-2220-0501
†Fax: +82-2-2291-7395
†E-mail: [email protected]
water (450 ml) was slowly dropped into the resulting paste to dilute the mixture, and then the solution was stirred for 1 h while the temperature was raised to 90 ± 5oC. Finally, 800 ml of distilled water was added, fol- lowed by the slow addition of 60 ml H2O2 (30 %), turn- ing the colour of the solution from dark brown to yellow. During this final step, H2O2 (30 %) reduced the residual permanganate and manganese dioxide to colour- less soluble manganese sulphate. The GO deposit was collected from the GO suspension by high speed centrif- ugation at 15000 rpm for 30 min. The obtained GO was then washed with 1000 ml of HCl (5 %), and repeat- edly washed with distilled water until the pH = 7. To obtain uniform GO, a low-speed centrifugation at 3000 rpm was first used to remove thick multilayer sheets until all the visible particles were removed (3~5 min). Then the supernatant was further centrifuged at 10000 rpm for 30 min to remove small GO pieces and water-soluble by product. The final sediment was redispersed in 500 ml of DMF with mild sonication, resulting in a solution of exfoliated GO. The exfoliated GO nanosheets were chemi- cally reduced to GNs in the presence of hydrazine. Typi- cal, 500 ml of above exfoliated GO was stirred for 30 min, and 10 ml of hydrazine monohydrate was added.
The mixtures were heated at 90 ± 5oC using a water bath for 24 h; a black solid precipitated from the reac- tion mixtures. Products were collected by centrifugation at 12000 rpm for 45 min and washed with DI water and methanol until the pH = 7. Next, the GO and GNs were dried and stored in a vacuum oven at 90oC until use.
The GNs on the Pt electrode were prepared by using air-brush spraying technique. To examine the electrical conductivity, GO and GNs were sprayed on the glass substrates.
GO, GNs and as-synthesized films were characterized by a scanning electron microscope (SEM, JEOL, JSM 5900 LV, Japan). X-ray diffraction (XRD) characteriza- tion was performed using Cu Kα (wavelength at 1.54 Å) radiation, 40 kv, 30 mA, Rigaku, Japan. Atomic force microscope (AFM) image was obtained on an AFM
excitation laser wavelength of 532 nm, at a power den- sity of 2.9 mW · cm−2. X-ray photoelectron spectroscopy (XPS, VG Multilab ESCA 2000 system, UK) analysis using a monochromatized Al Kα x-ray source (hν = 1486.6 eV) was performed to analyze the elemental compositions and the assignments of the carbon peaks of the samples. The current-voltage (I-V) characteristic is examined by using four point probes with Keithley 2400 Source-meter. Preliminary current measurements in a gas sensors characterization system (GSCS) were per- formed exposing the device.
3. Results and Discuss
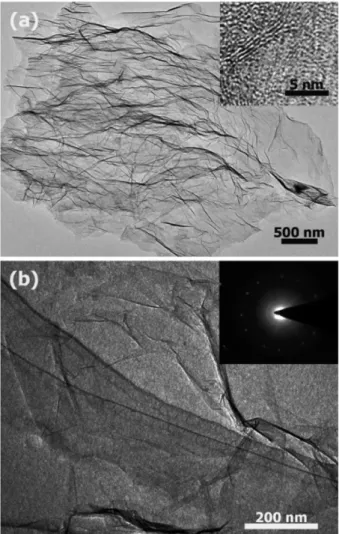
Figure 1(a & b) shows the typical TEM images GO and GNs, respectively. Most GO exist in the form of thin few-layer graphene with lateral size in range of 1~
3µm and some of them are folded at the edge of nanosheets, as shown in Fig. 1(a). The inset of Fig. 1(a) shows high-magnification TEM view of the curled bor- der showing the presence of 2~4 layers forming the graphene sheet. High-resolution TEM image of GNs in DMF solution confirms that this graphene sheet is made of bi-layers, as shown in Fig. 1(b). The crystallographic structure of the graphene sheet is determined using the selected area electron diffraction (SAED) technique, as shown in the inset of Fig. 1(b). The SAED yields a ring-shaped pattern consisting of many diffraction spots for each order of diffraction. These spots make regular hexagons with different rotational angles, indicating the presence of few layers in the graphene sheet assembly.
Furthermore, this result confirms that the typical six-fold symmetry of the pattern comes from the crystallographic structure of the graphene composed by carbon atoms arranged in a strictly two-dimensional honeycomb - in real space.
Figure 2(a) shows the AFM image of graphene oxide nanosheets and the height profile in selected location.
The height of GO is in the range of from 0.8 to 1.5 nm.
In theory, the single-layer graphene sheet is atomically flat with a well-known van der Waals thickness of 0.34 nm, while graphene oxide sheets are expected to be
‘thicker’ due to the presence of covalently bound oxy- gen and the displacement of the sp3-hybridized carbon atoms slightly above and below the original graphene plane. In fact, some studies [26] pointed out that the heights of ‘dry’ and hydrated GO were about 0.65~0.75 nm and 1.2 nm, respectively. Therefore, in this paper, the GO nanosheets may be composed of bi or few lay- ers of graphene oxide sheets, consistent with the TEM result. Figure 2(b) shows the typical OM image of graphene oxide nanosheet with the size in range of 1.5~
2µm.
The structural changes of GO is studied by using X- ray diffraction. Figure 3(a-c) shows the patterns of raw graphite, GO and GNs, respectively. The raw graphite showed the very strong (002) peak at 26.40o, corre- sponding to interlayer distance (d-spacing) of about 3.36 Å. However, after oxidation, the (002) peak shifted to a lower angle of around 11.11o and the d-spacing of GO increased to 7.95 Å. Such d-spacing is significantly large than that of single-layer graphene (~3.40 Å), indi- cating that GO contains large numbers of oxygen-con- taining functional groups on both sides of the graphene sheets. In addition, the small bump near 18o indicates that the GO is not completely oxidized. The peak disap- peared in a region of low angle and another broad peak at 25.47o corresponding to d-spacing of 3.49 Å appeared after the GO was reduced by hydrazine monohydrate.
This indicates that the removal of large number of func- tional groups and the formation of much more distorted graphene sheets.
Figure 4 show the FT-IR spectra of GO and GNs. The FT-IR spectrum of GO exhibits a strong and broad band at 3400 cm−1, which is due to the O-H stretching vibra- tion. The band at 1715 cm−1 is related to the C=O stretch- ing motions of COOH groups at the edges of the sheets [27]. The band at 1627 cm−1 can be due to the O-H Fig. 1. TEM image of (b) GO and (b) GNs, the inset is the
resultant SAED pattern.
Fig. 2. (a) A tapping mode AFM image of GO nanosheets and the height profile in selected location, (b) OM image of GO.
Fig. 3. XRD patterns of raw graphite powder, GO, GNs.
bending vibration of absorbed water. The band at 1580 cm−1 contained a peak corresponding to aromatic C=C bonds and is assigned to skeletal vibrations from un-oxi- dized graphitic domains [27]. The peaks at 1397 and 1071 cm−1 may be attributed to the variations of tertiary C-OH groups and C-O, respectively [28]. In the FT-IR spectrum of the GNs, the peaks at 1715, 1397 and 1054 cm−1 disappeared, and broad peak at 3410 cm−1 was markedly reduced, indicating the removal of the hydroxyl and carboxylic acid groups. The intensity of peak at 1633 cm−1 (O-H) was significantly decreased but still detectable. It did not completely disappear because of the mild reaction conditions. In the meanwhile, the shift of the peak for aromatic C=C from 1580 cm−1 in GO to 1557 cm−1 in GNs appears, indicating more defects were added during chemical reduction might modify the sp2 carbon network.
Raman spectroscopy is usually used to characterize carbon materials. Figure 5(a-c) show Raman spectra of graphite, GO, GNs, respectively. It clearly indicates that the graphite powder has the best crystal quality. Graph-
the D band became narrower and more prominent whilst the G band shifted from 1597 cm−1 to 1595 cm−1, possi- bly due to increase of the number of sp2 carbon in the graphene sheets. The intensity ratio of D band to G band (ID/IG) is usually used to measure the graphitiza- tion degree of carbon materials. The calculated ID/IG ratios of graphite, GO, GNs samples is 0.10, 0.85 and 1.10. It is easily seen that the ID/IG ratio of GO is much higher than that of graphite, indicating that GO has a higher distortion. After chemical reduction, the ID/IG ratio of GNs continuously increased, suggesting that the graphene lattice became again with defects which caused the increase of ID/IG ratio [30].
An important factor determining the quality of graphene is the degree of oxidation and the presence of other het- ero-atoms, which affects the electrical and electronic properties of the material. X-ray photoelectron spectros- copy (XPS) is a powerful tool to identify the elemental composition in bulk materials. Furthermore, by analysis of binding energy (BE) values, we can detect the pres- ence of any oxygenated groups. Figure 6(a-c) shows the XPS survey spectra of commercial graphite, GO, GNs, respectively. Only carbon, oxygen and nitrogen species are detected, the atomic percentage (at %) of each ele- ment was calculated from the survey spectra, and the result was summarized in Table 1. In the survey scan XPS spectra, the peaks at around 285.5, 399.8 and 534.0 eV correspond to C1s, N1s and O1s core-level, respectively. The effective chemical reduction is clear because the content of oxygen atoms of GNs signifi- cantly reduces compared with GO. The oxygen content decreased in the order of GO > GNs > graphite.
High resolution XPS of the as-made samples were
Table 1
Atomic concentration of C, N, and O of Graphite, GO and GNs
Sample C (%) N (%) O (%)
Graphite 95.31 -- 4.69
GO-dried 68.80 -- 31.20
GNs 75.40 4.30 20.30
Fig. 4. FT-IR spectra of dried (a) GO, (b) GNs.
Fig. 5. Raman spectra of raw graphite material, dried GO, GNs.
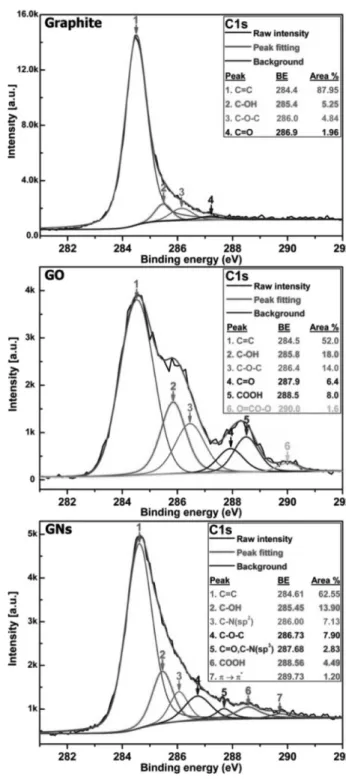
further performed to analyze the change of individual groups during the reduction process; the relative compo- sition of individual groups was estimated by the per- centage of the certain group (the area of peak divided by the total area of all peaks). Figure 7 shows the high resolution C1s XPS spectra of graphite, GO and GNs.
For the graphite material, the C1s peak can be fitted to four components located at 284.4, 285.4, 286.1 and 287.3 eV. The main peak at 284.4 eV corresponds to binding energy of sp2 graphitic bonds (C=C), indicating that most of the carbon atoms in the graphite are arranged in a conjugated honeycomb lattice (87.95 % area of C=C bonds). The other three peaks located at 285.4, 286.0 and 286.9 eV are attributed to C-OH (hydroxyls) C-O-C (epoxy/ether) and C=O (carbonyls) groups, respec- tively. The C1s XPS spectrum of GO clearly indicates a considerable degree of oxidation with the content of oxygen element increased to 31.2 at.% while the area composition of C=C bonds decreased to 52.0 %, which results from harsh oxidation and destruction of the sp2 atomic structure graphite [31, 32]. There are six differ- ent kinds of carbon atoms, located at 284.5, 285.8, 286.4, 287.9, 288.5 and 290.0 eV, correspondingly exist in different functional groups: C=C, C-OH, C-O-C, C=O, COOH (acids) and O=CO-O (carbonates) groups, respec- tively. This indicates that the rich groups are contained within the GO.
After chemical reduction of GO, the relative contribu- tion of the components associated with oxygen was found to decrease very significant, this is in agreement with previous reports from the literature [33, 34]. It is worth noting that the content of oxygen element decreased to 21.31 at.% while the area composition of C=C bonds increased to 62.55 % in comparison to GO, indicating a significant recovery of sp2 carbon network. In this case, the C1s peak can fitted to seven components located at 284.6, 285.4, 286.0, 286.7, 287.7, 288.6, and 289.7 eV.
The peaks located at 284.6, 285.4, 286.7, 287.7 and 288.6 eV correspond to energy of C=C, C-OH, C-O-C, C=O/C-N and COOH groups, respectively. Concurrently, two new peaks at 286.0 and 287.7 eV can be ascribed to two different C-N bonds, corresponding to the N-sp2C and N-sp3C bonds, respectively, originating from the substitution of the N atoms, defects or the edge of the graphene sheets [35, 36]. GO contained a large numbers of functional groups and defect sites. During the chemi- Fig. 7. High resolution C1 XPS spectra of graphite, GO and
GNs.
Fig. 6. (a-c) Raw scan XPS spectra of graphite, GO and GNs respectively.
cal reduction, oxygen functional groups in the as-made GO were responsible for reactions with hydrazine mono- hydrate (NH4H2O) to form C-N bonds. Additionally, it is remarkable that the π → π* shakeup satellite peak around 289.73 eV, a characteristic of aromatic or conjugated systems, appeared after hydrazine reduction.
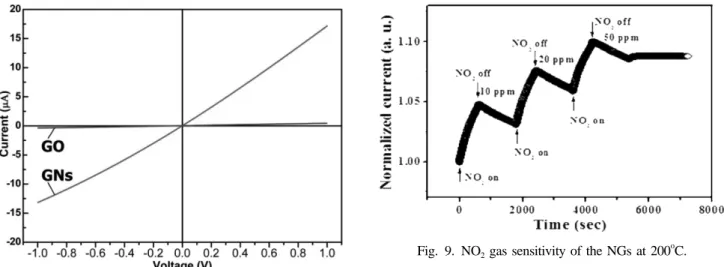
To study the effect of chemical reduction on the elec- trical conductivity of as-made samples, we investigated the current-voltage (I-V) characteristic using four point probe with Keithley 2400 Source-meter. Figure 8 shows the I-V characteristic of GO, GNs. Note that both the samples have the same thickness. It is found that both samples exhibit linear I-V relation with the voltage in range of −1.0 to +1.0 V. The I-V slope of GO is close to zero. Before reduction, the GO behaved close-to-insulat- ing material [37], which can be attributed to the high oxygen content in the form of functional groups con- tained by GO. It is widely known that the GO structure is predominantly amorphous due to distortions from high fraction of sp3-O. Moreover, due to the random distribu- tion, the sp2-hybridized benzene rings are separated by sp3-hybridized rings, thus leading to the insulating GO [38]. However, the I-V slope of GNs significantly increased after chemical reduction, indicating that the electrical conductivity of GNs was considerably enhanced. The enhanced electrical conductivity of GNs can be due to chemical removal of oxygen functional groups during chemical reduction. From the linear I-V curves the con- ductivity of 4.2 × 10⁻⁴ and 12 S/m was calculated for GO and GNs, respectively.
One of the most important issues of gas detector is reproducibility. Therefore, the GNs-based gas detector developed in this research was exposed to a repeated cycling of the ambient gas with different nitrogen diox-
ide (NO2) concentrations. Figure 9 shows the normal- ized change of current in the GNs as function of time for different concentration of NO2 ranging from 10 ppm increase to 50 ppm. NO2 appears to act as a p-typed dopant [39] for the GNs resulting in a decrease in the resistance. The current of GNs device increases from
~1.05 for 10 ppm to 1.1 for 50 ppm of NO2. The simi- lar result is found in the previous studies [40, 41]. Based on this result, it can be concluded that the GNs have great potential for ultra-sensitive gas detector by the optimization of device structure. The detection of a sin- gle gas molecule can be achieved by using GNs-based gas detector since the change in the electrical conductiv- ity of the graphene is quantized in response to NO2 mol- ecule [14]. Moreover, the sensitivity can be further enhanced by adding noble metals [42].
4. Conclusions
Singe and few-layer GNs have successfully synthe- sized by a modified Hummer’s method followed by chemical reduction of GO in the presence of hydrazine monohydrate. This technique is simple, low cost and adaptable for the production of large quantities of sen- sor materials. By using XPS, Raman, XRD, AFM, and FTIR technique, it is found that the structure of GO was greatly changed before and after chemical reduction. As a result, the electrical conductivity of GNs is signifi- cantly improved compared to that of GO. Moreover, it is shown that these GNs can be used to detect NO2 gas.
References
[ 1 ] Y. Zhu, S. Murali, W. Cai, X. Li, J.W. Suk, J.R. Potts Fig. 8. Current-voltage characteristics of GO and GNs.
Fig. 9. NO2 gas sensitivity of the NGs at 200oC.
and R.S. Ruoff, “Graphene and graphene oxide: Synthe- sis, properties, and applications”, Adv. Mater. 22 (2010) 3906.
[ 2 ] (a) C.N.R. Rao, A.K. Sood, K.S. Subrahmanyam and A.
Govindaraj, “Graphene: The new-two-demensional nanometerial”, Angew. Chem. Int. Ed. 48 (2009) 7752;
(b) S. Capone, A. Forleo, L. Francioso, R. Rella, P.
Siciliano, J. Spadavecchia, D.S. Presicceand and A.M.
Taurino, “Solid-state gas sensors: state of the art and future activities”, J. Optoelectron. Adv. Mater. 5 (2003) 1335.
[ 3 ] K.S. Novoselov, A.K. Geim, S.V. Morozov, D. Jiang, Y.
Zhang, S.V. Dubonos, I.V. Grigorieva and A.A. Firsov,
“Electric field effect in atomically thin carbon films”, Science 306 (2004) 666.
[ 4 ] K.H. Choi, I.J. Yoo, H.S. Lee, K.H. Lee and D.C. Lim,
“Fabrication of various carbon nanostructures by using different catalysts”, J. Korean Crystal Growth and Crys- tal Technology 20 (2010) 133.
[ 5 ] J.H. Kim, J.H. Hwang, T.Y. Lim and S.H. Kim, “Fabri- cation of functional nanoparticles by layer-by-layer self- assembly method”, J. Korean Crystal Growth and Crys- tal Technology 19 (2009) 305.
[ 6 ] R.H. Baughman, A.A. Zakhidov and W.A. de Heer,
“Carbon nanotubes; The route toward applications”, Sci- ence 297 (2002) 787.
[ 7 ] M. Ferrari, “Cancer nanotechnology: Opportunities and challenges”, Nat. Rev. Cancer 5 (2005) 161.
[ 8 ] (a) D.R. Kauffman and A. Star, “Carbon nanotube gas and vapor sensors”, Angew. Chem., Int. Ed. 47 (2008) 6550; (b) “Special issue on gas-sensing materials”, MRS Bull. 24 (1999).
[ 8 ] K.S. Novoselov, A.K. Geim, S.V. Morozov, D. Jiang, M.I. Katsnelson, I.V. Grigorieva, S.V. Dubonos and A.A. Firsov, “Two-dimensional gas of massless Dirac fermions in graphene”, Nature 438 (2005) 197.
[10] C. Berger, Z.M. Song, X.B. Li, X.S. Wu, N. Brown, C.
Naud, D. Mayo, T.B. Li, J. Hass, A.N. Marchenkov, E.H. Conrad, P.N. First and W.A. de Heer, “Electronic confinement and coherence in patterned epitaxial graphene”, Science 312 (2006) 1191.
[11] Y. Shao, J. Wang, H. Wu, J. Liu, I.A. Aksay and Y. Lin,
“Based electrochemical sensors and biosensors: A review”, Electroanalysis 22 (2010) 1027.
[12] Y.B. Zhang, J.P. Small, M.E.S. Amori and P. Kim,
“Electric field modulation of galvanomagnetic proper- ties of mesoscopic graphite”, Phys. Rev. Lett. 94 (2005) 176803.
[13] M.C. Lemme, T.J. Echtermeyer, M. Baus and H. Kurz,
“A graphene field-effect device”, IEEE Electron Device Lett. 28 (2007) 282.
[14] F. Schedin, A.K. Geim, S.V. Morozov, E.W. Hill, P.
Blake, M.I. Katsnelson and K.S. Novoselov, “Detection of individual gas molecules adsorbed on graphene”, Nat.
Mater. 6 (2007) 652.
[15] R.S. Sundaram, C.G. Navarro, K. Balasubramanian, M.
Burghard and K. Kern, “Electrochemical modification of graphene”, Adv. Mater. 20 (2008) 3050.
[16] P.K. Ang, W. Chen, A.T.S. Wee and K.P. Loh, “Solu- tion-gated epitaxial graphene as pH sensor”, J. Am.
Chem. Soc. 130 (2008) 14392.
[17] O. Leenaerts, B. Partoens and F.M. Peeters, “Adsorp- tion of H2O, NH3, CO, NO2, and NO on graphene: A first-principles study”, Phy. Rev. B 77 (2008) 125416.
[18] B. Huang, Z. Li, Z. Liu, G. Zhou, S. Hao, J. Wu, B.L.
Gu and W. Duan, “Adsorption of gas molecules on graphene nanoribbons and its implication for nanoscale molecule sensor”, J. Phys. Chem. C 112 (2008) 13442.
[19] S. Peng and K. Cho, “Ab initio study of doped carbon nanotube sensors”, Nano Lett. 3 (2003) 513.
[20] C.S. Yeung, L.V. Liu and Y.A. Wang, “Adsorption of small gas molecules onto pt-doped single-walled car- bon nanotubes”, J. Phys. Chem. C 112 (2008) 7401.
[21] M. Qazi, T. Vogt and G. Koley, “Trace gas detection using nanostructured graphite layers”, Appl. Phy. Lett.
91 (2007) 233101.
[22] I. Jung, D. Dikin, S. Park, W. Cai, S.L. Mielke and R.S.
Ruoff, “Effect of water vapor on electrical properties of individual reduced graphene oxide sheets”, J. Phys.
Chem. C 112 (2008) 20264.
[23] J.T. Robinson, F.K. Perkins, E.S. Snow, Z. Wei and P.E.
Sheehan, “Reduced graphene oxide molecular sensors”, Nano Lett. 8 (2008) 3137.
[24] J.D. Fowler, M.J. Allen, V.C. Tung, Y. Yang, R.B.
Kaner and B.H. Weiller, “Practical chemical sensors from chemically derived graphene”, ACS Nano 3 (2009) 301.
[25] W.S. Hummers and R.E. Offerman, “Preparation of gra- phitic oxide, J. Am. Chem. Soc. 80(6) (1958) 1339.
[26] S. Stankovich, D.A. Dikin, R.D. Piner, K.A Kohlhaas, A. Kleinhammes, Y. Jia, Y. Wu, S.B.T. Nguyen and R.S. Ruoff, “Synsthesis of graphene-based nanosheets via chemical reduction of exfoliated”, Carbon 45 (2007) 1558.
[27] C. Hontorialucas, A.J. Lopezpeinado, J.D.D. Lopezgonza- lez, M.L. Rojascervantes and R.M. Martinaranda, “Study of oxygen-containing groups in a series of graphite oxides: Physical and chemical characterization”, Car- bon 33 (1995) 1585.
[28] C. Nethravathi and M. Rajamathi, “Chemically modi- fied graphene sheets produced by the solvothermal reduction of colloidal dispersions of graphite oxide”, Carbon 46 (2008) 1994.
[29] A.C. Ferrari, J.C. Meyer, V. Scardaci, C. Casiraghi, M.
Lazzeri, F. Mauri, S. Piscanec, D. Jiang, K.S. Novoselov and S. Roth, “Raman spectrum of graphene and graphene layers”, Phys. Rev. Lett. 97 (2006) 187401.
[30] J.I. Paredes, S. Villar-Rodil, P. Solis-Ferander, A. Mar- tinez-Alonso and J.M.D. Tascon, “Atomic force and scanning tunneling microscopy imaging of graphene nanosheets derived from graphite oxide”, Langmuir 30(10) (2009) 5957.
[31] B.J. Jiang, C.G. Tian, L. Wang, Y.X. Xu, R.H. Wang, Y.J. Qiao, Y.G. Ma and H.G. Fu, “Facile fabrication of high quality graphene from expandable graphite: simul- taneous exfoliation and reduction”, Chem. Commun. 46 (2010) 4920.
[32] M. Chouciar, P. Thordarson and J.A. Stride, “Gram- scale production of graphene based on solvothermal synthesis and sonication”, Nat. Nanotechnol. 4 (2009) 30.
[33] G. Eda, G. Fanchini and M. Chhowalla, “Large-area
vertical growth of wall-number-selected, N-doped car- bon nanotube arrays”, Nano Lett. 9 (2009) 1427.
[37] C. Gómez-Navarro, R.T. Weitz, A.M. Bittner, M. Sco- lari, A. Mews, M. Burghard and K. Kern, “Electronic transport properties of individual chemically reduced graphene oxide sheets”, Nano Lett. 11 (2007) 3499.
[38] P.G. Ren, D.X. Yan, X. Ji, T. Chen and Z.M. Li, “Tem-
work”, Scientific Reports doi:10.1038/srep00166.
[42] M. Penza, G. Gassano, R. Rossi, M. Alvisi, A. Rizzo, M.A. Signore, Th. Dikonimos, E. Serra and R. Giorgi,
“Enhancement of sensitivity in gas chemiresistors based on carbon nanotube surface functionalized with noble metal (Au, Pt) nanoclusters”, Appl. Phys. Lett. 90 (2007) 173123.