Ⅰ. Introduction
Nowadays, people are highly interested in taking care of their physical and mental health in daily life[1, 2]. Most of all, it became very important to take closely care of negative mental states such as depression and anxiety in modern societies. Usually the negative mental states are caused by stressful situations during everyday activities including work.
In this paper, we combine different sensing methods and equipments to measure levels of the human mental stress accurately. When a person is stressed, there is a significant physiological change in the human body, such as fast heart beat rate, rapid
breathing, and decreased skin resistance[3]. Therefore, we measure the human stress using the data obtained from galvanic sensors, pulse sensors, and respiration sensors. Those sensors are easy to use with the help of Arduino micro-controllers. The sensor data is sent to an Android application via wireless communication and analyzed on it. The application also has functionalities to relieve the stress. If the measurement of the stress is high, the application gives a help relieve stress by playing musics and videos, reading books and stories, and teaching physical exercises such as yoga. The Android-based and Arduino-based device is small, lightweight, and easy to carry, it is always possible to check our stress condition without any help of doctor.
생체 신호 측정을 통한 스트레스 모니터링
울지바야르
1, 문광석
1, 박한훈
1*1
부경대학교 전자공학과
Human Stress Monitoring through Measurement of Physiological Signals
Ulziibayar Natsagdorj
1, Kwang-Seok Moon
1, Hanhoon Park
1*1
Department of Electronic Engineering, Pukyong National University
Abstract As the human population increases in the world, the ratio of health doctors is rapidly decreasing. Therefore, it is an urgent need to create new technologies to monitor the physical and mental health of people during their daily life. In particular, negative mental states like depression and anxiety are big problems in modern societies. Usually this happens due to stressful situations during everyday activities including work. This paper presents a machine learning approach to reliably estimating the level of human mental stress using wearable physiological sensors. And also, this paper presents an Android- and Arduino-based stress monitoring and relief system.
• Key Words : Arduino based stress detection, physiological sensors, human mental stress estimation, stress level analysis, stress monitoring application, stress relief application
Received 26 February 2019, Revised 26 March 2019, Accepted 30 March 2019
* Corresponding Author Hanhoon Park, Department of Electronic Engineering, Pukyong National University, 45, Yongso-ro, Nam-gu, Busan, Korea. E-mail: [email protected]
In this paper, we extend our previous work[4] by presenting a machine learning approach to reliably estimating the level of human mental stress only using physiological signals.
Ⅱ. Implementation
When people got stressed, they show several biological signs in their body, such as hair loss, forgetfulness, stomachache, chill, muscle lump, and having weird dream[5]. Although these changes are not easy to measure, but some accompanying physiological changes can be measured using wearable sensors. Those are heart rate, respiration rate, skin resistances changes. So, we use a heart-rate sensor, a breathing sensor, and a galvanic skin resistance (GSR) sensor to detect those changes. The details for the sensors will be explained in the subsequent subsections. In general, the human stress can be estimated to some extent by only monitoring heart rates, but using respiration rates and skin resistances in addition can give a more accurate and reliable result.
We formularize the relationship between the physiological measurements and the stress levels as follows.
(1)Here,
,
,
, and
denote stress level, heart rate, respiration rate, and skin resistance, respectively. The ground-truth stress levels are obtained from survey results using a stress indicator questionnaire. Thus, the function
can be estimated by regression.2.1 Pulse sensor for heart-rate measurement
Pulse sensor is a well-designed plug-and-play heart-rate sensor for Arduino micro-controllers. It can be used by students, artists, athletes, makers, and game and mobile developers who want to easily incorporate live heart-rate data into their projects[6].The heart-rate sensor measures heart rates in beats
per minute using an optical LED light source and an LED light sensor. It works in such a way that, when the light is illuminated on the skin, the sensor measures the amount of light that reflects from or passes through the skin[7] (see Fig. 1 ).
Fig. 1. Heart-rate measurement technology
2.2 Thermistor for breath measurement
Thermistors are temperature sensors, whose electrical resistance changes exponentially with change in temperature, which senses the temperature of inhaled and exhaled air (see Fig. 2), giving a temperature difference which is further calibrated in to give rate. They are available in bead type, probe type, disc type, and rod type. It can be used in air temperature from -60°C to 150°C. A typical respiration rate for a healthy adult at rest is 12–20 breaths per minute[6].
Fig. 2. Working principle of respiration-rate sensors
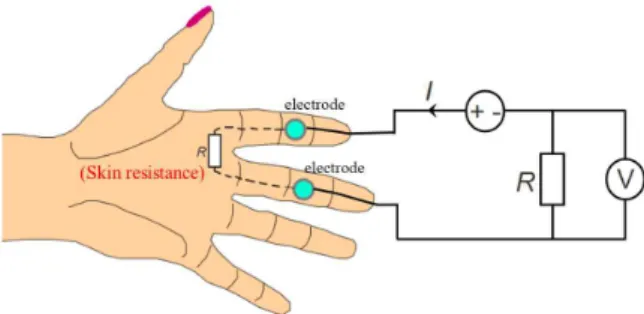
2.3 GSR sensor for skin resistance measurement
The reduction in skin resistance is related to increased blood flow followed by the physiological changes during high stress. To measure skin resistance, a very small voltage is applied across the electrodes (0-5V) as shown in Fig. 3. By measuringthe current that flows, the skin resistance can be measured by Ohm’s law, i.e. resistance = voltage divided by current[6].
Fig. 3. Skin resistance measurement technology
Ⅲ. Stress indicator questionnaire
For the regression in Eq. (1), we need to conduct a survey using a stress indicator questionnaire. In this paper, we use a questionnaire that is 10 item self administered questionnaire designed to measure the magnitude of human stress. By answering the stress indicator questions, we can find out how stressed people are. There are five choices to answer for each question. By selecting the appropriate choices to answer that fits the emotional condition, the stress indicator scales the stress levels[8]. The stress levels are ranging from 0 to 10.
The questionnaire was compiled in 2002-2005 by a joint study of the Wellmind Media and Mental Health Foundation. The two organizations have done numerous researches and works related to human stress management or mental state management. Their stress questionnaire method was internationally recognized in 2005[9].
The questionnaire consists of the following 10 questions and 5 answers[10].
Questions:
1) Been upset because of something that happened unexpectedly?
2) Felt that you were unable to control important things in your life?
3) Felt confident about your ability to handle your personal problems?
4) Felt nervous and 'stressed'?
5) Felt that things were going your way?
6) Found that you could not cope with all the things you had to do?
7) Been able to control irritations in your life?
8) Felt that you were on top of things?
9) Been angered because of things that happened that were out of your control?
10) Felt difficulties were piling up so high that you could not overcome them?
Answers:
1) Never
2) Almost never 3) Sometimes 4) Fair often 5) Very often
Ⅳ. System Structure
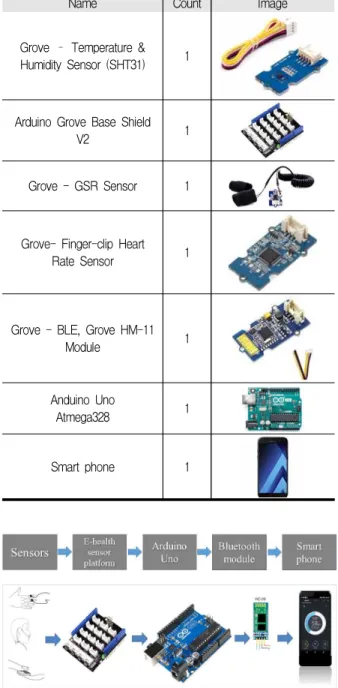
In order to build a system for determining the human psychological condition, it is necessary to choose and assemble the most appropriate devices for measuring and analyzing heart rate, respiration rate, and skin resistance caused by mood changes. Table 1 shows the devices we selected. The reason why we
chose these devices is because their measurement accuracy and speed is good, they are small in size, cheap, and light, and they are also easy to use and understand[4].
The Arduino Uno receives the responses to galvanic sensor, heart rate sensor, and pulse sensor.
Afterwards, the sensing data is sent to the Android phone via Bluetooth wireless communication. Then, the data is processed and the stress level is determined in the Android phone. If the stress level is high, the Android program leads users to relieve the stress of the person. Fig. 4 shows the data flow of our system.
Table 1. Hardware components used to build our system
Name Count Image
Grove – Temperature &
Humidity Sensor (SHT31) 1
Arduino Grove Base Shield
V2 1
Grove - GSR Sensor 1
Grove- Finger-clip Heart
Rate Sensor 1
Grove - BLE, Grove HM-11
Module 1
Anduino Uno
Atmega328 1
Smart phone 1
Fig. 4. Data flow of the proposed system
4.1 Data analysis on Android phone
In order to estimate the human stress level, 80 measurements were made on 40 people using the proposed system. Of the 40 participants, 22 were male and 18 were female, with ages ranging 17-45. We measured their physiological signals two times in two weeks. Measurements were taken when the participants were at rest sitting on the chair as shown in Fig. 5. If fingers are wet when measuring the stress, it can fail to get the right result because the
skin resistance result will be different from the regular one. So, participants were recommended to dry fingers before measuring their stress.
Measurements may vary depending on the unknown measuring environments or the physical condition of the participants. In this paper, we assume that such a variation is ignorable.
Fig. 5. Measuring stress level
Firstly, we tried to find out the relationship between stress levels and the individual physiological signals. As shown in Fig. 6, it turned out that the heart rates and respiration rates were in proportion to stress levels, while the skin resistance values were in inverse proportion to stress levels. Thus, the skin conductance (= reciprocal of the skin resistance) values were in proportion to stress levels as shown in Fig. 7.
It could be assumed that all the relationships are roughly linear. So, we defined the function
in Eq.(1) as a linear function as follows.
(2)Fig. 6. Relationship of each
h
,r
,s
value to stress levelFig. 7. Relationship between skin conductance and stress level
To estimate the weight parameters
,
,
, the following optimization was performed.min
(3)Here,
is the number of measurements. Value of
was obtained by the questionnaire survey. Then, the parameters were computed by:
(4)
The measurements and stress levels (0 to 10) had significantly different scales and thus were normalized in advance as follows.
′
max
min
min
(5)Here,
is one of
,
,
, and
.
max and
min denote its maximum and minimum value, respectively.From the normalized measurements and the questionnaire survey results, the computation results were
= 0.997,
= -0.042, and
= 0.026. The human stress was much more strongly correlated to heart rate than to the others. However, by using the weakly-correlated measurements together, we could ensure more accuracy in estimating the human stress.With these parameters, we evaluated the accuracy of estimating the human mental stress using Eq. (2). The mean error was 0.637 and its standard deviation was 0.486. Here, the error means the difference between the stress level estimated by our system and that obtained from the questionnaire method.
Note that the estimated parameters might be valid only for the participants in the experiment. Therefore,
it is necessary to verify that the estimated parameters are valid even for those who are not involved in the experiments, which remains as future work.
4.2 Design of Android application
Our Android application has three parts (activities), stress estimation activity in Fig. 8a, result visualization activity in Fig. 8b and stress removal/relief activity in Fig. 8c. The first activity shows the physiological signals sent from the Arduino sensors and estimates stress level. Then the second activity shows estimated stress levels in scores. If the stress level gets high, the third activity shows up automatically and has image buttons to provide users with stress relief music, books, videos, and teaching materials for light physical exercises such as yoga. Our Android application is shown in Fig. 8.
Fig. 8. Configuration of our Android application for stress monitoring and relief
ACKNOWLEDGMENTS
This research was supported by Basic Science Research Program through the National Research Foundation of Korea (NRF) funded by the Ministry of Education (NRF-2018R1D1A1B07045650).
REFERENCES
[1] B. W. Kang and S. H. Kim, “A development of non-invasive body monitoring IoT sensor for smart silver healthcare,”
Journal of the Institute of
Convergence Signal Processing, vol. 19, no. 1, pp.
28-34, 2018.
[2] J.-H. Kim, Y.-H. Noh, D.-U. Jeong, “Implementation of real-time heart activity monitoring system using heart sound,” Journal of the Institute of Convergence Signal
Processing, vol. 19, no. 1, pp. 14-19, 2018.
[3] M. Wingo, The Impact of the Human Stress Response:
The Biologic Origins of Human Stress, Roxwell
Waterhouse, 2006.[4] U. Natsagdorj, K.-S. Moon, and H. Park, “Human stress monitoring system using physiological sensors,” Proc. of
Fall Conference of Korea Institute of Convergence Signal Processing, pp. 73-74, 2018.
[5] R. H. Westgaard and J. Winkel, “Occupational musculoskeletal and mental health: significance of rationalization and opportunities to create sustainable production systems - a systematic review,” Appl. Ergon., vol. 42, no. 2, pp. 261–296, 2011.
[6] E. Kaniusas, Biomedical Signals and Sensors I: Linking
Physiological Phenomena and Biosignals, Springer
Science & Business Media, 2012.[7] S. Edwards, The Heart Rate Monitor Book for Cyclists:
A Heart Zones Training Program, 2
nd Ed., Velo Press, 2002.[8] DASS, http://www2.psy.unsw.edu.au/dass/.
[9] International Stress Management Association UK – 2016, https://isma.org.uk/.
[10] T. F. Geithner, Stress Test: Reflections on Financial
Crises, Crown Publishing Group, 2014.
저자 소개
울지바야르 (Ulziibayar Natsagdorj)
2017년 : MUST Darkhan School of Technology (공학사)
2018년 09월 ~ 현재 : 부경대학교 전자공학과 석사과정
관심분야 : 임베디드시스템
문 광 석 (Kwang-Seok Moon)
1979년 02월 : 경북대학교 전자공학과(공학사) 1981년 02월 : 경북대학교
전자공학과(공학석사) 1989년 02월 : 경북대학교
전자공학과(공학박사)
1990년 03월 ~ 현재 : 부경대학교 전자공학과 교수
관심분야 : 영상신호처리, 적응신호처리
박 한 훈 (Hanhoon Park)
2000년 02월 : 한양대학교 전자통신전파공학과(공학사) 2002년 02월 : 한양대학교
전자통신전파공학과(공학석사) 2007년 08월 : 한양대학교
전자통신전파공학과(공학박사) 2012년 03월 ~ 현재 : 부경대학교 전자공학과 부교수
관심분야 : 증강현실, 인간컴퓨터상호작용, 컴퓨터비전/그래픽스