pH Stress Alters Cytoplasmic Membrane Fluidity and atpB Gene Expression in Streptococcus mutans
Chul Min Cho, Seung Il Jung, Myung Sup Kim, Sae A Lee and Jung Sook Kang*
Department of Oral Biochemistry and Molecular Biology, School of Dentistry, Pusan National University, Yangsan 50612, Korea Received October 25, 2016 /Revised December 15, 2016 /Accepted December 22, 2016
Streptococcus mutans (S. mutans), which plays a major role in the etiology of human dental caries, is able to tolerate exposure to acid shock in addition to its acidogenicity. We investigated the effects of pH stress on membrane fluidity, activities and expression levels of F-ATPase, and proton permeability in S. mutans. Using 1,6-diphenyl-1,3,5-hexatriene, we observed membrane ordering at pH 4.8 and pH 8.8. The ordering effects were larger at pH 4.8 in cytoplasmic membranes isolated from S. mutans (CMSM). Increasing pH resulted in a decrease in the activities and expression levels of F-ATPase. The proton permeability was decreased at both acidic and alkaline pHs, and the lowest permeability was observed at pH 4.8. The lower permeability at pH 8.8 than pH 6.8 is likely to be caused by the de- creased proton influx due to the decreased CMSM fluidity. In addition, it seems to be evident that extremely low permeability at pH 4.8 was caused by the decreased proton influx due to the decreased CMSM fluidity as well as the increased proton efflux due to the increased activity and expression lev- el of F-ATPase. It is likely that CMSM fluidity and F-ATPase activity are two major key factors that determine proton permeability in S. mutans. We suggest that CMSM fluidity plays an important role in the determination of proton permeability, which sheds light on the possibility of using nonspecific membrane fluidizers, e.g., ethanol, for anti-caries purposes.
Key words : atpB gene expression, membrane fluidity, pH stress, proton permeability, Streptococcus
mutans
*Corresponding author
*Tel : +82-51-510-8226, Fax : +82-51-510-8228
*E-mail : [email protected]
This is an Open-Access article distributed under the terms of the Creative Commons Attribution Non-Commercial License (http://creativecommons.org/licenses/by-nc/3.0) which permits unrestricted non-commercial use, distribution, and reproduction in any medium, provided the original work is properly cited.
Journal of Life Science 2017 Vol. 27. No. 1. 15~22 DOI : https://doi.org/10.5352/JLS.2017.27.1.15
Introduction
Today, dental caries remains one of the most common diseases afflicting humans throughout the world. Although 200-300 bacterial species have been found associated with dental biofilm, only the presence of Streptococcus mutans (S.
mutans) has been consistently linked with the formation of human dental caries [17]. This gram-positive bacterium is able to demineralize dental enamel by generation of a lo- calized acidic environment in plaque by rapid glycolysis of dietary sugars to lactic acid. In addition to its acidogenicity, S. mutans is able to tolerate exposure to continual and rapid cycles of acid shock [10]. It has been known that acid toler- ance of S. mutans is primarily based on the presence of the membrane-bound, proton-pumping F-ATPase that can main- tain the intracellular pH [5, 7, 11, 16, 25]. However, very
few results have been reported for the expression of S. mu- tans F-ATPase in response to external pH.
The integrity of the bacterial cytoplasmic membrane is es- sential in maintaining the viability of cells and their metabol- ic functions particularly under stress. Bacteria actively adjust membrane fluidity through changes in lipid composition in response to alterations in temperature, pressure, ion concen- trations, nutrient availability, xenobiotics and pH [19].
Unsaturated fatty acids (UFAs) have crucial roles in main- tenance of membrane structure and function in many groups of aerobic bacteria. UFAs are key molecules in the regu- lation of cellular membrane fluidity. Quivey et al. [23]
showed that S. mutans grown at pH 5.0 had increased levels of mono-unsaturated fatty acids and longer chain fatty acids than cells grown at pH 7.0. Fozo and Quivey [8] reported that as the growth pH is lowered there is an incremental change from short-chained, saturated fatty acids (C
14:0and C
16:0) to long-chained, mono-unsaturated fatty acids (C
18:1and C
20:1). However, no attempt has been made yet to de- termine membrane fluidity alterations in response to envi- ronmental acidification in S. mutans.
Proton permeability is an important factor permitting cells
to maintain the proton-motive force (pmf) for vital energy
transducing processes. pmf is essential for S. mutans activity.
In addition to its high-affinity phosphotransferase sugar transport system, S. mutans has the second, low-affinity sug- ar uptake system, which is activated by pmf [12]. This is why S. mutans can survive under acidic conditions which are unfavorable to other bacteria. It has been shown that the proton permeability correlates with the physical state of the membrane; in particular, the permeability increases with increasing membrane fluidity [26].
The aims of this research are threefold: (1) to study the effects of pH stress on the fluidity of the cytoplasmic mem- branes isolated from S. mutans (CMSM); (2) to check the ex- pression levels of atpB gene of S. mutans under pH stress;
and (3) to examine the relationship between proton perme- ability, CMSM fluidity, and F-ATPase. We observed CMSM ordering at both acidic and alkaline pHs, however, the or- dering effects were larger at acidic pH. Our results suggest that CMSM fluidity plays a pivotal role in the viability of S. mutans under pH stress.
Materials and Methods Materials
S. mutans UA159 (#700610), a proven cariogenic dental pathogen [1], was purchased from ATCC (Manassas, VA, USA). Brain Heart Infusion (BHI) medium from Becton, Dickinson & Company (Franklin, NJ, USA); mutanolysin and phenylmethylsulfonyl fluoride (PMSF) from Sigma- Aldrich (St. Louis, MO, USA); DPH and Superscript
TMFirst-Strand Synthesis System for RT-PCR from Life Technol- ogies (NY, USA); and RNAProtect Bacteria Reagent and the RNeasy mini kit from Quiagen (Hilden, Germany).
Bacterial Culture
S. mutans was grown in 50 ml BHI medium for 16 hr at 37°C. The culture was used to inoculate 1 l flasks of pre- warmed BHI medium and incubated at 37°C until an absorb- ance reading of 0.7 at 600 nm was reached. The cultivation was done at either pH 4.8, 6.8 or 8.8. During cultivation, the bacteria exhibited a tendency to acidify the cultivation medium. So, the pH value was continuously monitored and adjusted by a stepwise addition of 500 mM KOH, if necessary. The growth curves were measured every 15 minutes. The growth rates (c) were calculated as c = Δ log
2(OD
420)/Δt where OD
420is the optical density at 420 nm, and t is time.
Preparation of Bacterial Cytoplasmic Membranes (CMSM)
Unless otherwise specified all steps were carried out at 0-4°C. Cells were washed once in 0.1 M phosphate-buffered saline (PBS), twice in 5 mM ethylenediaminetetraacetic acid (EDTA), and once in distilled water. Cells were lysed by treatment with mutanolysin. The enzyme was added to a final concentration of 20 μg/ml and incubated for 1 hr at 37°C. And then the lysed cells were broken with glass beads.
In all cases, 1 mM PMSF was added to inhibit the protease activity. The cell wall-membrane complexes were collected at 31,000× g for 1 hr after treatment of the lysates with ribo- nuclease and deoxyribonuclease (50 μg/ml each). They were washed extensively with 30 mM Tris-HCl containing 5 mM MgCl
2and layered on a one-step gradient of 56% (w/v) su- crose-3 mM EDTA over a cushion of 70% (w/v) sucrose-3 mM EDTA. The gradient was centrifuged in a Beckman Optima
TMLE-80K ultracentrifuge (Brea, CA, USA), using a SW28 rotor, at 40,000× g for 45 min. The material at the 56%
(w/v) and 70% (w/v) sucrose/EDTA interface was collected with a Pasteur pipette, diluted with PBS, and pelleted by centrifugation at 31,000× g for 45 min. The pellet was wash- ed extensively with PBS, divided into small aliquots, and stored at -70°C.
Cytoplasmic contamination was assessed by assaying the presence of glucokinase by the method of Porter and Chassy [22]. Total protein contents of membranes were determined by the method of Lowry et al. [18].
Fluorescence Measurements
Aliquots of CMSM were suspended in phosphate buffer (pH 4.8, 6.8 or 8.8) at a protein concentration of 50 μg/ml.
Stock solution of DPH was made in dimethylformamide.
The concentration of DPH was 1 μM and determined using molar extinction coefficients of 88,000 M
-1cm
-1at 350 nm. For incorporation of DPH, aliquots of stock solutions were add- ed to the membrane suspension, and the mixture was in- cubated at 37°C for 30 min in the dark. The excitation wave- length of DPH was 360 nm while emission was observed at 430 nm. Fluorescence measurements were carried out at 37°C using a Cary Eclipse fluorescence spectrophotometer (Varian Inc., Palo Alto, CA, USA).
The anisotropy of DPH is calculated by
where the intensity of the components of the fluorescence
that were parallel (I
VV) and perpendicular (I
VH) to the direction of the vertically polarized excitation light was determined by measuring the emitted light through polarizers oriented vertically and horizontally. The grating correction factor G is given by the ratio of the fluorescence intensities of the vertical (I
HV) to horizontal (I
HH) components when the exciting light is polarized in the horizontal direction.
F-ATPase assay
CMSM were added to Tris-maleate buffer (pH 7.0) with 10 mM MgSO
4,and the mixtures were warmed to 37°C. The ATPase reaction was initiated by addition of ATP (pH 7.0) and incubated at 37°C for 15 min. The reaction was stopped by adding 10% trichloroacetic acid. As the negative control, we did the same procedure, but added TCA at time zero in order to inactivate the enzyme first. The released phos- phate was determined using the method of Bencini et al.
[6].
RNA extraction and cDNA synthesis
Cells were harvested via centrifugation, resuspended and incubated in RNAProtect Bacteria Reagent at room temper- ature, and then centrifuged at 4,000× g for 10 min. The pel- lets were resuspended in 200 μl lysis buffer containing 20 mM Tris-HCl (pH 8.0), 20 mg/ml lysozyme, 1,000 U/ml mu- tanolysin, and 60 mAU/ml proteinase k. They were in- cubated at 37°C for 45 min, followed by two cycles of soni- cation for 15 sec twice.
RNA extractions were carried out with the RNeasy mini kit according to the manufacturer’s instructions. The concen- tration of RNA was spectrophotometrically measured as A
260, with its purity confirmed by the value of A
260/A
280.Total intact RNA obtained from S. mutans UA159 was re- verse-transcribed into cDNA using a Superscript
TMFirst- Strand Synthesis System for RT-PCR according to the manu- facturer’s instructions.
Real-time PCR
The resulting cDNA and negative controls were amplified by ABI PRISM 7700 real-time PCR system with SYBR Green PCR Master Mix (Applied Biosystems, Foster City, CA, USA). The primers were: 5'-AGGCCGACTTTACCACCTTT- 3' (forward) and 5´-TCCGGTTGGAAAAGAAACAC-3´
(reverse) for atpB; 5´-TTTGACGGTCTCCGATAACC-3´
(forward) and 5´-TGTTGATGGTCTGGGTGAAA-3´(reverse)
for atpD; and 5´-AAGCAACGCGAAGAACCTTA-3´ (for- ward) and 5´-GTCTCGCTAGAGTGCCCAAC-3´(reverse) for 16S rRNA.
Each reaction tube contained 20 μl of reaction mixture, including 1X SYBR Green PCR Master Mix, cDNA, template, and 2 μl of 10 pM forward and reverse primers. The cycle profile was as follows: 1 cycle at 50°C for 5 min and initial denaturation at 95°C for 10 min, followed by 40 cycle ampli- fication consisting of denaturation at 95°C for 15 s, annealing at 54°C for 30 s, and extension at 72°C for 30 s.
The relative expression was calculated by normalizing the mRNA of the atpB and atpD genes with that of the 16S rRNA gene, which served as the reference gene.
Proton flux assay
The proton permeability was assessed using the proce- dures described previously [4, 21]. Cells were harvested by centrifugation and washed in 5 mM MgCl
2. They were sus- pended at a cell density of 5 mg/ml in 20 mM potassium phosphate buffer (either pH 4.8, 6.8, or 8.8) for 1 hr to deplete the endogenous catabolites. The cells were centrifuged again and suspended at a cell density of 25 mg/ml in 150 mM KCl + 1 mM MgCl
2. The suspensions were then titrated to pH 4.6 with 0.5 M HCl until the pH value stabilized, as in- dicated by no pH change for at least 2 min. Then 0.5 M HCl was added to decrease the pH values in approximately 0.4 units. The subsequent increase in pH associated with pro- ton movements across the cell membrane into the cytoplasm was monitored using a glass electrode. 10% (v/v) butanol was added to the suspensions at 80 min to disrupt the cell membrane.
Statistical analysis
The data are presented as mean ± SEM. Student’s t-test was performed to determine the significant difference.
Values were considered statistically significant when P value was <0.05. The statistical analyses were performed using IBM SPSS Statistics 23 (SPSS Inc., Chicago, IL, USA).
Results and Discussion
Effects of pH stress on the fluidity of CMSM First of all, we compared the growth rates of S. mutans cultured under pH stress. The measured growth rates, calcu- lated as c = Δlog
2(OD
420×1,000)/Δt, are depicted in Fig. 1A.
It is seen that pH stress did not allow a full recovery of
A
B
Fig. 1. Cell growth and cytoplasmic membrane fluidity. (A) Growth curves of S. mutans UA159 grown at pH 4.8 (filled triangle), pH 6.8 (filled circle) and pH 8.8 (filled square). The growth rates (c) were calculated as c = Δlog2(OD420)/Δt where OD420
is the optical density at 420 nm and t is time. Each point represents an average of three independent experiments. (B) Effects of pH stress on the anisotropy (r) of DPH in the cytoplasmic membranes isolated from Streptococcus mutans (CMSM). The anisotropy values were calculated using the equation in Materials and Methods. Each bar represents the mean ± SEM of 5 determinations. *p<0.05, **p<0.01, ***p<0.001 vs. control (culture pH 6.8–buffer pH 6.8).
the growth rate measured at optimum pH of 6.8. Compared to pH 6.8 (c=0.0352 min
-1), the growth rates were reduced to 0.0119 and 0.0301 min
-1for S. mutans cultured at pH 4.8 and 8.8, respectively.
We measured CMSM fluidity using DPH anisotropy be- cause DPH is the most widely used membrane probe which distributes evenly throughout the hydrophobic regions of membrane lipids. To evaluate the effect of pH, we manipu- lated the pH of both culture media and measuring phos- phate buffer. In other words, CMSM was isolated from S.
mutans grown in BHI media differing in pH (either 4.8, 6.8 or 8.8) and suspended in phosphate buffer (either pH 4.8, 6.8 or 8.8). Fig. 1B shows the effects of pH stress on the anisotropy values (r) of DPH in CMSM. At the same culture and buffer pHs, the order of anisotropy values was: pH 4.8
> pH 8.8 > pH 6.8. Again, when the CMSM differing in cul- ture pHs were exposed to phosphate buffer of optimum pH 6.8, the order of anisotropy was: culture pH 4.8 > culture pH 8.8 > culture pH 6.8. In addition, at all culture pHs, the order of anisotropy values was: buffer pH 4.8 > buffer pH 8.8 ≥ buffer pH 6.8. Taken together, these results indicate CMSM rigidification by pH stress, especially acidic pH since a decrease of the anisotropy of DPH reflects an increase of the rotational mobility. This indicates CMSM rigidification by both acidic and alkaline pHs, which is opposite to the prediction of membrane fluidization by Petrackova et al.
[20]. It was inferred mainly from the increase in the amount of monounsaturated fatty acids in S. mutans. The fact that there was concomitant increase in the amount of long chain fatty acids was overlooked. In addition, in the analysis of fatty acids, Quivey et al. [23] and Fozo and Quivey [8] used lipid extracts from whole bacteria, instead of CMSM. So, it is possible that the change in the lipid composition may not reflect exactly that of CMSM. The possibility of the pres- ence of intracellular organelle lipids cannot be excluded.
Membrane ordering at acidic pH is consistent with the re- sults obtained previously using Oenococcus oeni [19] and Bacillus subtilis [20]. However, Bacillus subtilis showed mem- brane fluidization by alkaline pH [20], which does not co- incide with our result. We assume that membrane effects of pH are different depending on the organisms.
Among the nine combinations of culture and buffer pHs,
the CMSM with culture and buffer pH 6.8 were the most
fluid. On the other hand, CMSM were the most ordered at
culture pH 8.8 and buffer pH 4.8. When the CMSM of cul-
ture pH 4.8 were exposed to pH 8.8 buffer, the extent of
CMSM ordering was much smaller. This may be due to the
acid tolerance of S. mutans. Buffer pH resulted in a com-
parable fluidity change to culture pH. In view of the fact
that CMSM are composed of not only lipids but also pro-
teins, it is highly probable that the pH changes result in a
significant change in protein conformations as well.
A
B
Fig. 2. Activities and expression levels of F-ATPase. (A) Specific activities of F-ATPase in CMSM. The ATPase reaction was initiated by addition of ATP. (B) Relative mRNA levels for the atpB and atpD genes of S. mutans UA159. The relative values were obtained by normalizing the atpB and atpD mRNA with expression of 16S rRNA gene. The Data are reported as mean ± SEM of triplicate analysis of three preparations. *p<0.05, **p<0.01, ***p<0.001.
Effects of pH stress on the F-ATPase activities and the expression levels of the atpB gene in S. mutans
Although recent studies have shown that a large pro- portion of the S. mutans genome is required for acid toler- ance [2, 3, 24], the F-ATPase is still considered as one of the key components of the acid tolerance response. The F-ATPase activity is critical for establishing and maintaining pmf across CMSM. The F-ATPase activity might be influ- enced by CMSM ordering under pH stress. The order of F-ATPase activity was: pH 4.8 > pH 6.8 > pH 8.8 (Fig. 2A).
Our results agree with those of others who showed in- creased levels of F-ATPase activity in acidic environment [5, 7, 11, 16, 25]. The lowest F-ATPase activity was obtained with CMSM from S. mutans cultured at pH 8.8.
The F-ATPase operon promoter [13, 15] and atp genes [2, 9] of S. mutans were transcriptionally upregulated at acidic pH. We checked the relative quantities of mRNA expression of the atpB gene which encodes the catalytic β-subunit of F-ATPase (Fig. 2B). The mRNA expression levels were: pH 4.8 > pH 6.8 > pH 8.8. The S. mutans F-ATPase was transcrip- tionally upregulated at pH 4.8 and downregulated at pH 8.8. Similar results were obtained for the expression of atpD (regulatory α-subunit gene). Increasing pH resulted in a de- crease in the activities and the expression levels of F-ATPase.
Relationship between fluidity, proton permeability and F-ATPase activity
Petrackova et al. [20] reported decreased proton perme- ability at both acidic and alkaline pH in Bacillus subtilis.
Hence, it is highly probable that the above rigidification is
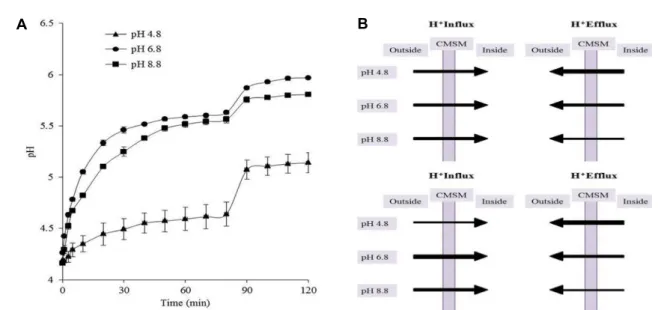
related to CMSM’s permeability to protons and/or other ions. We performed an acidic pH-jump assay in intact cells adapted to pH 4.8, 6.8 and 8.8. Fig. 3A shows the results of the proton flux assay. It can be seen that, following the initial pH pulse, the pH of the cell suspension starts to grad- ually increase as a consequence of cellular proton uptake.
The rate of the pH increase was found to be the highest for S. mutans cultivated at pH 6.8 and the lowest at pH 4.8.
We examined the relationship between cytoplasmic mem- brane fluidity, F-ATPase activity and proton permeability in S. mutans. The upper model of Fig. 3B shows the proton flux in S. mutans when we consider only F-ATPase activity.
Without considering CMSM fluidity, equal amounts of pro- tons will pass through CMSM at all three pHs. Under these circumstances, the order of proton permeability will be: pH 8.8 > pH 6.8 > pH 4.8. Of course, this was not the case.
Under our experimental conditions, S. mutans grown at pH
6.8 showed the highest proton permeability (Fig. 3A). The
lower permeability at pH 8.8 than pH 6.8 is likely to be
caused by decreased proton influx due to decreased CMSM
fluidity. The decreased proton influx seems to offset the ef-
fect of the lowest proton efflux. In addition, very low perme-
ability of S. mutans grown at pH 4.8 can be better explained
when considering CMSM fluidity together (lower model in
Fig. 3B). It seems to be evident that extremely low perme-
ability at pH 4.8 was caused by decreased proton influx due
to decreased CMSM fluidity as well as increased proton ef-
flux due to the increased activity and expression level of
F-ATPase. Thus, it is likely that CMSM fluidity and
F-ATPase activity are two major key factors that determine
A
B
Fig. 3. Proton permeability and two hypothetical models. (A) Proton flux assay of intact S. mutans UA159 grown at pH 4.8 (filled triangle), pH 6.8 (filled circle) and pH 8.8 (filled square). 10% (v/v) butanol was added at 80 min to disrupt the cell membranes.
Data are reported as mean ± SEM of triplicate analysis of three preparations. (B) Two hypothetical models of proton flux in S. mutans UA159. Proton efflux (right panels) depends on F-ATPase activity. The CMSM isolated from S. mutans adapted to pH 4.8 removes the largest number of protons out of the cells because of the highest activity. For the CMSM from cells grown at pH 8.8, the smallest number of protons is extruded. Suppose that proton influx (left panels) may or may not be dependent on membrane fluidity. We assume that protons enter the CMSM in uncharged, acid form. In the upper model, CMSM fluidity was not considered. At all pHs, equal amount of protons pass through CMSM. The lower model shows the proton flux through CMSM when we consider both membrane fluidity and F-ATPase activity. Depending on the fluidity, different amounts of protons pass through CMSM. For convenience, three different widths of the lines of arrows were arbitra- rily chosen. They do not show the exact difference among them.
proton permeability in S. mutans.
The suggestion that CMSM fluidity plays an important role in determination of proton permeability sheds light on the possibility of the use of nonspecific membrane fluidizers, e.g., ethanol, for anti-caries purposes. Ethanol might influ- ence S. mutans viability, or, at least, be used as an adjunct to fluoride dentifrices and anti-plaque mouthrinses. Howev- er, it should be pointed out that we used S. mutans in suspensions. More convincing results can be obtained using S. mutans in biofilms which contain the extracellular poly- saccharide matrix [14]. Additionally, only steady-state fluo- rescence measurements were performed. Time-resolved ani- sotropy decay will give us information about the rate and range of rotational motions of DPH within CMSM.
To our knowledge, this report is the first to examine CMSM fluidity and to elucidate the relationship between membrane fluidity, the activities and the expression levels of F-ATPase, and proton permeability in S. mutans under pH stress.
Acknowledgement
This work was supported by a 2-Years Research Grant of Pusan National University.
References
1. Ajdić, D., McShan, W. M., McLaughlin, R. E., Savić, G., Chang, J., Carson, M. B., Primeaux, C., Tian, R., Kenton, S., Jia, H., Lin, S., Qian, Y., Li, S., Zhu, H., Najar, F., Lai, H., White, J., Roe, B. A. and Ferretti, J. J. 2002. Genome se- quence of Streptococcus mutans UA159, a cariogenic dental pathogen. Proc. Natl. Acad. Sci. USA 99, 14434-14439.
2. Baker, J. L., Abranches, J., Faustoferri, R. C., Hubbard, C.
J., Lemos, J. A., Courtney, M. A. and Quivey, R. G. 2015.
Transcriptional profile of glucose-shocked and acid-adapted strains of Streptococcus mutans. Mol. Oral Microbiol. 30, 496- 517.
3. Baker, J. L., Faustoferri, R. C. and Quivey, R. G. 2016. Acid- adaptive mechanisms of Streptococcus mutans-the more we know, the more we don't. Mol. Oral Microbiol. doi: 10.1111/
omi.12162.
4. Ban, S. H., Kim, J. E., Pandit, S. and Jeon, J. G. 2012. Influen- ces of Dryopteris crassirhizoma extract on the viability, growth and virulence properties of Streptococcus mutans.
Molecules 17, 9231-9244.
5. Belli, W. A. and Marquis, R. E. 1991. Adaptation of Strepto- coccus mutans and Enterococcus hirae to acid stress in con- tinuous culture. Appl. Environ. Microbiol. 57, 1134-1138.
6. Bencini, D. A., Shanley, M. S., Wild, J. R. and O’Donovan, G. A. 1983. New assay for enzymatic phosphate release: ap- plication to aspartate transcarbamylase and other enzymes.
Anal. Biochem. 132, 259-264.
7. Bender, G. R., Sutton, S. V. and Marquis, R. E. 1986. Acid tolerance, proton permeabilities, and membrane ATPases of oral streptococci. Infect. Immun. 53, 331-338.
8. Fozo, E. M. and Quivey, R. G. 2004.Shifts in the membrane fatty acid profile of Streptococcus mutans enhance survival in acidic environments. Appl. Environ. Microbiol. 70, 929-936.
9. Gong, Y., Tian, X. L., Sutherland, T., Sisson, G., Mai, J., Ling, J. and Li, Y. H. 2009. Global transcriptional analysis of acid-inducible genes in Streptococcus mutans: multiple two- component systems involved in acid adaptation. Microbiol- ogy 155, 3322-3332.
10. Gutierrez, J. A., Crowley, P. J., Cvitkovitch, D. G., Brady, L. J., Hamilton, I. R., Hillman, J. D. and Bleiweis, A. S. 1999.
Streptococcus mutans ffh, a gene encoding a homologue of the 54kDa subunit of the signal recognition particle, is in- volved in resistance to acid stress. Microbiology 145, 357-366.
11. Hamilton, I. R. and Buckley, N. D. 1991 Adaptation by Streptococcus mutans to acid tolerance. Oral Microbiol. Immun.
6, 65-71.
12. Hamilton, I. R. and St, Martin, E. J. 1982. Evidence for the involvement of proton motive force in the transport of glu- cose by a mutant of Streptococcus mutans strain DR0001 de- fective in glucose-phosphoenopyruvate phosphotransferase activity. Infect. Immun. 36, 567-575.
13. Hwang, G., Liu, Y., Kim, D., Sun, V., Aviles-Reyes, A., Kajfasz, J. K., Lemos, J. A. and Koo, H. 2016. Simultaneous spatiotemporal mapping of in situ pH and bacterial activity within an intact 3D microcolony structure. Scientific Reports.
doi:10.1038/srep32841.
14. Koo, H., Falsetta, M. L. and Klein, M. I. 2013. The exopoly- saccharide matrix: a virulence determinant of cariogenic biofilm. J. Dent. Res. 92, 1065-1073.
15. Kuhnert, W. L., Zheng, G., Faustoferri, R. C. and Quivey, R. G. 2004. The F-ATPase operon promoter of Streptococcus
mutans is transcriptionally regulated in response to external pH. J. Bacteriol. 186, 8524-8528.
16. Lemos, J. A., Abranches, J. and Burne, R. A. 2005. Responses of cariogenic streptococci to environmental stresses. Curr.
Issues Mol. Biol. 7, 95-108.
17. Loesche, W. J. 1986. Role of Streptococcus mutans in human dental decay. Microbiol. Rev. 50, 353-380.
18. Lowry, O. H., Rosebrough, N. J., Farr, A. L. and Randall, R. J. 1951. Protein measurement with the Folin phenol reagent. J. Biol. Chem. 193, 265-275.
19. Mykytczuk, N. C., Trevors, J. T., Leduc, L. G. and Ferroni, G. D. 2007. Fluorescence polarization in studies of bacterial cytoplasmic membrane fluidity under environmental stress.
Prog. Biophys. Mol. Biol. 95, 60-82.
20. Petrackova, D., Becer, J., Svobodova, J. and Herman, P. 2010.
Long-term adaptation of Bacillus subtilis 168 to extreme pH affects chemical and physical properties of the cellular membrane. J. Membr. Biol. 233, 73-83.
21. Phan, T. N., Buckner, T., Sheng, J., Baldeck, J. D. and Marquis, R. E. 2004. Physiologic actions of zinc related to inhibition of acid and alkali production by oral streptococci in suspensions and biofilms. Oral Microbiol. Immunol. 19, 31-38.
22. Porter, E. V. and Chassy, B. M. 1982. Glucokinase from Streptococcus mutans. Methods Enzymol. 90, 25-30.
23. Quivey, R. G., Faustoferri, R., Monahan, K. and Marquis, R. 2000. Shifts in membrane fatty acid profiles associated with acid adapation of Streptococcus mutans. FEMS Microbiol.
Lett. 189, 89-92.
24. Quivey, R. G., Grayhack, E. J., Faustoferri, R. C., Hubbard, C. J., Baldeck, J. D., Wolf, A. S., MacGilvray, M. E., Rosalen, P. L., Scott-Anne, K., Santiago, B., Gopal, S., Payne, J. and Marquis, R. E. 2015. Functional profiling in Streptococcus mu- tans: construction and examination of a genomic collection of gene deletion mutants. Mol. Oral Microbiol. 30, 474-495.
25. Quivey, R. G., Kuhnert, W. L. and Hahn, K. 2000. Adaptation of oral streptococci to low pH. Adv. Microb. Physiol. 42, 239- 274.
26. Zhang, G. J., Liu, H. W., Yang, L., Zhong, Y. G. and Zheng, Y. Z. 2000. Influence of membrane physical state on the lyso- somal proton permeability. J. Membr. Biol. 175, 53-62.
초록:pH stress가 Streptococcus mutans 의 형질막 유동성 및 atp B 유전자 발현에 미치는 영향 조철민․정승일․김명섭․이새아․강정숙*
(부산대학교 치의학전문대학원 구강생화학교실)