http://dx.doi.org/10.9728/dcs.2017.18.1.149
This is an Open Access article distributed under the terms of the Creative Commons Attribution Non-CommercialLicense(http://creativecommons .org/licenses/by-nc/3.0/) which permits unrestricted non-commercial use, distribution, and reproduction in any medium, provided the original work is properly cited.
Received 21 December 2016; Revised 29 December 2016 Accepted 25 February 2017
*Corresponding Author: Kyungbaek Kim
Tel: +82-62-530-3438
E-mail: [email protected]
JDCS Vol. 18, No. 1, pp. 149-158, Feb. 2017
농업 빅데이터 수집 및 분석을 위한 플랫폼 설계
뉘엔 반 퀴엣 · 뉘엔 신 녹 · 김 경 백*
전남대학교 전자컴퓨터공학부
Design of a Platform for Collecting and Analyzing Agricultural Big Data
Van-Quyet Nguyen · Sinh Ngoc Nguyen · Kyungbaek Kim
*Department of Electronics and Computer Engineering, Chonnam National University
[요 약]
빅데이터는 경제개발에서 흥미로운 기회와 도전을 보여왔다. 예를 들어, 농업 분야에서 날씨 데이터 및 토양데이터와 같은 복 합데이터의 조합과 이들의 분석 결과는 농업종사자 및 농업경영체들에게 귀중하고 도움되는 정보를 제공한다. 그러나 농업 데이 터는 센서들과 농업 웹 마켓 등의 다양한 형태의 장치 및 서비스들을 통해 매 분마다 대규모로 생성된다. 이는 데이터 수집, 저장, 분석과 같은 빅데이터 이슈들을 발생시킨다. 비록 몇몇 시스템들이 이 문제를 해결하기 위해 제안되었으나, 이들은 다루는 데이터 종류의 제약, 저장 방식의 제약, 데이터 크기의 제약 등의 문제를 여전히 가지고 있다. 이 논문에서는 농업데이터의 수집과 분석 플 랫폼의 새로운 설계를 제안한다. 제안하는 플랫폼은 (1) Flume과 MapReduce를 이용한 다양한 데이터 소스들로부터의 데이터 수 집 방법, (2) HDFS, HBase, 그리고 Hive를 이용한 다양한 데이터 저장 방법, (3) Spark와 Hadoop을 이용한 빅데이터 분석 모듈들을 제공한다.
[Abstract]
Big data have been presenting us with exciting opportunities and challenges in economic development. For instance, in the agriculture sector, mixing up of various agricultural data (e.g., weather data, soil data, etc.), and subsequently analyzing these data deliver valuable and helpful information to farmers and agribusinesses. However, massive data in agriculture are generated in every minute through multiple kinds of devices and services such as sensors and agricultural web markets. It leads to the challenges of big data problem including data collection, data storage, and data analysis. Although some systems have been proposed to address this problem, they are still restricted either in the type of data, the type of storage, or the size of data they can handle. In this paper, we propose a novel design of a platform for collecting and analyzing agricultural big data. The proposed platform supports (1) multiple methods of collecting data from various data sources using Flume and MapReduce; (2) multiple choices of data storage including HDFS, HBase, and Hive; and (3) big data analysis modules with Spark and Hadoop.
색인어 : 농업 빅데이터 플랫폼, 분산시스템, 수집, 분석, 저장
Key word : Agricultural Big Data Platform, Distributed Systems, Collecting, Analyzing, Storage.
Ⅰ. Introduction
Big data plays an important role in modern agriculture development. It has been a key driver of the progress made in precision agriculture, whereby farmers and agribusinesses are using the resources at their disposal in the most efficient way possible to get maximum yields. However, the massive data in agriculture are generated in every minute through multiple kinds of devices and services such as sensors, social networks, and agricultural web markets. Therefore, collecting these data from the many sources and translating them into useful information are the challenges of big data in order to improve business processes continuously.
There are several techniques and tools for collecting data from web sites as shown in [1][2]. The most popular web page analyzing tool is Jsoup [3] based on Java. Jie Wang et al. [4] have been designed and implemented an agricultural products big data platform based on Jsoup, in which the data were extracted from the URL and contents of agricultural web sites. However, their system only supported to deploy on a single computer which encounters various challenges of big data problem. Also, collecting data from web sites has a limitation of the number of available HTTP requests. It often takes a few seconds per request to obtain available resources. Meanwhile, most of agriculture web sites provide the data as a form of a table with many pages, and it requires a lot of simultaneous HTTP requests to crawl these data.
For example, in the web site of Gwangju Seobu market, the price data of agriculture products are generated in around five hundred pages per day, and these data are updated continuously in every a few minutes. Therefore, in order to crawl these continuous and large data with high performance as well as high availability, it is essential to design a crawling system which collects data in parallel and real-time fashion. In this paper, we design a data collector based on Flume [5] and Hadoop [6] framework (more details see in Section 3).
For data storage, a traditional database system such as a Relational DataBase Management System (RDBMS) is not suitable to store various types of big data. Currently, Hadoop Distributed Files System (HDFS) [7] is widely used for a basic distributed storage of big data. It enables scalable and reliable data storage, and it was designed to span large clusters of commodity servers. Besides HDFS which is a basic storage, a storage framework for big data is Hbase. Actually Hbase has a data model designed to provide quick random access to huge amounts of structured data. It is built on the top Apache Hadoop and becomes an increasingly popular database choice for applications which need fast random access to large amounts of
data. Another data storage framework is Hive which is used to store and process big data in distributed environment with SQL-like query language called Hive Query Language(HiveQL).
In our platform, we utilize the advantages of both storage frameworks for designing data storage modules (more details see in Section 4).
For analyzing big data, there are several frameworks supporting effective parallel processing in distributed modes.
Apache Hadoop has been the most popular framework for big data processing. It provides a parallel computation model MapReduce [8]. Recently, Apache Spark [9] has emerged as a leading distributed computing framework for real-time analytics with its memory-oriented architecture and flexible processing libraries. These two frameworks are being widely used in many big data applications, and there are some reports for simple performance comparison between Hadoop and Spark in past [10][11]. However, no comprehensive study related to the performance of these two frameworks in the aspect of the volume of data and the complexity of computation. In this paper, we highlight the performance comparison between Spark and Hadoop with various volumes and complexities in order to evaluate the design choice of data processing modules of our proposed agricultural big data platform.
The rest of this paper is organized as follows. In Section 2, we present the architecture of agricultural big data platform. Section 3 shows the design choice of data collecting modules for crawling and aggregating real-time and archival data from Internet. The design choice of data storage modules is presented in Section 4.
In section 5, we presented the design choice of big data processing which conducts not only simple arithmetic calculation but also various complex analyses such as machine learning algorithms and image processing algorithms. Section 6 shows the experiment results to evaluate our proposed platform. Finally, we conclude this paper and discuss future works in Section 7.
Ⅱ. Architecture of Proposed Platform
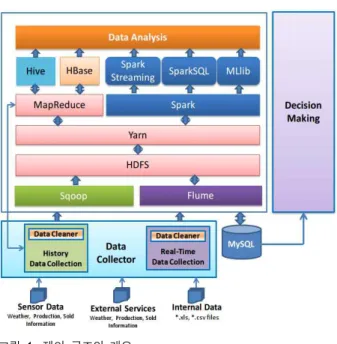
We propose a platform for collecting and analyzing agriculture big data with four parts as follows: Data Collector, Data Storage, Data Analysis, and Decision Making module. Figure 1 shows the overview of the architecture of our platform.
The first component in our architecture is Data Collector. We
separate input data into two kinds of input, the first one is
real-time data from sensors or web pages and the second is
archival data from archives. For real-time data, we use Flume to
collect them into HDFS. For archival data, whose volume is huge,
그림 1. 제안 구조의 개요
Figure 1. Overview of the proposed architecture
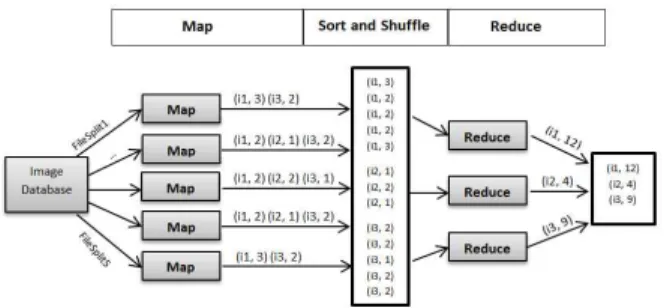
그림 3. 하둡 맵리듀스를 이용한 기록적 데이터 수집 Figure 3. Archival data collecting with Hadoop Map
Reduce
그림 2. 아파치 플럼을 이용한 실시간 데이터 수집 Figure 2. Real-time data collecting with Apache Flume
we develop a MapReduce-based module to increase the speed of collecting data by gathering them in the parallel manner. During collecting data we use Data Cleaner to remove the redundant data and irregular data.
In order to store the data from Data Collector, we use Hadoop Distributed File System (HDFS) as a basic big data distributed storage running on commodity servers with low-cost hardware.
For Data Storage, we also have HBase which is a distributed column-oriented database built on top of HDFS. Hbase is a data model designed to provide quick random access to huge amounts of structured data. We use other big data storage, Hive, that is a data warehouse infrastructure tool to process structured data in Hadoop. It resides on top of Hadoop to summarize big data, and makes querying easy. Also, we use Sqoop to import data from csv and xls files into HDFS, Hive or HBase. Sqoop is also used to export the results after analysis back to MySQL.
Data Analysis is an important component in the proposed platform. After collecting and storing data, we develop Spark-based and Hadoop-based processing modules for analyzing a large amount of data with various methods. To show the viability of our platform, we implement various machine learning algorithms to making clusters or classifying data in these processing modules such as K-Mean and Naive Bayes.
The last module of the system is Decision Making module. It receives the result from the Data Analysis module, and generate some useful decisions for user to manage their farm easily. Also, it provides the statistical data stored in Data Storage such as HDFS, Hive, HBase and MySQL for users to use various kinds of purposes.
Ⅲ. Design Choice of Collecting Module
3-1 Design of Real-Time Data Crawling Module
This module is designed to crawl the data generated by other systems or services. To simplify the crawling process, we use powerful capabilities of handling streaming data of Flume for collecting real-time data efficiently and moving large amounts of data periodically into HDFS.
Figure 2 shows our design for collecting data using Flume. In this model, we use text files as input data of Flume, such as price data of products provided from agricultural web sites. We set the type of a source is Exec which runs a given command such as
“tail –F [file]” to generate the fresh and periodic data of prices continuously. Here, the memory is used as a Flume channel and the generated data from sources are stored in memory. Note that, the number of data in channel is configurable in Flume. For the final output data, we chose sink type as HDFS which writes events into the HDFS as text file format, and these files are used for further analysis.
3-2 Design of Archival Data Crawling Module
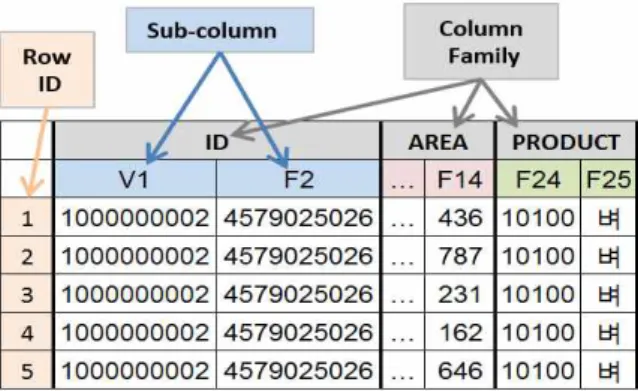
그림 5. Hbase 테이블 데이터 저장의 예
Figure 5. Example of storing data on HBase Table
그림 4. 맵 함수인 DataCrawl의 알고리즘
Figure 4. Algorithm of DataCrawl for map function
Not only real-time data, but also archival data is essential for big data analysis. That is, more data is better than more sophisticated modelling. Thus, we design a module to collect the archival data from various web sites such as few years long price data of agricultural products and few years weather information.
We observed that the data structure of displaying product price is similar in the most of Korean agriculture web markets, and the amount of data per year is approximately two millions of records.
To collect these huge data efficiently, we use Hadoop framework with MapReduce programming model.
In Figure 3, a simple model of gathering archival data from web sites which are described on HDFS input files. A HDFS file contains the information of procedures which we want to gather from various web sites. The information of procedures is described as a tuple of a product code, the url of a web site, target year, and target month. The information of procedures are divided and each map function handles them with DataCrawl procedures which uses Jsoup API to connect and extract data from the web site corresponding the information of procedures and store the extracted data into HDFS. That is, each map function collects the data of product prices from agriculture web market in the order of years and months. Detail algorithm of DataCrawl is described in Figure 4.
In this module we omit reduce functions, even though MapReduce framework provides both of map and reduce function because the job of collecting archival data is simple. According to this we can take advantages in time by ignoring shuffle and sort phase between map and reduce function.
Ⅳ. Design Choice of Data Storage Module
4-1 Design of Basic Distributed Storage
Basically, we need a basic storage for storing raw data which contains the crawled information from web sites, sensors, and users. These raw data are usually contained in text files in sequential manner. For example, in case of image processing we may convert a RGB color image into gray image which includes arrays of bits 0 and 1, and the price data crawled from web sites are stored in a text file. These raw data are the basic data for analysis and we use HDFS as a basic storage for them.
4-2 Design of Storage for Random Access
Even though most of data are stored on HDFS in our platform, we also use HBase to store structured data in order to improve the performance of searching random data. Sometimes, it is required to access any point of data during big data analysis. That is, it is essential to provide quick random access to huge amount of data in our platform. In order to achieve this effective random access, we use HBase for manage a data schema and data storage for random access.
Figure 5 shows an example of data schema for agricultural data in HBase table. It provides a column-oriented and row-oriented mechanism and it manages data through column families and Row-ID. Each column family includes several sub-columns like the columns in SQL database. When we load the data from HBase table to processing phase, all of sub-column will be load together.
It is more convenient for programmer in processing data. Row-ID
is an identity of each row. It looks like the index in SQL, which is
used for random data access.
그림 6. 맵리듀스를 이용한 이미지 히스토그램 계산
Figure 6. Image histogram calculation using MapReduce 4-3 Design of Storage for querying data
In our platform, we also consider an easy API for querying data with SQL query language. For this, we use Hive because it is simple to implement and easy to integrate into our platform. Hive is built on the top of Hadoop and provides SQL query language called HiveQL for easy interacted to data.
Ⅴ. Design Choice of Processing Module
In agricultural data processing, we considers to two kinds of data: one is text data and another is image data.
For processing text data, we often work with two kind of algorithms: (1) the arithmetic calculation that used to process data with only one step (non-iterative job) and (2) machine learning algorithms which process data with iterative computation. Both of algorithms are supported by our platform with Hadoop and Spark.
For handling image data, we design and implement a image processing module which provides customized InputFormat and OutputFormat classes of Hadoop for representing image, and contains image processing algorithms.
5-1 Design of Non-Iterative Processing
For data analysis, we can consider a non-iterative processing job which runs one-time and gets the result. For example, calculating the total field area of each farm or the average product price of each market is a non-iterative processing job. This job handle very large volume of data set such as 2GB of agriculture data with more than 11 millions of records which contains the information about the farm and its related information (the area over each field, products for each field). For supporting this kind of jobs, we provide simple algorithm templates for non-iterative jobs on both Hadoop and Spark.
5-2 Design of Iterative Processing
The purpose of this case is to evaluate the performance of Hadoop and Spark in processing a huge amount of data with an iterative algorithm such as K-means algorithm. K-means algorithm is a well-known clustering method. It groups objects (data points) based on features into K number of groups. K-means algorithm performs the following steps:
Step 1: Selecting k data points from dataset to be used as each cluster centroid (random).
Step 2: Assigning data points to clusters according to their
distance to each cluster centroid.
Step 3: For each cluster, recomputing its cluster centroid using the newly assigned cluster members.
Step 4: Going back to step 2 until the process converges.
In k-means algorithm, the computation cost is mainly made in the step 2 for calculating distances, and in each iteration it requires a total of (n*k) times of distance computations.
Therefore, the performance of each iteration is the key for improving the performance of the algorithm. According to this, we separate the distance calculation step from the main algorithm and implement a map-reduce function for this step for MapReduce and Spark. It is possible because the execution order of distance calculation does not affect the final result of clustering. Especially for Spark, we implement a Java program to set up the parameters and call functions of K-means algorithm in Spark MLlib library.
Based on this simple design and implementation, we provide a simple templates for iterative jobs on MapReduce and Spark for supporting iterative jobs.
5-3 Design of Image Processing Module
In our platform, image processing operations can be divided into two levels including low-level image processing and high-level image processing. For low-level image processing, we provide algorithms for pre-processing which operates at the pixel level. The input to low-level image processing operators is an image whereas the output is either image or data. For high-level image processing, we implement the algorithms in order to generate higher abstractions. They are used to interpret the image content such as classification and object recognition.
For an example, we implemented a Hadoop based image histogram calculation as a low-level image processing. A original image has three intensive levels in histrogram including i1, i2 and i3. To calculate the histogram for a image with Hadoop, the original image is sliced into sub-images and stored on HDFS.
Then, the following three steps are performed like figure 6.
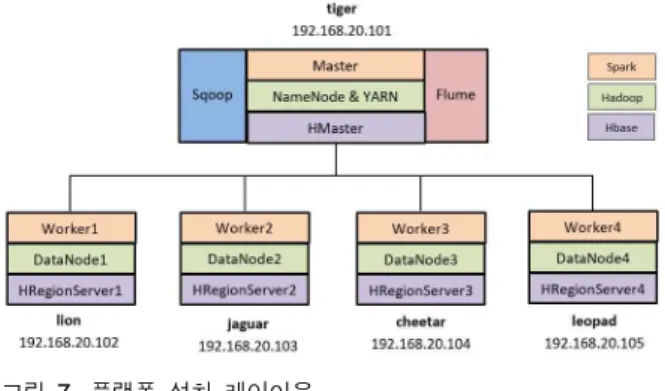
그림 7. 플랫폼 설치 레이아웃
Figure 7. Layout of platform deployment Step 1: Each file is read, then the intensities of pixels are
calculated by map tasks. The input for each map task is a pair (key, value), in which key is identified by file name and value is the content of sub-image. The output of map task is the list of (key’,value’), in which key’ is the intensity level and value’ is the number of pixels corresponds to the intensity level.
Step 2: It collects all of (key’,value’) pairs of map tasks, then sort and shuffle by key’. The pairs with the same key’ usually are gathered belong to a group which will be processed by the same reduce task.
Step 3: In the reduce phase, the input is the output of the combiner in Step 2, each reduce task has a different key. In this example, the key for each reduce task is chosen corresponds to each intensity level in the image. This phase performs a calculation total of pixels for each intensity level. By assembling the output of each reduce task, we can get the final result that is a histogram of the original image.
Ⅵ. Platform Deployment
To show viability of our platform, we deploy our proposed platform into real machines and evaluate it. Five machines are used to deploy the proposed platform which is composed of one master node and four slave nodes consequently named as Tiger, Lion, Jaguar, Cheetah, and Leopad as shown in Figure 7. We deployed Spark, Hadoop, Hive, Hbase on all of 5 machines. Each slave node has 4 CPU cores and 16GB of RAM. The IP address of the master node sets to 192.168.20.101, and other slave nodes, region servers, or workers have IP addresses from 192.168.20.102 to 192.168.20.105. The network deployment of the big data frameworks in our platform is as shown in Figure 7.
For Hadoop framework, the NameNode process and the YARN cluster manager are launched on the master node, and each slave node is responsible for launching its own DataNode process. In our platform, the amount of physical memory which is allocated for containers in our Hadoop framework is 64GB.
Therein, the minimum allocation for every container request at the resource manager sets to 1GB, the amount of memory to request from the scheduler for each map/reduce task sets to 2GB.
For Spark framework, the master process and the built-in standalone cluster are started on the master node. Each worker is responsible for launching the executor process. Here, the amount of memory to use for the driver process set to 1GB, while amount of memory to use per executor process set to 14GB.
For HBase framework, the HMaster process is launched on the master node. This master processes may be collocated with the
Hadoop NameNode and Resource Manager. Designate the remaining nodes as RegionServer nodes. Each node runs a RegionServer, which may be collocated with a Hadoop NodeManager and a DataNode.
Besides, other frameworks which support to import and transfer the data to HDFS such as Sqoop and Apache Fume are launched on the master node.
Ⅶ. Evaluation
In this section, we evaluate our platform in three main function including : data collecting, data storage and data processing.
6-1 Evaluation of Data Collecting
For real-time data collecting, we deployed Flume on master node, in which, one agent is configured to collect the data that are generated by the web site of Gwangju Seobu market. We implemented an application to simulate a service that provides product price data in real-time manner, the data are collected from the web site of Gwangju Seobu market and generated to the text file in every two minutes. The Flume agent monitor this file and transfer the data to HDFS in our system. Through this evaluation we observed that the HDFS files are created in every two minute successfully.
For archival data collecting, we experimented with crawling data generated by two sites, Gwangju Seo market and Eomgung market in 6 months from January 2016 to June 2016. Here, we run only one Hadoop job with 12 map tasks, and it takes 788 minutes to collect price data from 144,000 web pages. That is, price data of each page are collected in around 330 milliseconds.
On the other hand, with the single machine with 8 CPU cores, the
total time cost for collecting similar amount of archival data takes
more than 8000 minutes. According to these results, it is observed
그림 10. 다양한 데이터 크기에 대한 하둡과 스파크 성능 비교 Figure 10. Comparison between Hadoop and Spark with
varying data size.
그림 8. 연속 검색의 성능 비교
Figure 8. Comparison of sequential searching
그림 9. 무작위 검색의 성능 비교
Figure 9. Comparison of random searching
that our platform can collect archival data more efficiently that powerful standalone solutions.
6-2 Evaluation of Data Storage
In order to evaluate the performance of data storage in our platform, we setup an experiment on Spark to compare the execution time of searching data stored in HDFS and HBase. We perform a sequential searching to calculate the total field area of each farm in agricultural dataset. It is useful for a manager who monitors the statistic information of each farm. Another case is random searching to calculate total field area of some given farms specified by Farm IDs. It is useful for a user to get the information of a specific farm.
Figure 8 shows the result of sequential searching. In this case, Spark with HDFS performs faster than Spark with HBase. On the other hands, in the case of random searching, Spark with HBase has better performance than Spark with HDFS as shown in Figure 9. Because HBase provides Column-Family mechanism and Row-ID access, Spark with HBase spends less time in reading data in random.
6-3 Evaluation of Data Processing
For evaluating the performance of handling non-iterative jobs, we implement a computation module for calculating total field area of farms on Hadoop and Spark. Figure 10 shows the execution time each computation module on various size of dataset from 0.5GB to 2.0GB. From the result, it is observed that the execution time of Hadoop and Spark increases along with the size of data. It is also observed that the computation module running on Spark outperforms Hadoop around 1.4 times in an average of execution time for all cases of data size.
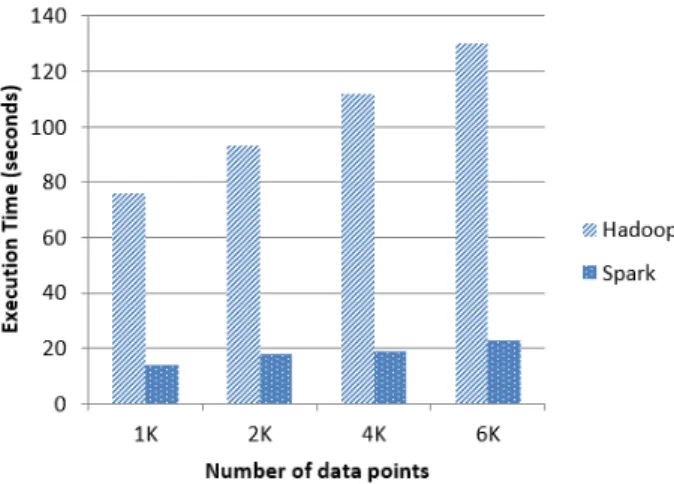
For evaluating the performance of handling iterative jobs, we implement a computation module for clustering soil data with K-means algorithm on Hadoop and Spark. To compare the performance between Hadoop and Spark in detail, the number of data points for clustering and the number of iterations are varied.
Figure 11 and Figure 12 shows the results of running K-means algorithm with various number of data points and various number of iterations, respectively. In both figures, it is observed that the execution time of Hadoop increases greatly along with both of parameters but Spark keeps the execution time relatively smaller than Hadoop. In Figure 11, Spark is around 5.5 times faster than Hadoop for varying number of data points. In Figure 12, Spark is around 2 time faster than Hadoop with two iterations, but Spark is about around 6 times faster than Hadoop with eight iterations.
According to these results, it is proved that iterative jobs are well suited to Spark rather than Hadoop.
For evaluating the performance of image processing module,
we implement a image processing module for calculating
histogram of images on Hadoop. For evaluating the performance
of our platform with large amount of image data, multiple data
sets of crop/weed images with different number of images from
그림 13. 제안된 플랫폼과 기존 로컬 솔루션간의 이미지 처리 수행시간 비교
Figure 13. Comparison of execution time of image processing between our platform and Local -based solution
그림 12. 반복횟수에 따른 K-mean 알고리즘 수행시간 Figure 12. Execution time of K-means algorithm with
various number of iterations
그림 14. CPU 코어 개수에 따른 이미지 처리 수행시간 Figure 14. Execution time of image processing with
various number of CPU cores 그림 11. 데이터 포인트 개수에 따른 K-mean 알고리즘 수행시간
Figure 11. Execution time of K-means algorithm with various number of data points
100 to 800 are collected from Internet. The size of each image is around 1.5MB in average. Then, the image processing module runs (1) an algorithm for converting the color image to grayscale image and (2) Otsu’s algorithm for the binarizing image, which are in Low-level Image Processing module. To compare the performance of our platform with a traditional image processing technique, we also implemented a program in Java which conducts the same algorithms in a single machine. We named this program using a single machine as local-based approach through this evaluation.
Figure 13 shows the comparison of execution time between our proposed platform and local-based approach. With a small image dataset (100 images), the execution time of local-based approach is smaller than our platform. Because our platform needs to read/write the data at the initial state of the whole process, so it spends more time to setup the process than
local-based approach. However, with a large image data set more than 400 images, our platform executes faster than local-based approach. Thus, our platform is more scalable in aspects of the volume of input dataset.
We also evaluate the efficiency and scalability in the aspects of
CPU cores. Figure 14 shows the execution time of image
processing algorithms with 400 images on our platform with
various number of CPU cores from 8 to 32. It is observed that the
execution time decreases dynamically when the number of CPU
cores increases. The execution time with 8 CPU cores takes more
1000 seconds; meanwhile, the execution time with 32 CPU cores
decreases down to 229 seconds. That is, our platform is much more efficient and scalable than local based approach in the aspects of processing power as well.
Ⅷ. Conclusion
We presented a novel design of a platform for collecting, storing and analyzing agricultural big data. In the aspect of collecting modules of our platform, Apache Flume is used to crawl the real-time data which simplifies collecting data from many sources and transfers data to HDFS. Hadoop is used to collect the archival data such as huge data set from multiple web sites, in which only map function is utilized in combination with Jsoup API to speed aggregate data. Moreover, Sqoop is used to import offline data to HDFS, Hive, and HBase. In the aspect of storage modules of our platform, HDFS is used for the basic storage module which contains the raw data of our platform and supports sequential data searching algorithms. HBase is used for a storage module which supports efficient random data accessing algorithms. Moreover, Hive is used for supporting simple SQL style data queries. In the aspect of processing modules, templates for non-iterative and iterative jobs are supported and low and high level image processing jobs are supported. Especially, Spark is used for templates of non-iterative jobs in order to decrease the execution time.
For future works, we focus on applying additional analysis templates with deep learning techniques for our platform to provide more efficient and useful information to the users.
Acknowledgement
This work was carried out with the support of "Cooperative Research Program for Agriculture Science and Technology Development (Project No. PJ01182302)" Rural Development Administration, Republic of Korea.
References